Original Article
Prognostic value of transducer of ErbB2.1
(TOB1) expression in patients with gastric
cancer: tissue microarray analysis
Yong Yang1*, Xiaojun Shen2*, Kekang Sun2
1Department of General Surgery, First Hospital Affiliated to Soochow University, Suzhou, Jiangsu, China; 2Department of Gastrointestinal Surgery, Kunshan First People’s Hospital Affiliated to Jiangsu University,
Kunshan, Jiangsu, China. *Equal contributors.
Received May 12, 2018; Accepted June 22, 2018; Epub August 1, 2018; Published August 15, 2018
Abstract: Background: Transducer of ErbB2.1 (TOB1) protein plays an important role in cell cycle regulation, apopto-sis induction, and metastaapopto-sis inhibition. However, the prognostic value of TOB1 in the survival of gastric cancer (GC) patients has not been examined. Methods: In the present study, western blot and real-time qPCR were used to de-tect the protein and mRNA level of TOB1 in fresh samples from GC patients. A tissue microarray comprising 90 pairs of primary GC and adjacent normal tissues was analysed using immunohistochemistry. Western blot analysis of 16 samples from GC patients showed that 81% (13/16) of patients exhibited decreased expression of TOB1, and real-time qPCR analysis showed that GC patients had decreased expression of TOB1 mRNA. Results: Tissue microarrays showed that 72.2% of gastric cancer tissues exhibited down-regulated expression of TOB1, and the expression level was significantly lower in cases with poor differentiation and positive lymph node metastasis, compared with normal tissues. Moreover, the Kaplan-Meier analysis indicated that patients with low TOB1 expression had shorter survival time than those with high TOB1 expression (5-year survival rate, 26.2% vs. 56.0%, P=0.002). In addition, multivariate analysis indicated that TOB1 was an independent prognostic factor for outcome in gastric cancer (HR, 0.256; 95% CI, 0.127-0.514; P=0.000). Conclusions: Down-regulated TOB1 expression was found in gastric cancer. Furthermore, low TOB1 expression may be an independent indicator of poor prognosis in gastric cancer.
Keywords: Transducer of ErbB2.1, gastric cancer, prognosis
Introduction
Gastric cancer (GC) ranks as the fourth most common malignancy and second leading cause of cancer mortality worldwide [1]. Incidence rates of this cancer vary regionally, and more than 70% of GC occurs in developing countries. GC in China constitutes approximately 33% of all cases worldwide [2-4]. The prognosis of this malignancy remains poor, with 25%-35% 5-year survival rate for loco-regional disease, despite its current treatment protocol incorporating chemotherapy or radiation into surgical resec-tion [5, 6]. Thus, novel molecular markers that can be exploited to determine prognosis and identify targets should be explored and charac-terized for the development of novel therapies because of the high incidence and mortality of GC.
Transducer of ErbB2.1 (TOB1) is a member of the B-cell translocation gene/transducers of ErbB2 antiproliferative protein family, which
was firstly discovered in 1996 [7, 8]. The anti -proliferative activity of TOB1 is regulated th- rough phosphorylation and nuclear transloca-tion [9]. When activated, TOB is unphosphoryl-ated, but phosphorylation of TOB1 keeps it in- activated [10-12]. Accumulated evidence
con-firms that TOB1 functions as a tumor suppres -sor in various human malignancies including lung and thyroid cancers [13, 14]. However, the
can-cer cases with long-term follow-up and full clini-cal records.
Patients and methods
Patients and specimens
Primary GC and adjacent normal tissues used for western blot and real-time qPCR were col-lected from 16 gastric cancer patients, includ-ing 11 males and 5 females in 2017. All sam-ples were snap-frozen in liquid nitrogen after surgery and stored at -80°C before the follow-ing RNA and protein extraction. Each case was reviewed by two experienced histopathologists who were blinded to the original diagnosis. The matched tissue samples used for tissue micro-array were obtained from 90 GC patients. Surgery was performed from February 2008 to August 2008 at the Kunshan First People’s
Hospital affiliated with Jiangsu University,
Kunshan, Jiangsu, China. No patient received chemotherapy or radiotherapy prior to the oper-ation. The pathologic stages of all patients were evaluated according to the 6th edition of AJCC Cancer Staging Manual [15]. Surgical treatment comprised radical distal gastrecto-my or total gastrectogastrecto-my following the recom-mendations of the Japanese Research Society
for GC [16]. The patients were followed up for 6.5 years or until death. Survival time was measured as the time from the date of the ini-tial surgery to the date of death. The materials to be analyzed were selected by a pathologist to ensure that the samples were macroscopi-cally entirely cancerous and chosen from an area devoid of necrotic tissue. Written inform- ed consent was obtained from each patient. Ethics statement
This study was undertaken under the ethical
committee of Jiangsu University, and written
informed consents were obtained from all patients before enrolment. Collection of human gastric cancer resection specimens from patients conformed to the principles outlined in the Declaration of Helsinki.
Western blot analysis
Western blot was used to detect protein
expres-sion levels. Briefly, the tissues were sonically
[image:2.612.93.524.70.322.2]homogenized and lysed with RIPA buffer with protease inhibitor (cocktail, Roche). Protein was loaded at a concentration of 30 g per lane, separated on a 10% sodium dodecyl sulfate polyacrylamide (SDS-PAGE) gel, and then trans-ferred onto a nitrocellulose membrane. Next,
the membrane was blocked with 5% nonfat milk in PBS and then incubated with primary antibodies (Santa Cruz Biotech, Santa Cruz, CA, 1:500 dilution) TOB1 (H-18) and β-actin (C-4)
at 1:1000 overnight at 4°C. The appropriate secondary antibodies horseradish peroxidase (HRP)-labeled goat anti-mouse (GAM-007) and goat anti-rabbit (SC-2004) IgG (Santa Cruz Biotech, Santa Cruz, CA, USA) were used at
1:2000. Positive antibody reactions were detected with the enhanced
chemilumines-cence system (Union Bioscience Corporation,
Hangzhou, China) with prestained markers as molecular size standards.
Real-time qPCR
Total RNA was isolated using an RNeasy Mini Kit (217184, Qiagen, Valencia, CA), accord-ing to the manufacturer’s recommendations. After the purity and integrity of the obtained RNA was assessed, cDNA was synthesized using Superscript III platinum kit (R250-01,
Invitrogen) according to manufacturer’s instruc-tions. Real-Time PCR was performed using SYBR Green I (CS7561, Invitrogen) and run on an ABIPrism 7500 sequence detector (Applied
Bisosystems). β-actin was set as internal con -trol. The sequences of the primers used were as follows: TOB1-F: 5’-TCACTCTGCTGCTGTAAG- CC-3’; TOB1-R: 5’-GGGAGAAGTACGTGCAACCT-
3’; β-actin-F:
5’-CGACATGGAGAAAATCTGGCAC-3’; β-actin-R: 5’-GATAGCACAGCCTGGATAGCAA- 3’.
The cycle parameters were as follows: denatur-ing for 10 s at 95°C, annealdenatur-ing for 30 s at 60°C, and extending for 45 s at 70°C for a total of 40 cycles. Values were calculated using the com-parative threshold cycle (CT) method after
nor-malization to the control gene β-actin. Tissue microarrays (TMAs)
The TMA was prepared by Shanghai Superchip Co., Ltd, (Shanghai, China). All cases were
[image:3.612.93.522.72.374.2]logically reviewed using HE staining. The HE sections were examined by two independent pathologists under a light microscope. Dupli- cate 1-mm diameter cylinders from the tumor centre were selected from each case, together with precancerous nonmalignant gastric tis-sues as controls to ensure reproducibility and homogeneous staining of the slides. Single-core biopsy specimens were placed on a TMA mould with 180 pores and embedded with
par-affin. Of all the 90 pairs of GC tissues and the
compared normal tissue, 180 cores were applied per slide. The TMA blocks were
pre-pared as 4-μm thick sections and were stained
with HE. The tissues were then examined to determine whether the appropriate tumor site had been selected. Pathological diagnosis, grade and stage were retrieved from the medi-cal record.
Immunohistochemical analysis
Immunohistochemical (IHC) staining was per-formed using a standard
streptavidin-biotin-peroxidase complex method. TMA slides were incubated overnight at 4°C in a moist chamber
with primary antibody specific for TOB1 (E-1)
(Santa Cruz, CA, 1:1000). Staining with PBS, instead of primary antibody against TSP50, was used as negative control. TOB1 expression was determined by assessing semi-quantitatively the percentage of marked tumor cells and the staining intensity. The TOB1 expression level was determined by integrating the percentage of positive tumor cells and the intensity of posi-tive staining. The intensity of staining was scored as follows: negative (score 0), weak (score 1) and strong (score 2). The staining extent was scored according to the percentage
of positively stained tumor cells in the field, as
follows: negative (score 0), 0%-50% (score 1) and 51%-100% (score 2). The product of the intensity and extent score was considered as the overall IHC score (values from 0 to 4). The staining was observed and assessed by two independent pathologists who were blind to the identity of the samples. Scores for percentage of positive cells and scores for expression intensities were multiplied to calculate the immunoreactive score (IRS). IRS values of 0 and 1 were judged as low expression, whilst IRS values of 2 to 4 were considered as high expression.
Statistical comparisons
Statistical analysis was performed with the SPSS statistical software package (SPSS
Standard version 17.0, SPSS Inc.). The χ2-test was performed to analyse the association between TOB1 protein expression and clinico-pathological features. Kaplan-Meier analysis (log-rank test) was used for survival curves. The Cox proportional hazards model was used in the multivariate analysis of the factors that
were determined to be significant for overall
survival (OS) using univariate analysis. P<0.05
was considered a significant difference with a 95% confidence interval (CI).
Results
Expression of TOB1 is decreased in GC tissues To assess whether TOB1 was involved in the
pathogenesis of gastric cancer, we first detect -ed the expression of TOB1 in 16 GC patients using western blot assay. Results showed that
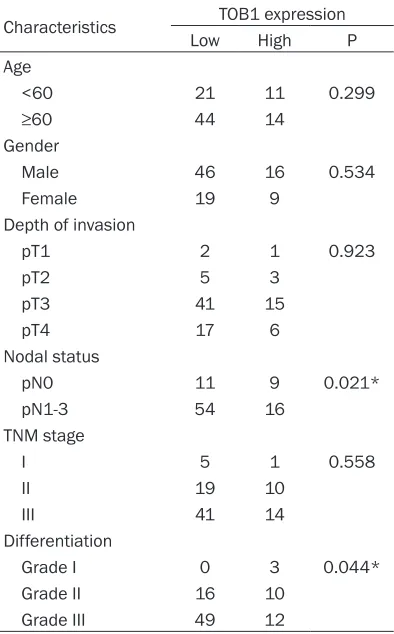
81.3% of patients with GC (13/16) had signifi -cant reduction compared with the adjacent nor-Table 1. Correlation between expression of
TOB1 and clinicopathologic factors
Characteristics TOB1 expression
Low High P
Age
<60 21 11 0.299
≥60 44 14
Gender
Male 46 16 0.534
Female 19 9
Depth of invasion
pT1 2 1 0.923
pT2 5 3
pT3 41 15
pT4 17 6
Nodal status
pN0 11 9 0.021*
pN1-3 54 16
TNM stage
I 5 1 0.558
II 19 10
III 41 14
Differentiation
Grade I 0 3 0.044*
Grade II 16 10
Grade III 49 12
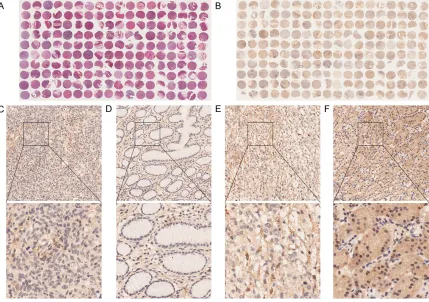
[image:4.612.91.288.97.414.2]mal tissues (Figure 1A). To further investigate whether the aberrant expression of TOB1 oc-
differentiated tumor. Six (6.7%) patients were stage I, 29 (32.2%) were stage II and 55 (61.1%) were stage III. A total of 65 (72.2%) patients had lymph node metastasis. TOB1 was highly expressed in 27.8% (25/90) of the 90 gastric cancer tissue samples. The corresponding rate in the 90 normal gastric mucosa samples was 87.8% (79/90). These results demonstrated that TOB1 expression in the cytoplasm was
significantly down-regulated in cancerous tis -sues (P<0.05).
Relationship between TOB1 protein expression and clinicopathological factors
All cases were histologically reviewed by HE staining (Figure 2A). TOB1 expression was ana-lysed by IHC TMA (Figure 2B). Thus,
representa-tive examples for these significant molecules
[image:5.612.93.369.97.471.2]are shown in the TOB1 expression sample Table 2. Univariate and multivariate analysis of clinicopathologic
factors affecting survival rate
Variables survival 5-year rate (%)
Univariate analysis P
Value
Multivariate analysis Relative risk (95%
confidence interval) P Value Age
<60 34.4 0.813 1.316 (0.728-2.381) 0.363
≥60 34.5
Gender
Male 38.7 0.415 1.129 (0.646-1.972) 0.671 Female 25.0
Depth of invasion
pT1 100 0.073 1.659 (1.118-2.461) 0.012*
pT2 62.5
pT3 30.4
pT4 26.1
Nodal status
pN0 76.0 0.000* 5.171 (1.431-18.682) 0.012* pN1-3 18.5
TNM stage
I 100 0.000* 1.599 (0.563-4.540) 0.378
II 55.2
III 16.4
Differentiation
Grade I 66.7 0.143 1.518 (0.820-2.809) 0.184 Grade II 45.2
Grade III 26.8 TOB1 expression
Low 26.2 0.002* 0.256 (0.127-0.514) 0.000*
High 56.0
*P<0.05.
Figure 3. Survival curves of gastric cancer patients according to expression status of TOB1.
curred in the transcriptional level, we adopted Real-Time PCR to determine its mRNA expression. Consistent with western blot, TOB1 mRNA ex- pression GC tissues was str- ongly decreased when compar- ed with the adjacent normal tissues (Figure 2B). Together, these data demonstrate that the reduction of TOB1 expres-sion in GC patients occurred both at protein and mRNA levels.
Patient characteristics
The characteristics of the 90 patients are listed in Table 1. The samples included 62 (68.9%) male and 28 (31.1%) female patients with gastric cancer. A total of 32 (35.6%) patients were less than 60 years old, while the other pati- ents were aged more than or equal to 60 years. Histological
classification, grading and
pa-thologic TNM staging of the tumors were based on the
cri-teria defined by the 7th
[image:5.612.91.288.492.662.2](Figure 2C-F). Relationships between patholog-ic features and TOB1 are shown in Table 1.
Reduced TOB1 expression was significantly
associated with lymph node metastasis (P= 0.021) and differentiation grade (P=0.044). No statistical connection was found between TOB1 expression and the other clinicopathologic fac-tors, such as age, gender, and clinical stage (Table 1).
Association of TOB1 expression with survival of patients with gastric cancer
Survival analyses using the Kaplan-Meier method in connection with the
clinicopathologi-cal variables and the expression profiles of
TOB1, VEGF and survivin are summarized in Table 2. Lymph node metastasis (P=0.012)
demonstrated significant correlation with OS.
In terms of the three proteins analysed, patients with suppressed TOB1 expression were likely to
exhibit significantly shorter OS compared with
those with high TOB1 expression (5-year sur-vival rate, 26.2% vs. 56.0%, P=0.002) (Figure 3). Multivariate analysis using the Cox propor-tional hazards model was performed to evalu-ate the independent prognostic predictors. The results indicated that depth of invasion (HR: 1.659, 95% CI: 1.118-2.461, P=0.012) and lymph node status (HR: 5.171, 95% CI:
1.431-18.682, P=0.012) were significant predictors of cancer-specific survival. In addition, the sup -pressed expression of TOB1 (HR: 0.256; 95% CI, 0.127-0.514; P=0.000) was found to be a
statistically significant prognostic factor.
Discussion
TOB1 is ubiquitously expressed in human adult
tissues and was first identified by screening an
expression library that detected protein-protein interactions with an ErbB2 probe [17]. TOB1 has been proposed as a putative tumor sup-pressor gene, because TOB1-knockout mice spontaneously formed tumors, and TOB1 ex- pression was not observed in human lung and thyroid cancers [18]. However, TOB1 expres-sion pattern has not yet been investigated in gastric cancer. In this study, we demonstrated that TOB1 expression was associated with the development and prognosis of gastric cancer. TOB1 expression level in the cancer tissue was
significantly suppressed than in adjacent nor
-mal tissue. The expression level was signifi -cantly lower in poorly differentiated tissues and
positive lymph node metastasis. Furthermore, our study also indicated that TOB1 expression may be used as an independent prognostic fac-tor for predicting patient OS, because low cyto-plasmic expression is correlated with unfavour-able outcome. Previous studies revealed that TOB1 proteins were distributed throughout the cytoplasm and nucleus [17]. Notably, subcellu-lar distribution varied during cell cycle phases such that higher levels were detected in the cytoplasm during late S phase than during other phases of the cell cycle [11, 19]. In the
current study, we identified that down-regulat -ed TOB1 expression may play an important role in the carcinogenesis of gastric cancer. In addi-tion, the down-regulated TOB1 expression cor-related well with poor differentiation, lymph node metastasis and poor survival.
Conclusions
The absence of TOB1 in gastric cancer may be an independent marker of a poor prognosis. Additional functional studies are needed to examine whether TOB1 activity has relevance in the treatment of HER2-positive GC with future therapies targeting ErbB2 signalling.
Acknowledgements
This work was supported by grants from the National Natural Science Foundation of China (No.81302386), the Science and Technology Program of Suzhou City (SYSD2013023), the Science and Technology Project of Jiangsu
University (JLY20140049) and the youth proj -ect “science and education Xingwei” of Suzhou City (KJXW2016062).
Disclosure of conflict of interest None.
Address correspondence to: Kekang Sun, Depart- ment of Gastrointestinal Surgery, Kunshan First People’s Hospital Affiliated to Jiangsu University, 91 Qianjin Road, Kunshan, Jiangsu, China. E-mail: [email protected]
References
[1] Siegel R, Ma J, Zou Z, Jemal A. Cancer stati-stics. CA Cancer J Clin 2014; 64: 9-29. [2] Ye YW, Dong RZ, Zhou Y, Du CY, Wang CM, Fu
[3] Zheng L, Wu C, Xi P, Zhu M, Zhang L, Chen S, Li X, Gu J, Zheng Y. The survival and the long-term trends of patients with gastric cancer in Shanghai, China. BMC Cancer 2014; 14: 300. [4] Yang W, Raufi A, Klempner SJ. Targeted thera -py for gastric cancer: molecular pathways and ongoing investigations. Biochim Biophys Acta 2014; 1846: 232-7.
[5] Ali Z, Deng Y, Tang Y, Zheng S, Ma N, He N. Epigenetic deregulations in gastric cancer. J Nanosci Nanotechnol 2013; 13: 40-51. [6] Ychou M, Boige V, Pignon JP, Conroy T, Bouché
O, Lebreton G, Ducourtieux M, Bedenne L, Fabre JM, Saint-Aubert B, Genève J, Lasser P, Rougier P. Perioperative chemotherapy com-pared with surgery alone for resectable gastro-esophageal adenocarcinoma: an FNCLCC and FFCD multicenter phase III trial. J Clin Oncol 2011; 29: 1715-21.
[7] Matsuda S, Kawamura-Tsuzuku J, Ohsugi M, Yoshida M, Emi M, Nakamura Y, Onda M, Yoshida Y, Nishiyama A, Yamamoto T. Tob, a novel protein that interacts with p185erbB2, is associated with antiproliferative activity. Oncogene 1996; 15: 705-13.
[8] Winkler GS. The mammalian anti-proliferative BTG/Tob protein family. J Cell Physiol 2010; 222: 66-72.
[9] Kawamura-Tsuzuku J, Suzuki T, Yoshida Y, Yamamoto T. Nuclear localization of Tob is im-portant for regulation of its antiproliferative activity. Oncogene 2004; 23: 6630-8.
[10] Suzuki T, K-Tsuzuku J, Ajima R, Nakamura T, Yoshida Y, Yamamoto T. Phosphorylation of three regulatory serines of TOB by Erk1 and Erk2 is required for Ras-mediated cell prolifer-ation and transformprolifer-ation. Genes Dev 2002; 16: 1356-70.
[11] Helms MW, Kemming D, Contag CH, Pospisil H, Bartkowiak K, Wang A, Chang SY, Buerger H, Brandt BH. TOB1 is regulated by EGF-dependent HER2 and EGFR signaling, is highly phosphorylated, and indicates poor prognosis in node-negative breast cancer. Cancer Res 2009; 69: 5049-56.
[12] O’Malley S, Su H, Zhang T, Ng C, Ge H, Tang CK. TOB suppresses breast cancer tumorigenesis. Int J Cancer 2009; 125: 1805-13.
[13] Iwanaga K, Sueoka N, Sato A, Sakuragi T, Sakao Y, Tominaga M, Suzuki T, Yoshida Y, K-Tsuzuku J, Yamamoto T, Hayashi S, Nagasawa K, Sueoka E. Alteration of expression or phos-phorylation status of Tob, a novel tumor sup-pressor gene product, is an early event in lung cancer. Cancer Lett 2003; 202: 71-9.
[14] Ito Y, Suzuki T, Yoshida H, Tomoda C, Uruno T, Takamura Y, Miya A, Kobayashi K, Matsuzuka F, Kuma K, Yamamoto T, Miyauchi A. Phosphory- lation and inactivation of TOB contributes to the progression of papillary carcinoma of the thyroid. Cancer Lett 2005; 220: 237-42. [15] Washington K. 7th edition of the AJCC cancer
staging manual: stomach. Ann Surg Oncol 2010; 17: 3077-9.
[16] Takeshi Sano, Takashi Aiko. New Japanese classifications and treatment guidelines for gastric cancer: revision concepts and major re-vised points. Gastric Cancer 2011; 14: 97-100.
[17] Tzachanis D, Boussiotis VA. Tob, a member of the APRO family, regulates mmunological qui-escence and tumor suppression. Cell Cycle 2009; 8: 1019-25.
[18] Yoshida Y, Nakamura T, Komoda M, Satoh H, Suzuki T, Tsuzuku JK, Miyasaka T, Yoshida EH, Umemori H, Kunisaki RK, Tani K, Ishii S, Mori S, Suganuma M, Noda T, Yamamoto T. Mice lacking a transcriptional corepressor Tob are predisposed to cancer. Genes Dev 2003; 17: 1201-6.