warwick.ac.uk/lib-publications
A Thesis Submitted for the Degree of PhD at the University of Warwick
Permanent WRAP URL:
http://wrap.warwick.ac.uk/108847
Copyright and reuse:
This thesis is made available online and is protected by original copyright.
Please scroll down to view the document itself.
Please refer to the repository record for this item for information to help you to cite it.
Our policy information is available from the repository home page.
Interpretation and Evaluation of Stylus
Profiling Techniques
By Man Li, BSc.
Submitted for the degree of Doctor o f Philosophy to the Higher Degrees Committee
University of Warwick
Centre for Micro-engineering and Metrology Department of Engineering University o f Warwick, Coventry, U. K.
T H E B R IT IS H L IB R A R Y
D O C U M E N T SUPPLY C E N T R E
BRITISH THESES
N O T I C E
The quality of this reproduction is heavily dependent upon the quality
of the original thesis submitted for microfilming. Every effort has been
made to ensure the highest quality of reproduction possible.
If pages are missing, contact the university which granted the degree.
Some pages may have indistinct print, especially if the original pages
were poorly produced o r if the university sent us an inferior copy.
Previously copyrighted materials (journal articles, published texts, etc.)
are not filmed.
Reproduction of this thesis, other than as permitted under the United
Kingdom Copyright Designs and Patents A c t 1988, o r under specific
agreement with the copyright holder, is prohibited.
T H IS THESIS H A S BEEN M IC R O F IL M E D E X A C T L Y A S R E C E IV E D
THE BRITISH LIBRARY
D O C U M E N T SUPPLY C E N T R E
Boston Spa, Wetherby
W e st Yorkshire. LS23 7 B Q
/ often say that when you can measure what you are speaking about, and express it in numbers, you know something about it; but when you cannot measure it, when you cannot express it in number, your knowledge is o f u meagre und unsatisfactory kind.
Contents
Contents i
List o f figures vii
List o f ta b le s xiii
Acknow ledgem ents xv
Declaration xvi
Sum m ary xvii
1 Introduction 1
1.1 A brief history of surface measurement and the advent o f stylus in
struments ... 2
1.2 Stylus profiling tech n iqu es... 4
1.2.1 Stylus in stru m en ts... 4
1.2.2 Optical profilom eters... 7
1.2.3 Scanning probe m icroscop es... 10
1.3 The necessities and requirements for evaluating the profiling technique 12 1.4 The layout o f the thesis ... 14
2 Background — Engineering Surfaces and T h e ir M easurem ent 15 2.1 Engineering s u r fa c e s ... 16
2.1.1 W h at is an engineering su rfa ce?... 16
2.1.2 T h e structure of a s u r f a c e ... 16
2.1.3 Surface top ograp h y... 17
CONTENTS
2.2.1 The mechanical properties o f a s u r fa c e ... 21
2.2.2 The physical properties of a s u rfa ce... 24
2.2.3 The chemical properties of a surface... 26
2.2.4 Surface functions in engin eerin g... 29
2.3 Numerical descriptions o f surfaces... 30
2.3.1 Statistical aspects o f surface p a ra m e te rs ... 30
2.3.2 Surface parameters and surface functions... 35
2.4 Surface measurement techniques and instruments — Panorama . . . . 36
2.4.1 Profile m ea su rem en t...37
2.4.2 Area m ea su rem en t...37
2.4.3 Discussion of different measuring tech n iqu es... 38
2.4.4 The relationship between surface functions and surface mea surement ...43
3 3D Surface D ata Collection U sing D igital Techniques 45 3.1 Introduction... 46
3.2 Review of numerical models of mapping schemes... 48
3.3 The hexagonal mapping model o f surface sampling theory ... 50
3.3.1 Definitions o f summit height, slope and c u rv a tu re ... 51
3.3.2 The summit height density function and its expectation . . . . 53
3.3.3 The relationship between slope, curvature and h e i g h t ... 55
3.4 Results for independent ordinates using different mapping schemes . . 56
3.4.1 The probability o f an ordinate being a summit as h —► oo . . . 56
3.4.2 The expected summit density and the expected summit height as h —» o o ... 57
3.5 The limiting behaviour o f the hexagonal sampling model as h —♦ 0 . . 58
3.6 Comparison of several different mapping s c h e m e s ... 63
CONTENTS iii
3.6.2 Computing time test by different sampling s c h e m e s ... 64
3.7 D iscu ssion...65
3.7.1 T h e trends of summit parameters with the complexity o f nu merical m o d e l s ... 65
3.7.2 Information C o lle c tio n ...68
3.7.3 Correlation between o r d in a te s ... 68
3.7.4 Considerations o f surface simulation techniques based on frac tal t h e o r y ... 69
3.8 Application of 2D sampling theory ... 70
3.8.1 Application of hexagonal sampling s c h e m e ...70
3.8.2 Potential application of surface measurement using 2D sam pling t h e o r y ... 71
3.9 Conclusion...71
4 Effects o f T ip Dimension on Surface D a ta Collection 73 4.1 In trod u ction ... 74
4.2 Fabrication o f stylus t i p s ... 75
4.2.1 Building-up t e c h n iq u e ... 75
4.2.2 Techniques of fabrication from large scale to s m a ll...77
4.3 Review o f the geometrical effect o f the stylus t i p ...79
4.4 Effect o f the stylus d im e n s io n ... 82
4.4.1 T h e effect on surface measuring p a r a m e te r s ...83
4.4.2 Filtering characteristics o f the s t y l u s ... 83
4.4.3 Effect of the stylus s i z e ... 88
4.4.4 Effect of the stylus sh ape... 91
4.5 Conclusion...94
CONTENTS iv
5.2 The formation of a stylus t r a c e ...97
5.2.1 Analysis of stylus trace fo r m a tio n ... 98
4.3.1 Analysis stylus trace formation ... 98
5.2.2 Discussion o f the re la tio n s ... 102
5.3 Geometrical analysis o f the trace form a tion ... 104
5.4 Computer simulation o f a stylus trace fo rm a tio n ... 106
5.5 Discussion... 108
5.5.1 Determining the profile from the stylus and the t r a c e ... 108
5.5.2 The stylus geometry from the inside and the outside traces of a profile... 109
5.6 Applications... 112
5.6.1 A method for measuring the stylus dimension based on the trace fo r m a tio n ... 112
5.6.2 Th e use of t h e ‘ deconvolution’ in a micro-hardness test . . . . 114
5.7 Conclusion... 115
6 M easurem ent of the Stylus T ip D im en sion U sing A K n ife-ed ge 116 6.1 Introduction... 117
6.2 Importance of checking s t y lii... 117
6.3 Review o f stylus checking methods ... 118
6.4 The knife-edge m e t h o d ... 120
6.4.1 Th e theoretical basis of the d esign ...121
6.4.2 The design... 123
6.4.3 E x p e rim e n ta tio n ... 126
6.5 Discussion...129
6.5.1 Selection of a material for the k n ife -e d g e ... 130
6.5.2 Improvement o f traverse displacem ent... 131
CONTENTS
7 Mechanical A n a ly s is of the Stylus Instrum ent 134
7.1 In trodu ction ...135
7.2 Stylus pick-up s y s te m ... 136
7.3 Static characteristics of the s y s t e m ...137
7.3.1 Accuracy ... 137
7.3.2 L in e a r ity ... 138
7.3.3 S e n s itiv ity ...140
7.3.4 R e s o lu tio n ...140
7.4 Dynamic characteristics o f the system ... 141
7.5 Analysis and tests of characteristic coefficients on the pick-up . . . .142
7.5.1 Th e spring r a t e ... 142
7.5.2 Th e natural frequency /„ 144 7.5.3 Th e effective mass m* ... 146
7.5.4 Th e dam ping coefficient T ...147
7.6 Discussion o f the r e s u lt s ... 152
8 Contact Forces in t h e Stylus Instrum ent 155 8.1 Introduction...156
8.2 Literature r e v i e w ...157
8.3 Static loading force and surface d e fo rm a tio n ...158
8.4 Force a n a ly s is ... 159
8.5 Experimental m e th o d ... 163
8.5.1 Calibration o f the system stiffness of the L V D T ...165
8.5.2 Calibration o f the coefficient of fr ic t io n ... 166
8.6 Static loading force test ... 168
8.6.1 Th e p r i n c i p l e ... 168
8.6.2 Fabrication o f the step specimen...169
8.6.3 Th e experiment and the r e s u lt s ... 170
CONTENTS
8.7 Dynamic force t e s t ... 172
8.7.1 The relationship... 173
8.7.2 The experimental resu lts... 173
8.7.3 Analysis o f the r e s u lt s ...176
8.8 D iscussion... 178
8.9 Consideration of friction in the stylus type o f instruments... 179
8.9.1 Discussion o f local fr ic t io n ... 179
8.9.2 The effective friction c o e ffic ie n t... 180
8.9.3 Cross-correlation of surface information and fr ic tio n ... 181
8.10 Conclusion... 182
9 G en eral Discussion and Conclusions 184 9.1 General discussion ...185
9.1.1 A tool for surface functional study ...185
9.1.2 Scanning probe m icroscopes... 187
9.2 Future development o f measurement and instrumentation... 190
9.2.1 The measuring o b je c t...190
9.2.2 Area assessment... 191
9.2.3 Measurement integration... 192
9.2.4 The size o f instruments... 193
9.3 Conclusion... 194
A p p e n d ix 195
A S o m e basic concepts 196
B A p p e n d ix by W hitehouse & Phillips (1982) 199
C T h e exp ected summit curvature o f 7-point model 202
CONTENTS vii
E T h e reduction form ulae by Plackett (1954) and D avid (1953) 205
F B S 1134: P A R T 1: 1988 207
G T h e Specifications o f the Talysurf-5 213 H T h e C om p u ter Program m es 214
List o f Figures
1.1 Th e history & development o f the stylus type o f instrument... 5
1.2 Schematic o f the stylus instrument... 6
1.3 Schematic o f the skid datum system... 6
1.4 Optical system for surface measurement using a knife-edge... 8
1.5 O ptical system for surface measurement by detecting the change of the intensities... 9
2.1 A schematic showing the structure o f a metallic surface... 17
2.2 The characteristic components o f a technical surface... 18
2.3 Some typical engineering surfaces... 19
2.4 Diagram showing areas o f real contact between two rough surfaces. 22 2.5 The conductivities of polymers in n - I m-1 compared with metals, semiconductors and insulators... 27
2.6 Measurement terminology... 31
2.7 The height distribution of surface textures... 32
2.8 Skewness and kurtosis... 33
2.9 The ‘ Stedman Map’ . Talystep: dot screened area; Topografiner: short-dashed line; ‘typical’ S T M / A F M : solid line; dotted line shows lim it with gap increased; wide range STM (Tsuda): long-dashed line. 40 2.10 Illustration o f the interaction between different surface measuring methods with different surface materials...42
LIST OF FIGURES ix
3.1 Different mapping schemes, (a ) 3-point model; (b ) 4-point model;(c) 5-point model; (d ) 7-point model and (e ) 9-point m odel...49 3.2 Hexagonal sampling scheme...51 3.3 Th e computing time and the p r(T k + i) by different 2D sampling mod
els... 65
3.4 Diagram showing the expected summit density and the expected sum
mit height for different models (indicated by their k value) as h —* 0. 66 3.5 The probability o f an ordinate being a summit as h —► o o ... 67
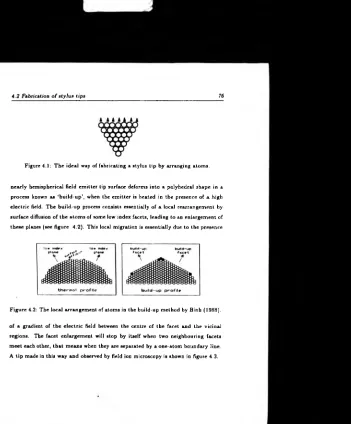
4.1 The ideal way of fabricating a stylus tip by arranging atom s... 76
4.2 The local arrangement of atoms in the build-up method by Binh (1988). 76
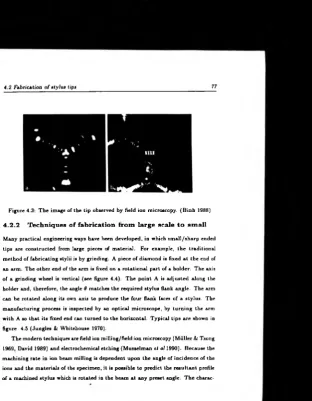
4.3 The image of the tip observed by field ion microscopy. (B inh 1988) 77
4.4 Th e traditional way of manufacturing stylii...78 4.5 (a ) Typical tip as used on the Talysurf instruments; (b ) Talystep
sharp stylus which is used for resolving very fine surface texture. . . . 79
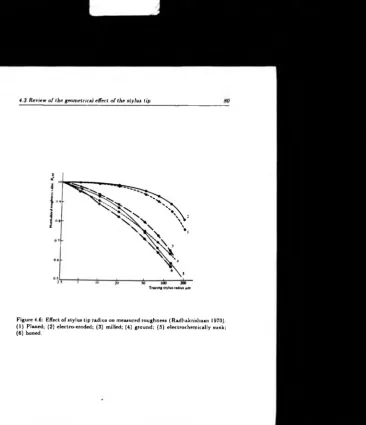
4.6 Effect o f stylus tip radius on measured roughness (Radhakrislman
1970). (1) Planed; (2) electro-eroded; (3 ) milled; (4 ) ground; (5)
electrochemically sunk; (6) honed...80 4.7 The three types o f stylus discussed in the paper... 82
4.8 A comparison o f a sine wave profile, its simulated trace and the trace
calculated by Nakamura’s formulas, (refer to programs fo r m - t r a c e . m & nakamura.m in Appendix H ... 85 4.9 The triangle for determination o f the stylus filtering character in the
E-system... 85 4.10 The PSF of a profile and the trace by a round tip and the transfer
function. (In these figures, ‘envelope’ is the tra c e .)...86 4.11 Th e PSF of a profile and the trace by a triangle tip and the transfer
LIST OF FIGURES
4.12 The PSF o f a profile and the trace by a normal tip and the transfer
function... 87
4.13 The height distribution of a profile...88
4.14 The height distributions of a trace by circular tips of different sizes of (a) 5 pm, (b ) 10 pm, (c ) 20 pm and (d ) 40 pm. The background is the distribution o f the profile... 89
4.15 The slope distribution of profile and its trace by circular tip of 10 pm. ( L e f t ) ... 90
4.16 The curvature distribution o f profile and its trace by circular tip of 10 pm. ( R i g h t ) ... 90
4.17 The comparison o f the curvature distributions o f the profile after correction o f the stylus shape with the original profile... 90
4.18 The height distributions of (a ) a profile, and (b ) o f its traces by a triangular tip, (c ) a circular tip and (d ) a normal tip... 92
4.19 The slope distributions of (a ) .he profile, and o f its traces by (b ) a circular tip, (c ) a triangular tip and (d ) a normal tip... 93
4.20 The curvature distributions o f (a ) the profile, and o f its traces by (b) a circular tip, (c ) a triangular tip and (d) a normal tip...94
5.1 Diagram showing a surface profile and its trace by a finite stylus. . . 97
5.2 The traces by a dot and a line... 98
5.3 The trace of a round stylus over a convex and a concave circular profile. 100 5.4 Analytical diagram o f trace formation... 101
5.5 The relationship between the profile, the stylus and the trace... 104
5.6 Differential analysis of the formation...105
5.7 Diagram showing digitized stylus tip... 106
5.8 Computation o f a stylus trace formation... 107
LIST OF FIGURES xi
5.10 Th e traces formed as the stylus travels over the profile from the out
side and beneath...I l l
5.11 Th e definition and relationship between contact distance... 112
5.12 Th e bias by the stylus on the depth o f the intentation in micro hardness test. (Smith 1 9 9 0 ) ... 114
6.1 Scanning electron micrographs o f a new stylus tip: (a ) side view; (b ) side view at 90° to that in (a ); (c ) top plan view. The tip radius is found to be about 4 /¿m... 118
6.2 A grating for checking stylus - ‘stylus check’ ... 119
6.3 Th e system for stylus tip measurement... 121
6.4 Th e device for form measurement o f stylus tip... 124
6.5 Stylus force analysis ... 125
6.6 Photograph o f the spring traverse system with razor blade... 127
6.7 The whole construction of the <nife-edge checking stylus shape. . . . 127
6.8 Th e graph o f the stylus tip obtained from the computer... 128
6.9 A photograph of the stylus tip from a SEM ... 129
6.10 A SEM photograph of the damaged blade after use... 130
6.11 A photograph of the diamond edge from SEM after use... 131
6.12 A possible method to protect of the knife-edge from collision... 132
6.13 Improved coil/magnet system — dual magnet system... 132
7.1 A flow diagram of a stylus system... 135
7.2 The basic stylus assemblage of the Talysurf 5 instrument...137
7.3 Nonlinear effect o f the stylus tip length when the stylus arm moves upwards and downwards... 139
7.4 Equivalent analytical system o f the stylus assembly...141
7.5 The stylus position for the spring rate test... 143
LIST OF FIGURES
7.7 Analytical diagram o f the pick-up beam...146
7.8 The instrument responses with different damping ratios...149
7.9 Logarithmic decrement...150
7.10 The record from the Digital Spectrum Analyzer TR9403... 150
8.1 A surface damaged by a stylus... 160
8.2 Diagrams showing the reactional force o f a stylus and the relative velocity between a stylus and a surface... 161
8.3 Analysis o f the force at the contact point between the stylus and a surface... 161
8.4 The diagram o f indirect method o f measuring the forces... 163
8.5 The L V D T used in the experiment constructed by Smith (1989). . . . 164
8.6 The construction o f LVD T stiffness test... 165
8.7 Three examples for the adjustment in the friction coefficient test. . . 167
8.8 The record o f the step specimen from the Talysurf-5...169
8.9 The experimental construction o f the force test... 171
8.10 The records from the Talysurf-5 (upper) and the Talystep (down) for a ground silicon surface... 174
8.11 The horizontal force given by the bending beam o f the stylus...175
8.12 The cross-correlation between the profile and the L V D T displacement. 175 8.13 The experimental result of /?„ from £ Fh and from the eqn. 6.12. . . 176
8.14 The relationship between the travelling speed and the R'v ... 178
8.15 The auto-correlation functions o f the profile and the displacement. . . 179
LIST OF FIGURES x/ii
9.2 Dependence of measured corrugation on size of tip for Au(001) — (5 x
1) (solid line and filled circle), i4u(110) - ( 1 x 2 ) (broken line and triangle), S . ( l l l ) - (7 x 7) ( — .— ), S » ( l l l ) - (2 x 1) (dotted line), and most metals without reconstruction ( — ..— ). (Kuk & Silverman 1989)... 189 9.3 Feature scale of size...191
9.4 A scheme for combining measurement o f the surface profile and the
List of Tables
3.1 Probability of an ordinate being a summit in a unit surface area by
independent ordinates... 57
3.2 Th e expected summit density and the expected sum m it height as h - * oo...58
3.3 Expected summit (peak) density as h —► 0...63
3.4 Th e expected summit (peak) height as h —» 0...64
4.1 T h e surface roughness parameters o f tips with different sizes and shapes. 83 7.1 T h e spring rate test... 143
7.2 T h e damping ratio ( . (Pearson, 1957)... 148
7.3 Table o f results for the damping ratio...151
8.1 Testing results of the LVD T stiffness... 166
8.2 T h e result list of the static force test... 170
[image:19.436.29.399.31.426.2]D e cla ra tio n
This thesis is presented in accordance with the regulations for the degree o f Doctor of Philosophy by the Higher Degree Committee at the University o f Warwick. The
thesis has been composed and written by myself based on th e research undertaken by myself. The research materials have not been submitted in any previous application for a higher degree. A ll sources o f information are specifically acknowledged in the content.
A c k n o w le d g e m e n ts
It is my pleasure to express my gratitude to Prof. D. J. Whitehouse, my supervisor, for his guidance, encouragement, suggestions and comments during the course of research described in this thesis.
M y sincere thanks go to Prof. D. K. Bowen, who became my supervisor at the later period of my work because Prof. Whitehouse was in sick leave, for his comments and suggestions about the construction o f the thesis. I appreciate very much his dynamic working style.
Thanks to Dr. D. G. Chetwynd and Dr. S. T . Smith for introducing me to the practical aspects o f the experiments and tests, also for their enthusiasm and discussions.
To Mr. R. A. Bridgcland & Mr. D. J. Robinson for their careful manufacture and for their help in constructing experimental work.
To Mr. R. D. Dale-Jones for his continuous effort and help in improving the language of this thesis. W ithout it, this thesis would not be as fluent as it is today.
S u m m a ry
T h e object o f this P h .D work is to validate stylus profiling techniques for ultra-high preci sion measurement and positioning in engineering. Stylus methods have been used exten sively and successfully in the past in the fields o f manufacturing control and components function study, but some problems still exist. Now their role has considerably expanded with the appearance o f scanning probe microscopes and the new emphasis on nanotech nology, which shortens the gap between engineering and physics.
T h e profiling technique is interpreted and evaluated in terms o f the mechanical aspects o f data collection through a stylus surface instrument. This w ork contains: ( a ) 3D digital sampling techniques; ( b ) effects o f the finite dimension o f stylus and (c ) forces contributing to measurement.
1.1 A brief history o f surface measurement and the advent o f stylus instruments 2
1.1
A b r ie f h is t o r y o f su rface m easu rem en t and
th e ad ven t o f stylus in stru m en ts
A t the end of the 19th century and the beginning o f the 20th century, the devel opment o f mechanical industry encouraged the transfer of skill from man to ma chine. More attention began to be paid to the surface finish o f components. The interchangeability o f components, which started as early as 1902, and the increase in machining precision required a better surface finish. As G. Schlesinger (1942)
pointed out:
“ In the production o f mechanical components the principal steps in volved are in four essential categories: (1 ) metallurgical, (2) physical, (3) dimensional, (4 ) surface roughness.”
High precision machining led to a great improvement in the surface finish. It was found that surface finish affects both the working life of the component and the speed o f manufacture. T h e direct result o f a roughly finished surface is friction.
Higher friction demands larger work and more energy from the two mating surfaces. In a bearing system, a rough surface between the contacting parts leads quickly to wear, limited rotational speed and machine noise. Surface finish has also been
found to have a marked effect in the region of boundary lubrication (Norton, 1942). In machine tool machinery, if the cutting edges o f the tools are sharpened and finished carefully, their life w ill be prolonged. In other mechanical parts like engines, cylinders, crankshafts and gear manufacture, etc., surface quality and finish are also important (Page, 1948).
In Britain, investigations into surface finish were started soon after the estab lishment o f the Research Department of the Institution of Production Engineers
stan-1.1 A brief history o f surface measurement and the advent o f stylus instruments 3
dard was published (B S 1134: 1950). In America, a similar approach was taken. A preliminary American Surface Standards (B.46) was on trial for about two years in
1940. By 1955, these standards were as sophisticated as the ASA-B46.1 (1955). In other European countries, for example Germany, a book concerning stylus finishing techniques was written by G. Schmaltz, and published as early as 1936. T h e surface standards DIN 4760-4764 was formed from 1952 to 1954 (Schorsch, 1958).
A t the same time, surface measuring instruments (including stylus instruments) were also developed. Among them, there were both quantitative and qualitative types. For example, Ab b ott’s profilometer, the Taylor-Hobson Surfacemeter and the Schmaltz profile microscope are o f quantitative type. The qualitative analysis instruments were normally comparison microscopes, e.g. Klem m ’s Comparoscope and the Vickers projection microscope. Most stylus instruments are o f quantitative type, so they have been developed most. They are used not only to insure the quality o f the surface finish, but also to analytically study the surface performance.
O ver the last 40 to 50 years, surface profiling techniques have progressed. For instance, optical and laser techniques, electronic techniques and computing pro gramming techniques have been developed. The evolution o f the stylus instrument
can be seen from the development o f the sensors used to transfer the signal from the stylus pick-up. Earlier, the signal from the stylus beam was recorded by a photographic method. A beam o f light is shone onto a mirror fixed at one end of the stylus beam and then reflected onto a photographic film. Later, electricai sen sors such as an inductor or a capacitor replaced the photographic film. Recently, laser techniques like the interferometer have increased the accuracy and stability of the pick-up system. Electronic digital techniques and computer programming have made calculations more comprehensive.
Surface measurement, especially the use o f stylus instruments, are the result of engineering requirements. The surface of a component can be used to m onitor the
1.2 Stylus profiling techniques 4
manufacture. Most functional studies concern contact situations and changes to the
two surfaces after a relative movement.
1.2
S tylu s p rofilin g te ch n iq u es
Stylus profiling techniques check or evaluate things like surface texture, in a similar way to the human fingernail. In fact, the fingernail could be regarded as a primitive stylus, in the same way as the eye can be compared with the interferometer. The stylus instrument is a comprehensive profiling technique.
Stylus profiling techniques can be categorized into three generations or types: mechanical, optical and physical. T h eir representatives are: (1) stylus instruments,
(2 ) optical profilometers and (3) scanning probe microscopes, respectively. Although they are different generations, none o f them can replace completely the previous one. Optical profilometers have some overlap and extension o f utilization over stylus instruments. Scanning probe microscopes have been developed recently. They have wider application and great potential. Each o f them w ill be introduced below.
1.2.1 Stylus instruments
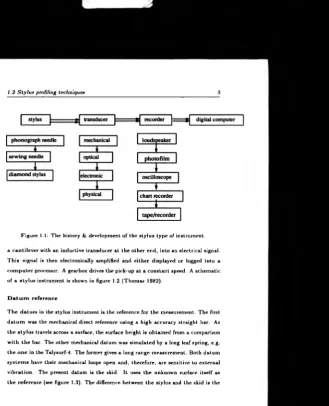
Th e history o f the development of stylus instruments is shown in figure 1.1. In the
first row, the three basic elements in the construction o f the instruments are listed: (1 ) stylus; (2 ) transducer and (3 ) recorder. Th e techniques become progressively more recent as the columns are descended.
The principle o f the stylus instrument’s measuring processes can be described in the following manner: a stylus is moved along a surface. It is connected with a pick-up unit which is maintained in a controlled level, yet permits the stylus to follow intimately the physical surface of the part. Variations of the surface in relation to the level o f the pick-up translation will cause the stylus to deflect from
1.2 Stylus profiling techniques 5
Figure 1.1: The history & development o f the stylus type o f instrument.
a cantilever with an inductive transducer at the other end, into an electrical signal. T his signal is then electronically amplified and either displayed or logged into a
com puter processor. A gearbox drives the pick-up at a constant speed. A schematic o f a stylus instrument is shown in figure 1.2 (Thomas 1982).
D a t u m reference
T h e datum in the stylus instrument is the reference for the measurement. The first datum was the mechanical direct reference using a high accuracy straight bar. As the stylus travels across a surface, the surface height is obtained from a comparison
w ith the bar. The other mechanical datum was simulated by a long leaf spring, e.g. the on e in the Talysurf-4. The former gives a long range measurement. Both datum systems have their mechanical loops open and, therefore, are sensitive to external
[image:27.434.39.369.21.428.2]1.2 Stylus profiling techniques 6
Pick-up
Figure 1.2: Schematic of the stylus instrument.
their spatial bandwidth: the skid has a much smaller spatial bandwidth. In other words, it is only sensitive to much lower frequencies. This system is intrinsic but approximate and dependent on the separation of surface wavelength.
Figure 1.3: Schematic of the skid datu m system.
[image:28.433.41.397.22.441.2]1.2 Stylus profiling techniques 7
form, so a much finer stylus is needed1 for its measurement in order to neglect the
effect o f the stylus geometry. Th e profiling m ethod provides reliable results within its limitations. It is a universal tool for most materials except very soft ones.
1.2.2
Optical profllometers
Optical profiling instruments have been developed to overcome the problem of con tact between the stylus and the surface, so th at damage to the surface and wear of the stylus tip can be avoided. Another advantage is faster measurement and therefore simultaneous inspection during manufacture.
In optical profiiometers the focal point o f a light beam is used to replace the stylus. A rough surface causes a change in the optical signal during the profiling procedure. Th e amount o f change can be obtained from the principles of the optical system. T h e geometry can thus be found.
There are many ways to find the optical change. One simple way is to detect the focus plane through the sensors Si & S2 b y a knife-edge (Thwaite, 1977) or a chopper blade (Jing et al, 1987), as shown in figure 1.4.
Th e dcfect-of-focus optical technique (Sawatari & Zipin 1979; Mignot & Górecki 1983) or optical Fourier transformation (Fainm an et al 1982) uses a comparison of
the differences of the intensities obtained by photodetectors P I k. P2 (referring to figure 1.5). Similarly, focus detection is also obtained by the total reflection using a critical-angle prism (K oh o et al 1985).
An alternative is to use the optical change to generate an electronic signal to control a servomechanism to reposition the optical system to the initial situation. The movement o f the objective is a measure o f the surface geometry (Dupuy, 1967- 68; Arecchi et al 1979). In this case, a high precision, stable servo-system is required. Downs et al (1985) have designed a common-path polarimetric interferometer
[image:29.433.39.360.9.438.2]1.2 Stylus profiling techniques
SI S2
[image:30.434.21.398.15.424.2]1.2 Stylus profiling techniques 9
1.2 Stylus profiling techniques 10
Most o f the optical profilometers have an equivalent or better resolution than stylus instruments. But there are some reasons why they still cannot replace me chanical profilometers. Firstly, the sensitivity of the optical methods depends on the size and the depth o f the focus, the magnification of the optical system, and the wavelength o f the light source, etc. Th eir measuring ranges are generally small and limited by the geom etry o f the systems. For example, the surface gradient has to be
within 15° for the system by Dupuy (1967-68). Secondly, optical systems, in gen eral, require m ore delicate working conditions. They are not suitable for use in the
workshop. T h e third limitation is that surfaces measured by optical profilometers normally require a good finish or, sometimes, a good reflection.
1.2.3
Scanning probe microscopes
Optical methods are principally for speed and non-contact. Their development accelerated with the lasers existing in the 70s and early 80s, and is now growing steadily. T h e application of lasers to engineering made the stylus methods less
important, and consequently their development lapsed somewhat.
The stylus profiling technique has its drawbacks. Its slowness and the destruction it causes to surfaces almost lead to its replacement by other techniques. However, it has become m ore important since the advent of alternative probes such as the scanning tunnelling microscope (S T M ) and the atomic force microscope (A F M ). The STM and the A F M use a sharp tip to react to a surface through the physical effects. A resolution as high as the nanometer or atomic level can be reached. The
tip does not physically contact the surface: rather it travels a very small distance above it. Non-contact and atomic resolution are characteristics o f the scanning probe microscopes, the new generation o f profiling technique. Th e possibility of measuring at the atomic level implies:
1.2 Stylus profiling techniques 11
• Improvement of manufacturing precision;
• Further knowledge o f friction and wear;
• Acquisition of detailed functional information of engineering surfaces;
• Shortening the gap between engineering and physical theories; etc.
The first S T M , built by Binnig & Rohrer (1985), was inspired by the topografiner
described by Young et al (1972). Both of them use tunnelling theory. The difference between them is that the tip is kept closer to the sample in the STM , and then the tunnelling current is used rather than the field-emission current in Young’s
system. T h is results in an atomic resolution (Binnig & Rohrer 1986). In the STM , the three dimensional variation o f the charge density at a surface is probed via electron tunneling between a sharp tip and the sample. The w ave nature of electrons means that they are not strictly confined to the interior bounded by the surface atoms. Therefore, the electron density does not drop to zero at the ‘surface’ , but exponentially on the outside with a short decay length o f some Angstroms. Th e two metals approach within a few A; the overlap o f their surrounding electron clouds is substantial, and a measurable current can be induced by applying a small voltage between them . This tunnel current, /, is dependent very strongly on the distance between the two metals, s, as
I oc exp(—A4>0s) (1.1)
where is the average of the work functions of the two metals. When this relation
1.3 The necessities and requirements for evaluating the profiling technique 12
1.3 T h e n ecessities an d r e q u ir e m e n ts for evalu at
in g th e p rofilin g tech n iq u e
The characteristics of profiling techniques can be generalized as follows:
• T h e two-dimensional representation o f a three dimensional surface from the point o f view o f information acquisition;
• T h e stylus tip, whether it is a diamond or an optical focus point, is used to interact with surfaces;
• M ost applications are o f geometrical measurement.
From these characteristics it can be seen that signal recording, storage and pro gramming o f the instruments are not significant in an investigation. Th e simi larities between the stylus instrument and the novel microscopes which both use tips/probes, emphasize the importance o f an investigation into the nature o f the profiling technique. The different mechanisms utilized for data acquisition from the
tips seem less important for the surface profiling methods. Moreover, with the de crease o f measuring scale down to the atomic level, the tip, especially its dimension, becomes more significant and important.
The scanning probe microscopes have been developed dramatically. Their variety will be briefly listed in chapter 2. Nevertheless, as an instrument, there are still many
requirements to be studied, for example, the mechanical and electronic designs, and the detailed reaction between the tip and the surface, etc. It is necessary to evaluate some aspects o f this instrument in order to further develop its potential. The tip is one o f the important factors. It plays both geometrical and physical roles in the scanning probe microscopes.
1.3 The necessities and requirements for evaluating the profiling technique 13
other and influence each other. However, the degree o f development o f surface mea surement techniques and the understanding o f surface functions have never 3eemed
to be in step. In fact, the stylus profiling technique itself is a contact between a stylus and a surface. In order to see the reliability of this tool, an important point to be considered is the relation between the true surface and the surface revealed by the stylus.
Th e stylus profiling method is a two-dimensional measurement, but the surfaces are three dimensional. This leads to an essential disadvantage. However, digital techniques enable surfaces to be measured in three dimensions by changing the sampling from a line to a plane. An improvement in sampling on a plane, particularly from the point of view o f surface functions, is needed.
The stylus has two effects on the surface: a physical effect and a geometrical effect. Th e geometrical effect from the stylus is normally considered from the point of view o f the lateral resolution. The finite dimension is unable to track the shape of the valleys on a surface which are smaller in size. However, it has not been noticed that the surface information obtained by the stylus is also biased by the shape of the stylus. In this work, the geometrical relationship between the profile, the trace
and the stylus will be analyzed. The influence o f the shape o f the stylus on the local information will be presented. For the stylus instrument the effect of the stylus loading force is not a new consideration. W hat is new in this work is that not only the static, but also the dynamic forces are used to test for the requirement for the control o f the stylus loading force.
In this work, the conventional stylus instrument was chosen as the object for the experiments and tests. As it has been pointed out before, the tip in the profiling technique is the most important factor, not the mechanism. Besides, the present
STM s or A F M s are still being developed. Th e stylus instrument (Talysurf 5) in the Centre for Microengineering and Metrology in the Department o f Engineering at
1.4 The layout of the thesis 14
1.4
T h e la y o u t o f th e thesis
The stylus profiling technique is interpreted and evaluated in terms of the mechan ical aspects of data collection. This subject falls into three areas: (i) 3D digital sampling techniques; ( i i ) finite dimension of stylus and ( i ii) forces contributing to measurement. The first aspect is from the point o f view o f methodology applicable
to the optimal recording o f any profiling technique. T h e latter two are the two critical elements inside the techniques. They perform the essential roles. Chapter 2 gives the basic background o f the subject on surfaces and their measurement. This is the area where the stylus profiling technique is intensively used. Digital techniques are the tool for three dimensional surface measurement using the stylus profiling technique. Digital data collection is considered in chapter 3 and it is shown that a novel plane sampling m odel - a hexagonal scheme - significantly improves the sur face 3D sampling technique. Chapter 4, 5 and 6 are concerned with the relationship between the geometry o f the stylus and data collection. T h at is, the effect o f stylus
finite dimension will be discussed in chapter 4. The formation o f a stylus trace from a given stylus dimension and a given surface is analyzed in chapter 5. This provides a method to correct the bias caused by the shape o f the stylus. As an application of these principles, a m ethod for the measurement o f the dimension of the stylus is presented and tested in chapter 6. The last part of the thesis discusses the physical aspect o f the stylus. Because of the instrument-dependence, a particular stylus in strument is selected for this analysis. Its characteristics are discussed first in chapter 7. Then, in chapter 8, the measurement o f the forces involved in the instrument are
Chapter 2
Background — Engineering
2.1 Engineering surfaces 16
2.1
E n g in e e r in g surfaces
2.1.1
W h at is an engineering surface?
A real surface is defined by its surface separating surrounding space (BS 1134:P A R T 1:1988). Engineering surfaces are the surfaces of engineering components. T h e y are both a mirror which reflects the manufacturing process, and a window through which the performance of components or parts may be viewed. The important characteristics of engineering surfaces are their geometric features and their physical properties, e.g. thermal, electrical and optical behaviour. Normally, an engineering surface refers to those irregularities, with regular or irregular spacing, that tend to form a pattern or texture on the surface, namely ‘surface texture’ .
It should be clear that the reason for defining an engineering surface is to study
the performance o f engineering components or machine parts. Initially, researchers concentrated their efforts investigating surface texture. Now, developments in sci
ence and technology show that the structure beneath the surface also plays an important role. For instance, when an X-ray beam illuminates a surface, it will penetrate to a depth o f about 10 - 10,000 nm. Even waves with optical frequencies
will penetrate about 5 nm in metals. The structure beneath the surface generally determines the surface’s optical properties. Thus, the definition of an engineering surface needs to be broadened to include its function: an engineering surface is the boundary o f an engineering part, including the surface geometry and th e layers beneath.
2.1.2 The structure of a surface
An in depth examination o f a metallic surface is illustrated schematically in fig ure 2.1. The outermost surface is often covered by several layers, for exam ple, an oxide layer, arising from the interaction of a surface material with its environment.
2.1 Engineering surfaces 17
top two crystalline layers are created by the manufacturing processes. Th e ‘ Beilby layer’ is thought to be a thin, amorphous layer immediately below the oxide layer. It is the result o f certain machining/polishing processes. Finally, the surface is usually covered with dust, wear debris and possibly lubricants. Such particles may be of similar size to the intrinsic roughness of the surface boundary.
Dust particle
Figure 2.1: A schematic showing the structure o f a metallic surface.
The crystallographic structure o f the surface layers effects the mechanical prop erties. Some materials have different strengths in different directions due to the crystalline structure o f the materials.
2.1.3
Surface topography
2.1 Engineering surfaces 18
scale. In general the surface geometry is described by three parameters: roughness, waviness and error of form. Roughness (micro-roughness) is formed by the fluctu
ations in a surface. It is characterized by hills and valleys o f different amplitudes and spacings. Waviness (macro-roughness) is the variation o f the surface over large spacings. It is often caused by surface vibrations during machining, or sometimes by errors in the machine tool itself. Finally, error o f form is caused by weight ef
fects, thermal effects and so on. These three parameters characterize a solid surface as shown in figure 2.2. Some examples o f engineering surfaces are illustrated in
Figure 2.2: The characteristic components of a technical surface.
figure 2.3
A second feature is the machine mark or pattern. Some manufacturing processes such as turning or grinding produce surfaces which have a directional characteristic. This characteristic is known as the May’ o f the surface. Th e assessment o f a surface and the numerical values obtained are directly related to the lay. For example, if
measurements are taken across the lay then the numerical values are likely to be significantly larger than measurements taken with the lay. Surfaces which have a directional lay are called ‘ anisotropic’ , those that do not are called ‘ isotropic’ .
2.1 Engineering surfaces 19
grinding
■ L
.« A
« A
,« A
A A
HA
,*,»
•/.
.' v i ;•/ i I i : \ ; * • / *•
v v v vy v V/ v/ V '•>
W^AAAA
a
AA/0,
vertical
milling
horizontal
milling
2.2 Surface properties and their function 20
o f manufacturing operations such as air barbotage in casting. In general the size or depth of a flaw is larger than the surface texture.
Both lay and flaws are mainly characteristics o f size or space within the surface planes, although the depth or height is also important. However, if the stylus type o f instrument is used, full spatial information cannot be obtained because only one axis along the surface plane is scanned. A t present, there is no existing parameter that can describe the spatial features in a simple way such as a single value. This
is still a major problem in surface metrology.
2.2
S u rface p rop erties a n d th eir fu n ction
The surface is a link between the manufacture o f an engineering component and its performance (Whitehouse 1978). It provides a way to control the machining
process, to diagnose the machine tool conditions, and to predict how well the part functions. In manufacturing processes, the surfaces of components can be regarded as ‘fingerprints’ o f the whole machined condition. The shapes of surfaces are the cumulative results of cutting tool conditions like tool wear, machine vibrations and system errors. Any deviation in manufacture reflects itself in surface texture. So, surface measurement as an effective ‘go-gauge’ can control the manufacturing pro cesses. This was an early use of surface measurement.
The surfaces of engineering components are formed before being fixed into ma chines. In conventional engineering, when a machine is operating, its parts are influenced very much by their own surfaces, and the surfaces themselves change. Interaction between surfaces, for example friction, causes the temperature to rise, and consequently leads to changes in shape and, as a result, the accuracy of the ma
chine may deteriorate. Moreover, the life o f a machine is influenced by the failure of components due to wear. Although lubrication can take heat away and form a film
2.2 Surface properties and their function 21
by surface irregularities, so the performance of the film is related to the surface. Therefore, the functional performance o f a surface must be predicted from surface measurement.
As mentioned before, light penetrates into metals, e.g. 15 nm for gold (Hum mel, 1985). As a consequence, optical properties are basically measured near the surface which is susceptible to oxidation, deformation (polishing), or contamination by absorbed layers. Conversely, subsurface structures effect the optical properties and then the results of optical methods o f surface measurement.
2.2.1
The mechanical properties of a surface
The mechanical properties o f a surface refers to its performance under the contacting conditions, such as its strength to resist wear and load carrying capacity, etc. The science o f contact is called ‘Tribology’ . It includes friction, wear and lubrication of interfaces.
The basic law of friction goes back to Lenardo da Vinci, and was later rediscov ered by Amontons in 1699. It states that friction is proportional to the load, and is independent of the area o f the sliding surfaces. The work done by Bowden & Tabor and their collaborators in the 30’s and 40’s of this century has advanced the subject greatly. The basic concepts will be briefly outlined in this section. Recent
developments will also be summarized.
2.2 Surface properties and their function 22
W
Figure 2.4: Diagram showing areas of real contact between two rough surfaces.
Contact pressure is very high, due to tip contact under an applied load. This will lead, initially, to elastic deformation and then to plastic deformation as the load increases. It is not surprising to find that the junctions formed in ordinary adhesion are as strong as the yield strengths o f the materials. The adhesion process leads to friction. It stands to reason that sliding one surface over the other involves shearing o f the junctions formed by adhesion. The shearing force F is equal to the shear strength per unit area, Sc (the critical shearing stress), times the area of the junctions A , i.e.
Th e area is given by the applied load W divided by the plastic flow pressure p, or
F = Se • A. ( 2 . 1)
W = p A. (2.2)
So that the coefficient of friction p is given by
(2.3)
2 . 2 Surface properties and their function 23
only be compressed by about 10%. A t loads greater than this value the underlying bulk material reaches the yield stress and deforms plastically (Hailing 1976). In ad dition, as the load increases, the higher asperities deform plastically. New asperities which have lower height, come into contact, and start to deform elastically. In actual contact under an applied load, surface asperities are deformed both plastically and elastically. The ratio o f plastic deformation to elastic deformation changes with the increasing load and the height of the asperities.
Recently, knowledge of friction has improved markedly. A t low loads, Bowden & Tabor theory is valid. The molecular contact area is dependent upon the nor mal load, by J K R (Johnston-Kendall-Roberts) theory for adhesive contact and by Hertz theory for non-adhesive contacts. A t high loads, Amonton’s law o f friction contributes to the Bowden & Tabor theory. In summary, the frictional force F is given as (H om olaet al 1990)
F = C , w i + C , W + C ,W * . (2.4)
The first term is under strong adhesive conditions, in which the friction is propor tional to the cube root of the normal load squared. Th e second term is the ‘ normal’ friction described by Amonton’s law, where C2 = p. Th e last term always has a small value, according to Homola et al (1990). It is influenced by the relative
magnitude of surface energy, surface asperities radii, elastic modulus and external load.
As seen in the surface structure represented in section 2.1.2, most surfaces are covered by a variety o f layers. The mechanical properties o f these layers are, in general, different from their bulk structures. Therefore, the layers play a critical part in a contact situation. The third-body or interface approach is useful as this model presents all o f Tribology, from thick film lubrication to dry friction. Goget (1990) has surveyed this topic and described its theories.
2 . 2 Surface properties and their function 24
and strain (deform ation characteristics) that occur in the surface and in its ability to sustain such stresses without failure. This information can be determined if we know the elastic constants of the material, its yield strength (which defines the stress at which elastic behaviour changes to plastic deformation), and the hardness of the surface material which is closely related to its yield strength.
When two contacting surfaces undergo a sliding motion, the shear strength of the materials determines performance under static and dynamic situations. The static situation occurs when two asperities are initially in contact. This then gives way to a tangential force. The dynamic situation may be more complex. Tw o surfaces may shear w ith a relative velocity in a variety o f directions. Tw o asperities which are not in contact at the beginning, may touch each other with a certain velocity, and then shear occurs.
2.2.2 T h e physical properties of a surface
This is normally referred to as the physical properties o f the materials. Th e optical, electrical, m agnetic and thermal properties o f materials can be explained by the electron theory o f solids. Hummel (1985) gives detailed information o f material properties. O n ly a brief summary is given in this section.
Therm al p ro p erties
2 . 2 Surface properties and their function 25
O ptical properties
When optical techniques are used, a critical role in surface measurement is played by the optical properties of the surface. In particular, m etals have very complicated
optical properties. Reflection, absorption, and polarization o f light by the surfaces must all be considered together. The atomic theory o f optical properties contains two parts: free electron theory and dielectric materials theory. At low frequency, electrons in metals behave as free electrons. But, at high frequencies, they become bound electrons, like the ones in insulators. In the latter case, the behaviour o f the electrons can be explained by harmonic oscillation. Therefore, the optical proper ties o f metals may be described by postulating a certain number of free electrons, and a certain number of harmonic oscillations. Both the electrons and oscillations contribute to the polarization.
In modern technology, a knowledge of the optical properties of materials is needed in a great number of utilizations and applications. Reflectrom etry and spectrome
try analyze the composition of metal alloys and the electronic structure o f metals. In electrochemical corrosion, optical studies provide a sim ple, nondestructive tool which can be used to investigate environmentally induced changes in surfaces, e.g. oxide formation.
Semiconductor studies have greatly advanced modern science and technology. A perfect crystal o f a semiconductor would become indistinguishable from an insula tor at absolute zero, but at finite temperatures electrons m ay be excited thermally across the relatively narrow forbidden energy ‘gap’ . O ptical absorption measure ments provide the most accurate way to determine the gap energy and the energy o f localized states.
2.2 Surface properties and their function 26
future potential need not be mentioned here.
Electrical properties
The electrical properties of materials are partially described by their resistivity, p.
The resistivity is influenced by a thermal effect, and by imperfections and defects o f the material’s structure. As the temperature decreases, the thermal resistivity approaches zero. A t very low temperatures, near to absolute zero, superconductiv
ity, i.e. p = 0, occurs in some materials. Superconductive materials have many potential uses, for example, high magnetic field solenoids with no power dissipation, frictionless bearings and transmission o f power at 100% efficiency, etc. Supercon ductivity can be destroyed by high temperatures, high magnetic fields, high current densities and ferromagnetic impurities.
Th e electrical properties o f surfaces have also been used extensively to study
surface functional performance such as contact area under a known load (Holm 1946, Bowden & Tabor 1939). If the surface is free o f contamination, the electrical resistance depends only upon the electrical conductivity o f the materials (metals), and upon the size of the regions o f contact. Th e resistance is the result o f the constriction o f the current into the region o f contact.
Not only metals but also polymers, ceramics and amorphous materials can be conductive. Polymers have been created that are not only insulators but semicon ductors and superconductors as well. However, there are still some problems at present. For example, they are unstable in air at temperatures much higher than room temperature. A diagram o f the conductivity o f polymers is shown in figure 2.5.
2.2.3 The chemical properties o f a surface
compo-2.2 S u r f a c e properties and their function 27
conductor*
o ( A )
to*- to4- 10* ■
<SM>, (cm), a*p s
t»4- iS*-1* -l -l «
Cl* (CM),
10 - T *flon P ol»*»«*'
2 . 2 Surface properties and their function 28
nents o f the atmosphere, especially oxygen, will react w ith surface materials. In the structure of a metal, illustrated in figure 2.1, the outermost layer is sometimes an oxide film. The reaction of a bare metal surface with oxygen is extremely rapid. A t very low temperatures, it is proportional to the logarithm of the exposure time. W hen this occurs an oxide film is formed covering the bulk material. Studies have
shown that the oxide film is much more thermodynamically stable than the bulk material. The conductivity of oxides is similar to that o f semiconductors, with a range o f 10-9 (B eO ) to 102 (FeO) n - , m_ l . The formation of the oxide depends upon pressure, temperature, supersatuation (no free valencies) and oxide orienta tion. The structures o f the oxides are complicated. Th eir properties vary through the thickness of the layer. For instance, the amount o f oxygen in the layer is higher towards the side of oxygen orientation and less towards the metal side. Th e lattice structure and the chemical constitution are different as well, for example, the oxides o f copper are CujO and CuO. Also, many structural defects occur in oxides. Studies o f oxidation have shown that there is either compressive or tensile stress in oxides. This may lead to fractures or breakaway oxidation depending upon the volume ratio o f oxide/metal.
T h e atmosphere or environment may cause corrosion in other ways. These relate to the degree of humidity and the content. Normally the moisture layer (mainly water) is no thicker than two molecules, even when the degree of humidity is about 90%. The more polluted the atmosphere is, the more aggressive the formation o f a condensed film. The reaction of a metal surface with a salt deposit, often a sulphate, is referred to as ‘ hot corrosion’ . The effects o f this type o f corrosion is catastrophic. Studies of oxidation and corrosion are beyond the scope o f this thesis. More detailed information can be found in the book by Evans (1976).
2.2 Surface properties and their function 29
small quantity o f certain organic compounds, not themselves lubricants, is some times added to the mineral oils. T h e y normally consist o f long chain molecules with
polar end-groups. The polar end groups attach themselves to the surface o f the metal, while lateral attraction between the molecules holds the lubricant together. So, surface films which are strongly attached to the metal surfaces are formed. This type o f lubrication is able to resist penetration by surface asperities, and provides low shear strength and low friction.
2.2.4 Surface functions in engineering
Surface texture is important in engineering applications. It has been noticed that components used for a particular purpose may require a specific surface texture to improve their functions. For instance, the inner surface o f a cylinder in a mo tor engine needs a good surface finish to reduce the effects o f friction and wear caused by the piston. However, in order to have well lubricated contact between the cylinder surface and the piston, relatively deep valley scratches are needed on the surface texture o f the cylinder so that the lubricant can be kept on the surface. In addition, a good surface finish can reduce noise effectively in bearing systems. Examples o f applications requiring the control of the surface texture can be found in an engineering handbook. They are summed up below (Farago 1982).
• Resistance to wear;
• Fit clearance or interference;
• Preservation of an uninterrupted lubricant film;
• Load carrying capacity;
• Resistance to chipping;
2.3 Numerical descriptions o f surfaces 30
• Low coefficient o f sliding friction;
• Smooth rolling contact;
• Reduced vibration and noise;
• Avoidance o f abrasive effects;
• Prolonged service life through increased fatigue strength;
• Assurance o f structural strength;
• Dependable dimensional measurement;
• Smooth fluid flow;
• Base for developing ultra thin film;
• Non-functional (aesthetic) considerations.
2.3 N u m e r ic a l d e s crip tio n s o f surfaces
The object o f measurement is to obtain assurance in order to control processes
qualitatively. The relationship between measurands and measuring instrument is illustrated in figure 2.6. Metrology is the study o f measurement. It includes cal ibration, traceability and standards. Surface metrology, the science of measuring
engineering surfaces, is concerned both with the detection o f errors and deficiencies in production processes, and with linking production criteria to component perfor mance etc. (Scott 1986).
2.3 Numerical descriptions of surfaces 31
M E ASU R AN D
1
“
True value
i
Conventional true value
t f
Standard
*
Traceability
*
Calibration
__ i___
INS TRU M ENT
Measurement
Resolution Repeatability Reproducibility etc.
j
Systematic Random
Accuracy Precision
X
/
Uncertainty
2.3 Numerical descriptions o f surfaces 32
2.3.1
Statistical aspects o f surface parameters
Surface profiles often reveal both a periodic and a random component in their geo metrical variation. The size of the periodic or random component, depends on the machining processes. For example, surfaces produced by turning/diamond turning have a strong periodicity depending upon the tool shape and feeding speed of the tool. Whereas in grinding and electro-discharge machining (E D M ), random surfaces are manufactured. Statistical analysis provides a macroview o f surface texture. Sim ple surface statistical parameters are used to ease industrial evaluation o f surface finishes (See BS 1134: P A R T 1: 1988). In this section, some statistics other than those in BS 1134: P A R T 1: 1988 will be listed.
The height distribution o f surface textures
The distribution function of the height describes the surface texture in terms o f its profile. It is given as
where y refers to the heights measured from the centre-line and x/>(y) is the proba bility density function of the distribution of these heights.
Skewness and kurtosis
Skewness is a measure of the departure o f a distribution curve from symmetry. It is defined as
It is the third central moment o f 0 (y ) divided by its standard deviation cubed (<r3), and is a guide to the symmetry or otherwise o f rl>(y).
The kurtosis is a measure o f the hump on a distribution curve. This is defined as
(2.5)
(2.6)
2.3 Numerical descriptions o f surfaces 33
Figure 2.7: The height distribution of surface textures.
It is the fourth central moment o f 0 (y ) by a*. Figure 2.8 shows representations of
them.
2.3 Numerical descriptions o f surfaces 34
T h e autocorrelation function o f a surface p rofile ( A C F )
This is the result o f dividing the autocovariance function R (t) by <r2, as follows
where L is the total sampling length o f a profile. T his function is dependent on the sampling interval. It can be seen that
where Rq is the rms roughness parameter (BS 1134: P A R T 1: 1988). This relation means that the square of the rms roughness parameter equals the A C F with zero
the surface profile. In three dimensions, the definitions may well change. Some are defined in chapter 3. They are listed because o f their present utilization in surface texture analysis.
T h e power spectral of density function ( P S D )
The Fourier transform o f R(t) is called the power spectral density, i.e.
(2.8)
(2.9)
R (0 ) = R ], (2.10)
shift.
It should be noticed that the definitions of all the above functions are based on
(2.11)
The inverse Fourier relation holds, that is