1.3 Derivation of LVL mean strength... 1-6
1.4 Interlayer plywood and reinforcement... 1-8
2. Concrete material testing ... 2-1
2.1 Cylinder compression test... 2-1
2.2 Slump test... 2-2
2.3 Prisms for drying shrinkage test ... 2-4
3. Construction of push-out specimens ... 3-1
3.1 General... 3-1
3.2 Formwork making for the slab... 3-4
3.3 Cutting of LVL and notches ... 3-5
3.4 Insertion of coach screws... 3-6
3.5 Pressing of toothed metal plates ... 3-6
3.6 Assembly of slab formwork to LVL... 3-7
3.7 Concreting of the specimens ... 3-8
4. Notched connection strength evaluation analytical model ... 4-1
4.1 Analytical model to New Zealand Standard ... 4-1
4.2 Analytical model to Eurocode ... 4-4
5. Short-term connection push-out test ... 5-1
5.1 Connection push-out test setup ... 5-1
5.2 Computation of push-out test results ... 5-5
5.3 Phase 1 connection push-out test ... 5-7
5.4 Phase 2 connection push-out test ... 5-10
6. Construction of beams for short-term collapse test ... 6-1
6.1 Construction of beams indoor... 6-1
6.2 Construction of beams outdoor... 6-6
7. Short-term beam collapse test... 7-1
7.1 Experimental setting up ... 7-1
7.3 Load-deflection graphs of tested beams ... 7-6
7.4 Connection slips measured for selected beams... 7-10
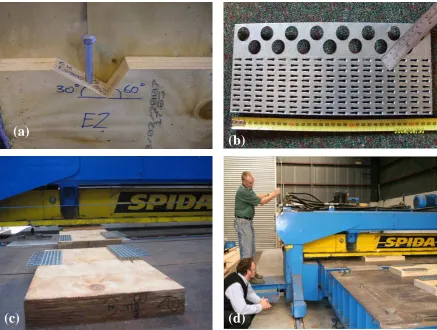
8. Design, construction and setup of long-term push-out Test frames ... 8-1
8.1 General... 8-1
8.2 Design of long-term frames ... 8-2
8.3 Construction of frames... 8-3
8.4 Assembly of frames ... 8-5
8.5 Instrumentation for connection push-out test ... 8-12
9. Construction and setup of long-term beam test ... 9-1
9.1 Construction and setup of long-term test beams – photographs ... 9-1
9.2 Instrumentation for beam test ... 9-4
10. Design span tables... 10-1
10.1 Module M 2.4 m Connection R-300 ... 10-3
10.2 Module M 2.4 m Connection T... 10-5
1.1 Concrete
Table A1-1 presents a summary of concrete used in the different experimental phases and
its source.
Table A1-1. Type of concrete used in the different experimental phases and its source
Phase Test Concrete Source
1 Short-term push-out NWC, LSC Laboratory
2 Short-term push-out CLSC Firth Concrete
3 Long-term push-out CLSC Firth Concrete
4 Short-term beam NWC, CLSC
SLSC
Firth Concrete Laboratory
5 Long-term beam CLSC Firth Concrete
Note: NWC for Normal Weight Concrete, LSC for Low Shrinkage Concrete, CLSC for Commercial Low Shrinkage Concrete, and SLSC for Special Low Shrinkage Concrete
Two types of 30 MPa concrete were used in Phase 1 short-term push-out test: low
shrinkage concrete (LSC) for specimen G1 and normal weight concrete for all the other
specimens. The concrete was prepared in the laboratory using mix design given in Table
A1-2:
In the Phases 2, 3, 4, and 5, a commercially available low shrinkage concrete (CLSC)
from Firth Concrete was used. The properties of this concrete are: 35 MPa, 650
microstrain, low shrinkage concrete with Eclipse admixture, 13 mm aggregate, and 120
Table A1-2. Mix design of concrete for the first phase of push-out test given in amount per cubic meter
30 MPa Normal Concrete (w/c = 0.60)
GP cement 267 kg
Water 160 kg
13mm Greywacke stone 1000 kg
Christchurch Greywacke sand 900 kg
Water reducer 1 L
30 MPa Low Shrinkage Concrete
GP cement 267 kg
Water 150 kg
19 mm limestone 1000 kg
Whangarei sand 900 kg
Super-plasticizer 1.5 L
Shrinkage reducing admixture 10 L
Table A1-3. Mix design of special low shrinkage concrete (SLSC) used in Phase 4 given in amount per cubic meter
Cement 200 kg
Water 160 L
19 mm limestone 950 kg
PAP7 crusher sand 550 kg
Natural sand 450 kg
Fly ash 100 kg
Super-plasticizer 2.5 L
Shrinkage reducing admixture 10 L
A special low shrinkage concrete (SLSC) was batched in the laboratory to mix design in
Table A1-3 for one beam in Phase 4. The targeted compressive strength at 28 days was 35
MPa, and the expected drying shrinkage was 500 microstrain. Chemical admixtures used
were Sika Viscocrete 5/500 (S/P) and Sika Control 40 (SRA). The fly ash was Gladstone
fly ash from Australia and the cement was GP cement from Holcim Westport. Limestone
CLSC (Phases 2 and 3)
2373 45.0 30.6
Table A1-5. Phase 4 (short-term beam tests) concrete tested properties
Beam Concrete Compressive strength (MPa) Slump
28 day Test day (mm)
A1, A2, B1, C2 CLSC G35 49.6 58.0 150
C1, D1, D2 CLSC G35 42.6 54.4 170
E1, G1 CLSC G35 41.5 48.2 190
F1, F2 CLSC G35 43.4 54.4 220
E2 NWC G25 25.4 31.0 200
B2 SLSC G35 28.0 38.8 100
Table A1-6. Phase 5 (long-term beam tests) concrete tested properties
Beam Concrete Compressive strength at 28 day (MPa)
H NWC G35 39.1
I and J CLSC G35 38.1
Table A1-4 gives a summary of properties tested for concrete used in Phases 1, 2 and 3
short- and long-term push-out tests. Table A1-5 presents a summary of properties tested
for concrete used in Phase 4 short-term beam tests and Table A1-6 presents a summary
for Phase 5 long-term beam tests. The elastic modulus of the concrete was calculated
using Eq. A1-1 from Clause 5.2.3 from NZS 3101: Part 1 (SNZ, 2006) where the varying
densities of the different concrete mixes were taken into account.
5 . 1 c c 2300 ) 6900 ' f 3320 ( E ⎟ ⎠ ⎞ ⎜ ⎝ ⎛ +
=
ρ
Eq. A1-1The average density of CLSC was 2405 kg/m3 and the calculated elastic modulus was
0 100 200 300 400 500 600 700 800
0 10 20 30 40 50 60
Days S h ri n k ag e ( x 10 -6 )
NWC SLSC CLSC
0 100 200 300 400 500 600 700 800
0 10 20 30 40 50 60
Days S h ri nkage ( x 10 -6 )
175 mm 130 mm
Fig. A1-1. Average shrinkage (in microstrain) vs. days for (a) Different concrete at 100 mm slump, and (b) Similar concrete but different slump
The drying shrinkage of different concrete (NWC, CLSC and SLSC) at 100 mm slump is
summarized in Fig. A1-1(a). At 28 day, the drying shrinkage (in microstrain) of NWC,
SLSC and CLSC were 546, 476, and 294, respectively. NWC shrank 1.8 times larger than
CLSC and 1.15 times larger than SLSC. Fig. A1-1(b) shows the influence of slump on
(a)
Grade D
Thickness veneer 3 mm
Joints 3 outer plies are scarf jointed, inner plies are butt/scarf jointed
Adhesive Phenolic
Density 580 kg/m3 approximately
Section 400d× 63w mm
Elastic Moduli (MPa)
Modulus of elasticity E 10,700
Modulus of rigidity G 660
Characteristic Strengths (MPa)
Bending fb 48
Tension parallel to grain ft 33
Compression parallel to grain fc 45
Shear in beams fs 5.3
Compression perpendicular to grain fp 12
Shear at joint details fsi 5.3
1.2 Laminated veneer lumber (LVL)
Laminated veneer lumber (LVL) made from Truform recipe was supplied by Carter Holt
Harvey Ltd (CHH) in 400d× 63w mm sections where d and w are the depth and width,
respectively. LVL is an engineered material made by laminating 3 to 3.5 mm thick
veneers together in the parallel orientation to minimise the influence of defects such as
knots on the strength of the member. The process eliminates any concentration or local
effect of defects and thus result in a reliable and structurally stable material compared to
solid or glued laminated timber. The general specifications and characteristic properties
1.3 Derivation of LVL mean strength
The LVL joist is subjected to a combination of bending and tension. Timber has different
strength and distribution in bending and tension.
The distribution of bending strength, fb, and MOE (Apparent Modulus of Elasticity,
which includes also allowance for shear deformation) were obtained from Carter Holt
Harvey (CHH) factory production test in Auckland, where all the tests were on 95d× 63w
mm LVL cross-sections taken from entire billets. Since the actual size of LVL used in the
composite beam specimens was 400d× 63w mm, the factory data were corrected for size
effect. This was done using a strength reduction factor derived by CHH for use in the
USA, given by:
( )
12( )
121538 . 0 b b f D D f ⎟ ⎠ ⎞ ⎜ ⎝ ⎛
= Eq. A1-2
where D, is beam depth measured in inches. Using the above equation, a value of a
strength reduction function of 0.80 was obtained from the 95d × 63w mm specimens to
the 400d × 63w mm specimens. Therefore, the factory data, mean fb = 58.43 MPa was
modified for this reduction to fb = 46.84 MPa.
The distribution of the tensile strength was obtained from CHH factory production test in
USA. In this case, the strength value depends upon the length of the specimen tested, and
reduces as the length increases. A relationship has been proposed to account for this
effect: the tensile strength is multiplied by a strength reduction factor for length, given by:
( )
8( )
8111 . 0 t t f L L f ⎟ ⎠ ⎞ ⎜ ⎝ ⎛
= Eq. A1-3
where L, is beam length measured in inches. Since no specimen among those tested was 8
m long, using the equation above, a relationship was derived between the values for
specimen 3048 mm long and the ft(8 m and 10 m). The values ft(8 m) = 33.38 MPa and
The inequalities were manipulated so as to express it in terms of the maximum stress in
the bottom fibre of the LVL beam, σmax:
(
)
tb t b t b t t b f f f N M f σ σ σ σ σ σ σ + + = ≤ + = 1 / max Eq. A1-5
Table A1-8. Stress and strength ratios of TCC beams in Phase 4 short-term beam tests
Beam σt/σb f(M/N) in MPa
A 0.773 39.8
B 0.828 39.6
C 0.871 39.4
D 0.888 39.4
E 0.906 38.9
F 0.885 39.4
G 0.823 39.6
The tensile and bending stress ratio, σt/σb, depends on the bending moment and axial
force strength ratio, f(M/N), in the LVL joist, which is affected by the stiffness ratios
between concrete and timber, and by the stiffness of the connection system. The
gamma-method was used to investigate the stress distribution in the TCC beam, a first
approximation of the stress ratio was calculated for each beam. The σt/σb values are
reported in Table A1-8 together with the resulting strength f(M/N), which represents the
value of the tensile stress in the bottom fibre of the LVL joist leading to failure for
It was noted that the tensile stress do not significantly change for the different specimens.
Therefore, an average value of f(M/N) = 39.4 MPa was assumed for all beam specimens.
Hence, the mean combined bending and tension strength, fmean = 39.4 MPa was assumed
for the LVL tested as part of the composite beam.
The LVL design strength for bending, fb,d = 43.2 MPa and for tensile, ft,d = 27 MPa was
calculated by multiplying the characteristic properties in Table A1-7 by the strength
reduction factor, φ = 0.9:
k b d
b f
f , =φ , Eq. A1-6
k , t d , t f
f =φ Eq. A1-7
The maximum design strength in the LVL subjected to tension and bending, fd = 33.85
MPa was calculated using the following formula where σt/σb values taken from Table
A1-8: d t b t d b d t b t d f f f f , , , 1 σ σ σ σ + + = Eq. A1-8
1.4 Interlayer plywood and reinforcement
17 mm thick plywood (Grade F8 Ecoply) was used as a permanent formwork for the
specimens. The choice of the plywood thickness corresponds with the formwork strength
requirement of timber-concrete composite beams which were built for other phases of the
research. High tensile 10 mm diameter deformed steel reinforcement spaced at 200 mm
strength using cylinders; (2) Workability using slump test; and (3) Drying shrinkage using
prisms.
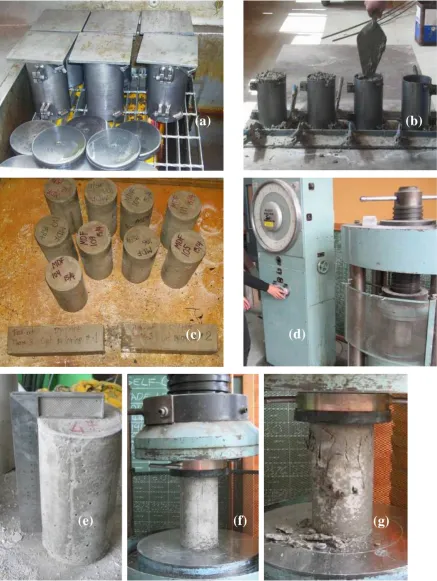
2.1 Cylinder compression test
The number of 100 × 200 mm cylinders made was as such that there were a minimum of
3 cylinders per compression test at 7 days, 28 days and at the day the push-out specimen
was tested. Cylinder compression tests were performed according to New Zealand
Standard NZS 3112: Part 2 (SNZ, 1986a). The aim of this test is to determine the strength
of concrete. The apparatus required and procedures are as follows:
1. Cylinder moulds made of metal castings capable of being opened longitudinally to
facilitate removal of the specimen without damaging them and fitted with efficient
closing devices that will ensure accurate alignment and tight closure of the joints
in service. The moulds come with machined metal base and top plates that can be
screwed tightly. A few hours before the moulds are used, they were dipped into a
tank of lubricant oil and subsequently oil was allowed to drain off leaving a thin
layer of lubricant to ensure easy removal of the cylinders (Fig. A2-1(a));
2. A tamping rod measuring approximately 16 mm in diameter and 600 mm in
length, with one end rounded to a hemispherical tip. The cylinders were filled up
in 3 layers with each layer compacted 25 times to its depth using the tamping rod.
The concrete was even out in the final layer and tightly closed with the top plate.
Concrete stains on the external cylinder were washed off immediately and the
moulds were laid on their sides in a horizontal position for 24 hours with the
longitudinal lid facing upward;
3. Alternatively, a vibrating table can be used for the purpose of compaction. In this
method the concrete was poured only in 2 layers and each layer vibrated until
bubbles appeared on the surface of the concrete. This normally takes just a few
4. The cylinders moulds were removed after 24 hours (Fig. A2-1(c)) and the
cylinders were placed in a fog room where they were kept moist for curing.
At the day of testing of the cylinders, they were taken out of the fog room. The top
surface of the cylinder and sides were polished using a pumice stone in order to obtain an
even surface checked with a square rule (Fig. A2-1(d)). The cylinder was positioned
centrally on the lower platen of a Universal Testing Machine with a steel cap on top of
the cylinder to avoid concentration of load (Fig. A2-1(e) to (g)). Each cylinder was tested
to failure at a 23 kN/min constant loading rate and the maximum failure load recorded.
The compressive strength of the cylinders in MPa was calculated by multiplying the
maximum load expressed in kN with a factor of 0.1275.
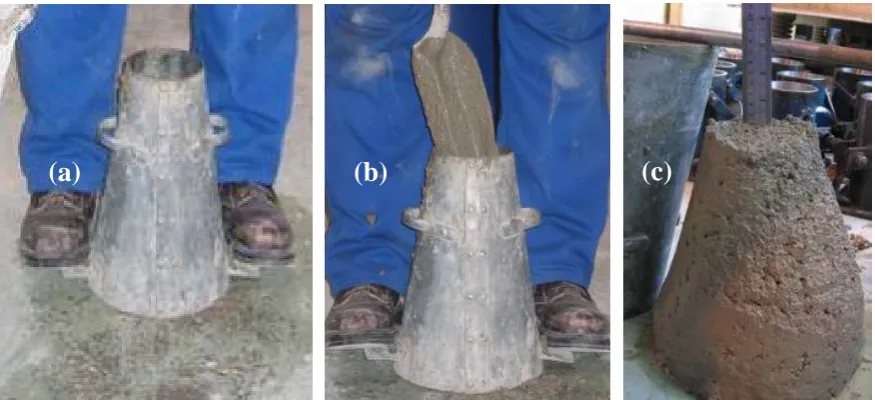
2.2 Slump test
A slump test was first carried out to check the workability of the concrete before starting
the concrete pour. The slump test provides a rapid method for determining the relative
consistencies of successive batches of mixed concrete. The required specified slump was
120 mm being a slump measure commonly used for the construction of floors in New
Zealand which is the final purpose of the tested connection specimens. Concrete failing to
meet the acceptable range were declined. The apparatus required for the slump test
comprises of: (1) a slump cone made of metal, with an opened base and top fitted with
lifting handles and foot pieces on the sides; (2) a circular tamping rod made of steel,
Fig. A2-1. (a) Draining off oil from cylinder moulds; (b) Casting of cylinders and vibration table; (c) Cylinders and prisms kept in fog room; (d) Universal testing machine for cylinder test; (e) Preparation of cylinder before test; (f) Positioning cylinder at centre of lower platen; and (g) Cylinder after test.
(a) (b)
(c)
(d)
(g)
(f)
[image:13.595.91.529.92.674.2]The slump test was performed in accordance to the procedure described in the New
Zealand Standard NZS 3112: Part 1 (SNZ, 1986b). The inner surface of the slump cone
was first wet with a piece of damped cloth and placed on a flat, moist, non-absorbent,
rigid surface which was level and free from vibration (Fig. A2-2(a)). The concrete was
carefully poured in 3 separate layers into the slump cone which was hold down firmly
with the feet (Fig. A2-2(b)). Each layer of concrete was compacted uniformly covering
the whole surface and only on each respective layer with 25 blows using the tamping rod.
After compacting the third layer, the cone is topped up with additional concrete and then
flattened off gently with a trowel. Holding the cone down firmly, the surface around the
cone was cleaned. The cone was steadily and vertically lifted upward in 3 counts with no
lateral or torsional motion. Immediately after the removal of the cone, the slump was
measured by determining the difference between the height of the cone and that of the
highest point of the slumped concrete (Fig. A2-2(c)).
Fig. A2-2. (a) Moist surface preparation; (b) Cone held firmly by legs as concrete was inserted into the cone; and (c) Measure of slump.
2.3 Prisms for drying shrinkage test
Concrete dry shrinkage test was performed on concrete prisms moulded and kept under
specific conditions as described the New Zealand Standards NZS3112: Part 3 (SNZ,
1986c). It provides a method for determining the length changes of the specimens due to
drying air. The apparatus used were:
[image:14.595.91.529.360.560.2]position against the end plate by a retaining screw and shall be capable of release
after compaction of the concrete;
2. Vibrating table used to compact the concrete in the moulds;
3. Conditioning chamber to store the specimens at controlled temperature of 23±2°C
and a relative humidity of 50±5°C at all times;
4. A length comparator capable of measuring the change of length in the specimens
with a precision of 0.001 mm.
Fig. A2-3. (a) Prisms in the mould; (b) Comparator to measure the prisms change in length.
For each concrete casting, at least 2 prisms were poured together with the cylinders for
the purpose of this test (Fig. A2-3(a)). The prisms were removed from their mould after
24 hours leaving the gauge studs which were cast into the ends of each prism.
Immediately after, the prisms were stored in the fog room to cure for the period of 7 days
before they were taken out, surface wiped dry and quickly stored in a conditioning
chamber. Prior to placement in the conditioning chamber, each prism was positioned in
the comparator (Fig. A2-3(b)) so that its axis was aligned with the measuring anvil so as
to measure the initial length. In order to obtain a correct measure of length, the prism was
adjusted 2-3 times with a slight horizontal push until the reading maintains and hence
recorded to 0.001 mm of accuracy. This process was repeated each time a reading was
taken.
The prisms in the conditioning chamber were positioned so that there was a clearance of
at least 50 mm on all sides allowing clear aeration of the prisms. Length measurements
were taken for each prism at 0, 7, 14, 21, 28, 56, 90 and 120 days. The temperature and
the relative humidity of the chamber were also recorded. On the basis of these data the
drying shrinkage could be calculated:
1. For each reading taken, the change in length was tabulated as the measured length
measurement subtracted from the initial length measurement at day 0;
2. The change in length tabulated in (1) was divided by the effective gauge length,
taken as 250 mm;
3.1 General
Short-term symmetrical push-out tests were carried out in two phases from the end of
2006 to 2008 at the University of Canterbury, New Zealand. A long-term push-out test
was performed in conjunction with the second phase of the short-term push-out test. A
total of 30 specimens of 15 connection types (A1 to C2 detailed in Fig. A3-1(a) to (f), and,
D1 to H4 in Fig. A3-2(a) to (e)), 2 specimens of each were constructed in the first phase
of the push-out test while 36 specimens were built in the second phase of the push-out test
which was made up of 30 specimens for the short-term test and 6 specimens for the
long-term test. 3 types of connections were constructed in the second phase, 9 specimens of
each as detailed in Fig. 4-1 (in the main text): (1) triangular notched coach screw – T; (2)
300 mm rectangular notched coach screw – R; and (3) toothed metal plate – P. Another 3
specimens of the triangular notched connection were built to be tested in the weak
direction (TT). It took approximately 2 months to make all the specimens in each phase.
All the construction activities were carried out in the Structures Laboratory except for the
pressing of the plates into the LVL for specimens with toothed metal plate connection
300 150 300 750 40 0 50 10 0 50 650 300 300 100 50 50 50 300 150 400 750 300 750 300 150 300 400 50 100 50 400 750
300 150 300
70
50
140
Fig. A3-1. First phase push-out test specimens, A1 to C2: (a) A1- Rectangular notch
150×50×63 mm coach screw φ16; or G1 - similar to A1 but with low shrinkage concrete;
or H1 - similar to A1 but a double LVL; (b) A2 - Rectangular notch 50×50×63 mm coach
screw φ16; (c) A3 - Rectangular notch 150×25×63 mm coach screw φ16; (d) B1-
Rectangular notch 150×50×63 mm; (e) C1: Rectangular notch 150×50×63 mm coach
screw φ12; and (f) C2: Rectangular notch 150×50×63 mm coach screw φ16 depth 140
(d)
(e) (f)
(a)
(b)
3
0
° 60°
137
60
310 303
750
30°
6
0
°
3
0
° 60°
200 150 200
400
50
10
0
50
Fig. A3-2. First phase push-out test specimens, D1 to H4: (a) D1 - Doves tail notch
150×50×63 mm; (b) E1 - Triangular notch 30°_60° 137×60×63 mm; (c) E2: Triangular
notch 30°_60° 137×60×63 mm coach screw φ16; (d) F1: Rectangular notch short end
150×50×63 mm coach screw φ16; (e) H2, H3, and H4 – Toothed metal plate of length
650, 325 and 150 mm, respectively.
The main components of a test specimen were the concrete slab and the LVL beam which
was connected either by a notch with or without coach screw, or a toothed metal plate.
The construction of the test specimens involved the following steps: (1) formwork
(a)
(b)
(c) (d)
making for the slab; (2) cutting of the LVL and the notches; (3) insertion of the coach
screws; (4) assembly of slab formwork to LVL beam; (5) reinforcing works; and (6)
casting of concrete. Approximately two months were taken to prepare all test specimens
in each push-out test phase by two skill workers working 8 hours a day, 5 days a week
before they were ready for concreting. Hence, 640 man-hours were utilised to construct
30 numbers of symmetrical push-out test specimens in a laboratory setting where most of
the works were done manually or with small power tools. Fig. A3-3 illustrates a typical
push-out test specimen.
Fig. A3-3. Typical push-out test specimen: (a) 3 dimensional view; and (b) Front elevation
3.2 Formwork making for the slab
45b × 90d mm sawn timbers were used to make the edges of the slab formwork while 17
mm thick plywood for the formwork base. The two components were interconnected by
underlying splices connected with screws (Fig. A3-4(a)). A total of 200 linear meter 45b
× 90d mm sawn timbers and 25 m2 of plywood were used in the second phase push-out
test. All the sawn timber and plywood were first measured and cut to the required length
and size before they were fabricated into a box (Fig. A3-4(b)).
Fig. A3-4. (a) Preparation of plywood base interconnected with screws to the edge forms; (b) Box formwork for the concrete slab; (c) Cutting of notches using bandsaw; (d) 200 mm length coach screw.
Rectangular holes for the notches were cut in the plywood using a jigsaw. Two 28 mm
diameter holes were also made adjacent to the middle length of the connection on both
sides for instrumentation purposes. 6 mm threaded rod with coupling nuts was inserted
through each hole extending to the mid depth of the concrete slab and cast into the
concrete to enable the mounting of potentiometers during the testing. Once the boxes
were ready, they were painted with two layers of basic white acrylic paint in order to
prevent absorption of water from the concrete into the timber. This also avoid the lost of
water from the concrete which can cause excessive drying shrinkage and cracking.
3.3 Cutting of LVL and notches
Table A3-1 shows the dimensions and numbers of LVL used to build test specimens for
the second phase of the push-out test. In both phases of the push-out test, the LVL were
first measured, marked, and cut to length before the notches were removed from both
longitudinal sides using a band saw (Fig. A3-4(c)). The operation was tedious and time
(a) (b)
consuming as it meant cutting along a 63 mm thickness of the LVL. For all the
connection types, single LVL were required except for the toothed metal plate connection
where double LVL were used so that the plates can be sandwiched in between the two
pieces of LVL.
Table A3-1. Dimensions and numbers of LVL pieces used to construct the specimens in second phase of push-out test
Type of connection Numbers Dimensions b×d×l (mm)
Triangular notch (T and TT) 14 63 × 400 × 660
Rectangular notch (R) 11 63 × 400 × 805
Toothed metal plates (P) 22 63 × 400 × 760
3.4 Insertion of coach screws
Prior to the insertion of the coach screw using a socket wrench, a hole to the size of the
shank of the coach screw (12.5 mm in diameter) had to be predrilled. The coach screws
which were obtained from Blacks Fasteners were of varying sizes and lengths for the first
phase while in the second phase only 16 mm diameter and 200 mm length coach screws
were used (Fig. A3-4(d)). In the second phase, all the coach screws were embedded 100
mm into the LVL from the surface of the notch at the middle of the notch length and
breadth (Fig. A3-5(a)).
3.5 Pressing of toothed metal plates
The toothed metal plate used in the second phase were specially designed, pressed and
supplied by Mitek for this timber-concrete composite project. The 1 mm thick plate is
136d× 333l mm with 2 rows of 22 mm diameter holes on the upper section and 1.2 mm
length teeth on the remaining lower section of 86 mm depth (Fig. A3-5(b)). The holes
enabled concrete bonding with the plate and for the reinforcing steel to protrude across
the slab. The pressing of the plate into the LVL were carried out in Westlake Timber, a
licensed fabricator of Mitek. Each LVL were marked before placing and pressing the
Fig. A3-5. (a) Coach screw inserted into triangular notch; (b) Specially designed tooth metal plate; (c) and (d) Pressing of plates into LVL
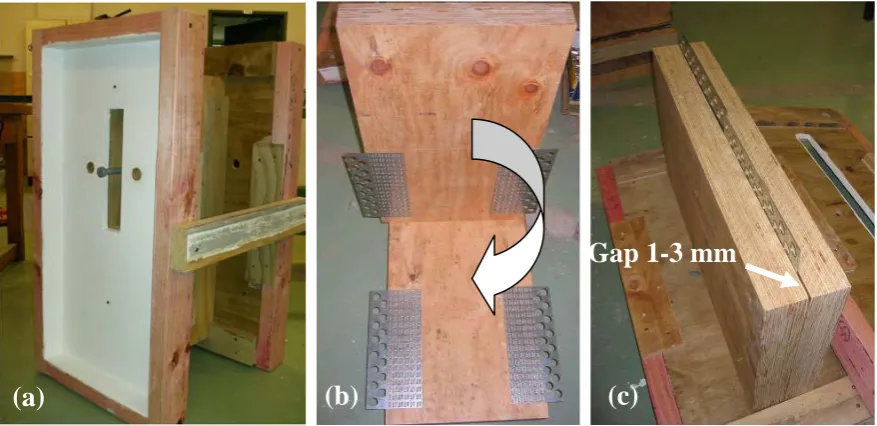
3.6 Assembly of slab formwork to LVL
Two to three 90l× 3.15φ mm head-collated nails using a nail gun temporarily fasten each
plywood box to the LVL on both sides. The nails should not contribute to the strength of
the connection. The notch openings at the underside of the plywood panels were covered
with small plywood remnants. In order to ensure stability of the formwork slab flanges, a
piece of sawn timber was screwed to the top and bottom flanges (Fig. A3-6(a)).
For the specimens with toothed metal plate, 2 LVL pieces were first nailed together, 3
nails on each side of the LVL face in a staggered orientation as oppose to the other face of
the LVL (Fig. A3-6(b)). Next, the plywood boxes were fastened onto the double LVL on
both longitudinal sides with a minimum number of nails. A 1 to 3 mm gap between the 2
pieces of LVL that were nailed together is inevitable due to the thickness of the plates and
slight eccentricity that may have been present caused by the pressing in the plates (Fig.
A3-6(c)).
(a)
[image:23.595.93.531.70.400.2]Fig. A3-6. (a) Rectangular notched connection specimen completely assembled, also showing surface painted with white acrylic paint; (b) Staggered orientation of plates in LVL; and (c) Toothed metal plate connection specimen with double LVL
3.7 Concreting of the specimens
Fig. A3-7(a) and (b) show the specimens in the second phase ready for concrete pouring.
The concrete was poured in two sessions for each batch as the specimens had to be turned
over after the casting of the first side of the slab for the other side to be poured after seven
days (Fig. A3-7(c) to (f)). The concrete was compacted using a poker vibrator (Fig.
A3-7(d)). Care was taken so that the concrete in the notches are well compacted. Each
side of the slab was cured once after the concrete hardened (after six to seven hours) by
means of damp Hessian sacks for four to five days (Fig. A3-7(e)). The curing process was
important in order to reduce the rate of hydration and thus prevent the concrete from
cracking.
Gap 1-3 mm
[image:24.595.91.530.92.305.2]Fig. A3-7. (a) Toothed metal plate connection specimen; (b) Specimens awaiting concrete; (c) Concrete pouring of specimens; (d) Compacting of concrete with a poker vibrator; (e) Concrete curing with damp Hessian sacks; (f) Specimens after curing stage (top view)
(a) (b)
(c)
(d)
[image:25.595.92.532.69.628.2]APPENDIX
4.
Notched connection strength evaluation analytical model
This appendix presents the calculation spreadsheet for the strength evaluation analytical
model of notched coach screw connection which has been discussed in Section 4.7 of the
main text.
4.1 Analytical model to New Zealand Standard
The analytical model was derived based on four possible failure modes:
1. Failure of concrete notch in shear (Fig. A4-1)
2. Failure of concrete notch in crushing (Fig. A4-2)
3. Failure of LVL in longitudinal shear (Fig. A4-3)
4. Failure of LVL in crushing parallel to the grain (Fig. A4-4)
Based on the push-out tests, in all case, it was the failure of concrete notch in shear that
governed.
FAILURE OF CONCRETE IN SHEAR
Notch shear strength 0.2f'cbl = 170.1 kN
NZS 3101 Design of corbels (p.16-2)
Coach screw strength nk1pQm = 16.33 kN
NZS 3603 (p.62)
TOTAL STRENGTH (Fconc shear) 0.2f'cbl + nk1pQm = 186.4 kN
Notch length l = 300 mm
Notch breadth b = 63 mm
Concrete mean compressive strength f'c = 45 Mpa
Number of coach screw n = 1
Modification factor for load duration k1 = 1
NZS 3603 (p.22) (not green timber; short duration loading; not in end grain)
Penetration or anchor length p = 100 mm
Screw characteristic withdrawal strength Qk= 147 N/mm
NZS 3603 (p.62) (group J4); the shank diameter of the coach screw is 12.5mm
Fig. A4-1. Failure of concrete notch in shear along length
concrete Crushing in concrete
timber
Vmax h
Fig. A4-2. Failure of concrete notch in crushing
Timber Concrete
b
L
Split timber
Fig. A4-3. Failure of LVL in longitudinal shear
Vmax
concrete
timber
Crushing in LVL
h
FAILURE OF CONCRETE IN CRUSHING
Concrete crushing strength Fconc crush = f'cAc 141.8 kN
NZS 3101 (p.16-1)
Notch depth h= 50 mm
Notch breadth b = 63 mm
Effective area Ac = 3150 mm
2
Concrete mean compressive strength f'c = 45 Mpa
FAILURE OF LVL IN SHEAR
LVL longitudinal shear strength (FLVL shear)k1k4k5fsLb = 133.56 kN
LVL mean longitudinal shear strength FLVL shear / φ 148.4 kN
NZS 3603 (p.21)
LVL characteristic shear strength fs= 5.3 Mpa
LVL shear length L = 400 mm
Notch breadth b = 63 mm
Modification factors
Load duration (for short-term) k1 = 1
Load sharing (for LVL) k4 = 1
k5 = 1
LVL Strength reduction factor φ = 0.9
FAILURE OF LVL IN CRUSHING
LVL compressive strength (FLVL crush) k1fcbd = 141.75 kN
LVL mean compressive strength FLVL crush / φ 157.5 kN
LVL characteristic compressive strength fc = 45 Mpa
Load duration (for short-term) k1 = 1
Notch depth d = 50 mm
v = 0.6(1-fck/250) 0.516 MPa
fcd = fck/1.6 21.88 MPa
fcm = 45 MPa
v* = 0.6(1-fcm/250) 0.49 MPa
av=0.5d = 150
β = av/2d 0.25
when the distance of the loading point is less than av
β*=(ln-2φcs)/2ln 0.45
coefficient considering the notch length and outer diameter of coach screw
LVL + Coach screw EC5 (p.77)
nef = 1 coach screw
φcs = 16 mm outer diameter
dp = 100 mm
def = dp - φcs 84 mm
ρk = 580 kg/m
3
ρm = ρk / 0.9 644.44 kg/m
3
fw,k= 50.29 MPa
characteristic withdrawal strength perpendicular to grain
fw,m= fw,k /0.9 58.90 MPa EC method
β0.5bnlnvfcd 52.31 kN
nef(πφcsdef)0.8fw,k 46.83 kN
TOTAL 99.14 kN
EC* method
β*0.5bnlnv*fcm 93.45 kN
nef(πφcsdef)0.8fw,m 46.83 kN
TOTAL 140.28 kN
β0.5bnlnv*fcm
nef(πφcsdef)0.8fw,m
APPENDIX
5.
Short-term connection push-out test
This appendix presents the setup, computation of results, and photographs (for Phases 1
and 2) of short-term connection push-out tests.
5.1 Connection push-out test setup
The connection push-out test setup which was performed in the Structures Laboratory of
the Department of Civil and Natural Resources Engineering, University of Canterbury is
illustrated in Fig. 3-6 (in main text) and described in Section 4.4 (in main text). 50 mm
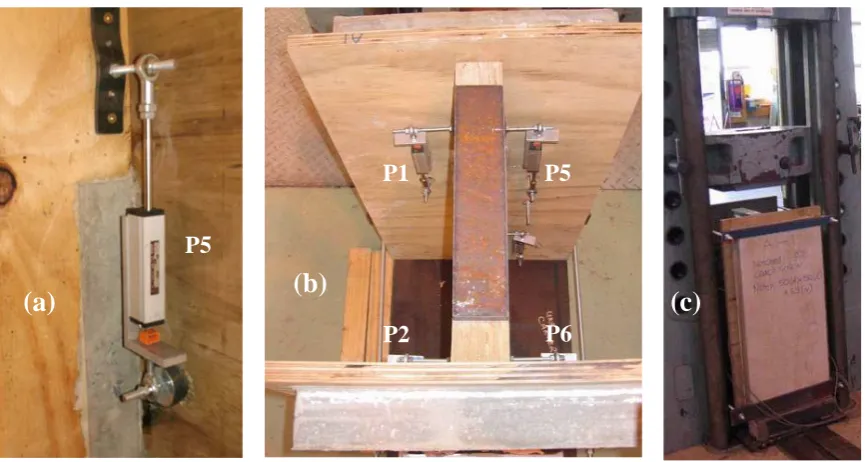
potentiometers with ±0.4% accuracy: P1, P2, P5 and P6 (Fig. A5-1(a and b)) were used to
measure relative slips in connection potentiometer P3 for horizontal slip (Fig. 3-6 in main
text). Horizontal slip was measured to observe possible separation between LVL and
concrete and to aid in determining whether there would be a problem with the flanges of
the specimens separating from the LVL web and falling out, possibly damaging equipment
or injuring someone. One specimen was tested without any form of restraint, and it was
found that significant separation occurred due to the bending moment induced in the
specimen by the load. Since in the actual timber-concrete composite beam the connections
are loaded in pure shear and separation between the concrete and timber is not likely to
occur, it was decided to prevent the separation in the specimens using steel straps. These
were placed at the top and bottom of the specimens for two tests and then the bottom strap
only was used for another two tests. It was found that the strength values were almost
identical for having two restraints or only one restraint at the bottom; therefore it was
decided to just use the single strap at the bottom of the specimens for the rest of the testing.
A potentiometer was used at location P4 (Fig. 3-6 in main text) to compare the difference
between measuring the slip at the connection or at the base. This was because previous
push-out tests performed by Kuhlmann and Michelfelder (2004) used this form of
measurement, and comparison between the results obtained at the connection level and at
Fig. A5-1. Setting up of push-out test under a Universal Testing Machine: (a) 50 mm potentiometer used to measure relative slip; (b) 20 mm thick steel plate on top of LVL for distribution of load; (c) Specimen slid under loading ram ready for test.
Fig. A5-2. (a) Loading procedure and (b) idealised load-slip curve
All the instrumentation such as the load cells, data acquisition boxes and potentiometers
were first calibrated to ensure accuracy in the data recorded. For instance, a scale factor
was found for each of the calibrated potentiometers. This scale factor was multiplied by a
coefficient measured in the calibration to return the correct measured displacement. A text
file containing all the specified channels and corresponding scale factors was written and
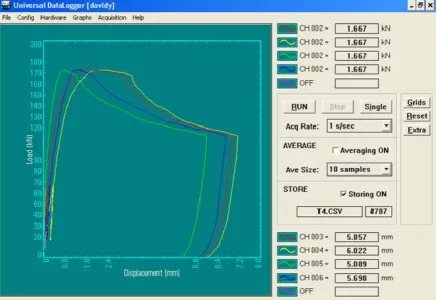
uploaded into a software known as Universal Data Logger (UDL). This UDL software was
used to record the load-relative slip relationships for every channel of each test. Similarly,
the load cell which is inherent in the Universal Testing Machine was calibrated as such to
(a) (c)
(b)
P2 P6
[image:31.595.91.524.89.320.2]synchronize the digital read out in the UDL software with the original analog read out of
the Universal Testing Machine.
Each specimen which weighed between 100 to 150 kg was positioned on a specially made
test platform with the assistance of an overhead crane. The test platform made from steel
was placed on the rail of the Universal Testing Machine outside the loading ram. The
specimen was seated as such that only the concrete flanges of the specimen were
supported and not together with the plywood section. A 20 mm thick steel plate was
placed on top of the LVL web to facilitate an even distribution of the load (Fig. A5-1(b)).
The length of this plate was made to be the distance between the bottom edges of the two
opposite notches cut in the LVL and the width of the plate equal to the width of the LVL
piece. Once all the potentiometers have been mounted and the specimen placed correctly,
the test platform with the specimen on it was slid carefully under the loading ram of the
Universal Testing Machine (Fig. A5-1(c)). A stopper knob was inbuilt onto the test
platform so that when the platform is slid under the ram, it would stop in the centre
position automatically and any eccentricity eliminated.
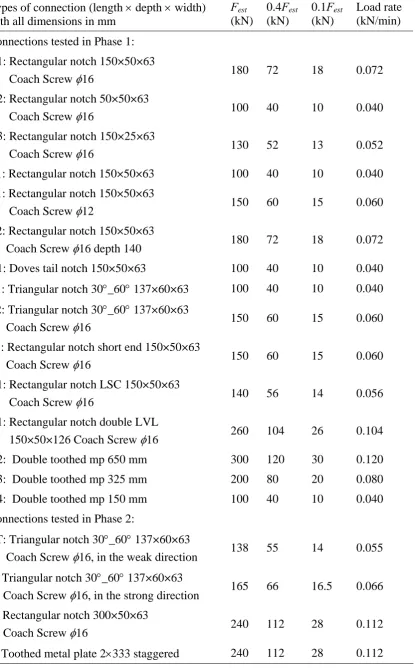
The connections were loaded at a rate of 0.2Fest kN per minute in shear with the load
applied onto the LVL web section of the specimen until the connection failed. The load
regime followed for the testing is presented in Fig. A5-2(a) as given in EN 26891 (CEN,
1991). This involves an initial estimate of the strength (Fest) of the specimen which was
determined on the basis of experience, preliminary tests, or calculation. This was then
adjusted for the second specimen using the new actual Fest from the first tested specimen.
The specimen was first loaded to 0.4Fest and held for 30 seconds, then unloaded to 0.1Fest
and maintained for 30 seconds. Thereafter the specimen was loaded to failure or to a
maximum slip of 20 mm, whichever occurred first.
The purpose of the initial load-unload phase was to eliminate any internal friction in the
connection, and to ensure any initial slip or slack present in the connection does not affect
the final results. The slip measurements ν01, ν04, ν14, ν11, ν21, ν24, ν26 and ν28 shown in Fig.
A5-2(b) were recorded for each test specimen using potentiometers that were mounted
A2: Rectangular notch 50×50×63
Coach Screw φ16 100 40 10 0.040
A3: Rectangular notch 150×25×63
Coach Screw φ16 130 52 13 0.052
B1: Rectangular notch 150×50×63 100 40 10 0.040
C1: Rectangular notch 150×50×63
Coach Screw φ12 150 60 15 0.060
C2: Rectangular notch 150×50×63
Coach Screw φ16 depth 140 180 72 18 0.072
D1: Doves tail notch 150×50×63 100 40 10 0.040
E1: Triangular notch 30°_60° 137×60×63 100 40 10 0.040
E2: Triangular notch 30°_60° 137×60×63
Coach Screw φ16 150 60 15 0.060
F1: Rectangular notch short end 150×50×63
Coach Screw φ16 150 60 15 0.060
G1: Rectangular notch LSC 150×50×63
Coach Screw φ16 140 56 14 0.056
H1: Rectangular notch double LVL
150×50×126 Coach Screw φ16 260 104 26 0.104
H2: Double toothed mp 650 mm 300 120 30 0.120
H3: Double toothed mp 325 mm 200 80 20 0.080
H4: Double toothed mp 150 mm 100 40 10 0.040
Connections tested in Phase 2:
TT: Triangular notch 30°_60° 137×60×63
Coach Screw φ16, in the weak direction 138 55 14 0.055
T: Triangular notch 30°_60° 137×60×63
Coach Screw φ16, in the strong direction 165 66 16.5 0.066
R: Rectangular notch 300×50×63
Coach Screw φ16 240 112 28 0.112
[image:33.595.104.520.96.765.2]
The load range set on the Universal Testing Machine was 500 kN and therefore the
loading rate adjusted on the machine was calculated in kN/min as 500
F 2 .
0 est
. Table A5-1
summarizes the types of connection tested with their respective initial estimate of strength
[image:34.595.89.527.216.516.2]for a pair of connections, Fest, in the loading rate computation.
Fig. A5-3. Load-relative slip of push-out test plotted automatically in the UDL software interface
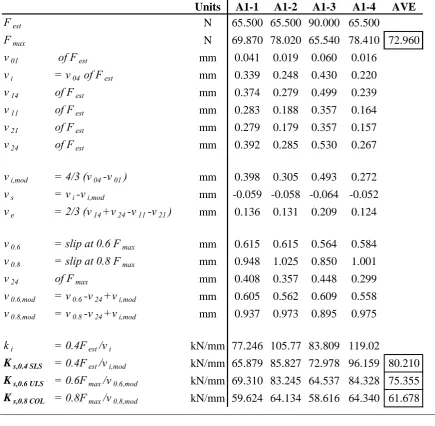
5.2 Computation of push-out test results
EN 26891 (CEN, 1991) regulates the derivation of the connection’s shear strength and
secant slip moduli at 40% (taken as the serviceability limit state - SLS), 60% (taken as the
ultimate limit state - ULS) and 80% (at collapse) of the shear strength as outlined in Eq.
A5-1 to Eq. A5-3 respectively. Eq. A5-4 to Eq. A5-9 present the calculation of different
slip measurements from the push-out test that led to the computation of the
Units A1-1 A1-2 A1-3 A1-4 AVE
Fest N 65.500 65.500 90.000 65.500
Fmax N 69.870 78.020 65.540 78.410 72.960
v01 of Fest mm 0.041 0.019 0.060 0.016
vi = v04 of Fest mm 0.339 0.248 0.430 0.220
v14 of Fest mm 0.374 0.279 0.499 0.239
v11 of Fest mm 0.283 0.188 0.357 0.164
v21 of Fest mm 0.279 0.179 0.357 0.157
v24 of Fest mm 0.392 0.285 0.530 0.267
vi,mod = 4/3 (v04-v01) mm 0.398 0.305 0.493 0.272
vs = vi-vi,mod mm -0.059 -0.058 -0.064 -0.052
ve = 2/3 (v14+v24-v11-v21) mm 0.136 0.131 0.209 0.124
v0.6 = slip at 0.6 Fmax mm 0.615 0.615 0.564 0.584 v0.8 = slip at 0.8 Fmax mm 0.948 1.025 0.850 1.001
v24 of Fmax mm 0.408 0.357 0.448 0.299
v0.6,mod = v0.6-v24+vi,mod mm 0.605 0.562 0.609 0.558
v0.8,mod = v0.8-v24+vi,mod mm 0.937 0.973 0.895 0.975
ki = 0.4Fest/vi kN/mm 77.246 105.77 83.809 119.02
Ks,0.4 SLS = 0.4Fest/vi,mod kN/mm 65.879 85.827 72.978 96.159 80.210
Ks,0.6 ULS = 0.6Fmax/v0.6,mod kN/mm 69.310 83.245 64.537 84.328 75.355
Ks,0.8 COL = 0.8Fmax/v0.8,mod kN/mm 59.624 64.134 58.616 64.340 61.678
Slip modulus at SLS, Ks,0.4 = 0.4Fest/vi,mod Eq. A5-1
Slip modulus at ULS, Ks,0.6 = 0.6Fmax/v0.6,mod Eq. A5-2
Slip modulus at collapse, Ks,0.8 = 0.8Fmax/v0.8,mod Eq. A5-3
[image:35.595.85.521.190.616.2]Modified initial slip, vi,mod (v v ) 3
4
01 04−
= Eq. A5-5
Slip at 0.6Fmax =v06 Eq. A5-6
Modified slip at 0.6Fmax, v0.6,mod =v0.6 −v24 +vi,mod Eq. A5-7
Slip at 0.8Fmax =v08 Eq. A5-8
Modified slip at 0.8Fmax, v0.8,mod =v0.8 −v24 +vi,mod Eq. A5-9
5.3 Phase 1 connection push-out test
Fig. A5-4. (a) Avery universal testing machine used for connection push-out test; (b) data acquisition box for load and relative slip; (c) Symmetrical push-out specimen set up with
(a)
(b)
[image:36.595.89.527.232.691.2]Fig. A5-5. Specimen A1 – 150 mm rectangular notched coach screw connection. Shear failure along length of notch. Coach screw in tension (bottom left)
[image:37.595.90.495.491.720.2]Fig. A5-7. Specimen H1 – Double LVL 150 mm rectangular notched coach screw connection. Inside coach screws in tension
Fig. A5-10. Specimen H3 – Double tooth metal plate. Complete plate tear off failure
5.4 Phase 2 connection push-out test
Fig. A5-12. Specimen T – Triangular notched coach screw connection. Shear failure along notch length and coach screw in tension
(Structures Laboratory). Table A6-1 summarizes the beams that have been constructed.
Table A6-1. Beams constructed indoor and outdoor
Location Beams
Indoor A1, A2, B1, B2, E1, E2, G1
Outdoor C1, D1, D2, F1, F2
Note: Beams D2 and F2 were tested under cyclic load. This test is beyond the scope of this thesis.
6.1 Construction of beams indoor
Fig. A6-2. (a) Triangular notched cut in beam C2; (b) 150 mm rectangular notched cut in beams B1 and B2 (in the background)
Fig. A6-3. Setting up of indoor beams using thread line for correct alignment
Fig. A6-4. (a) Constructing formwork for the flange; (b) Beams A1, A2, B1, B2 and C2 ready for concreting in the laboratory
(a)
(b)
(a)
(b)
Fig. A6-5. Close up of beams that were ready for concreting: (a) beam A1; (b) beam C2
Fig. A6-6. (a) 6 mm threaded rod, screw and washer mounting concreted adjacent to connection for horizontal relative slip measurement using potentiometer; (b) potentiometer attached to measure horizontal relative slip
Fig. A6-7. Construction of beam G1: (a) double 150 mm rectangular notch with coach screw; (b) formwork leveling
(a)
(a)
(b)
Fig. A6-8. Concreting of beam G1
Fig. A6-9. (a) Beam G1 after concreting; (b) beams G1, E1 and E2
Fig. A6-10. Propping of beams at mid-span
(a)
(b)
G1
Fig. A6-11. Beam A2 with notched pocketed and grouted after 7 days of concreting
[image:45.595.89.530.523.724.2]Fig. A6-13. Notches visible under side of beams, triangular notch (left) and rectangular notch (right)
6.2 Construction of beams outdoor
Fig. A6-14. Setting out of beam C1 with a triangular notched coach screw connection
Fig. A6-15. (a) Inserting coach screws using a pneumatic powered socket gun; (b) Attaching flange formwork to the LVL joist with a nail-gun
Fig. A6-16. (a) Sealing holes in the formwork; (b) Beams C1, D1 and D2 ready for concreting
Fig. A6-17. (a) Concreting of beams C2, D1 and D2; (b) after concreting
Fig. A6-18. (a) Pressing in of metal plates into LVL for beams F1 and F2 at Westlake Timbers, Christchurch (a fabricator of Mitek); (b) Close up of metal plate
(b)
(a)
(b)
Fig. A6-19. Setting out of beams F1 (left) and F2 (right)
Fig. A6-20. (a) Construction of formwork; (b) concreting beams F1 and F2
Fig. A6-21. (a) Outside beams; (b) lifting of outside beams into the laboratory for testing
(a)
(b)
F1
7.1 Experimental setting up
Fig. A7-1. Four point bending test set up: (a) Overall view; (b) Loading spreader beam; (c) 400 kN loading ram
Fig. A7-2. (a) Computer 1 to control load regime, computer 2 to acquire data, and hydraulic pump to apply load; (b) roller support; (c) pin support
(a) (b)
(c)
(a) (b)
(c)
1
2
[image:49.595.88.518.214.433.2]Fig. A7-3. Potentiometers used to measure connection relative slips and mid-span displacement
7.2 Failures in beams
Fig. A7-4. Shear failure along length of 150 mm rectangular notch with coach screw in beam A1. 3 to 4 mm separation of notch from LVL (bottom right).
Compression zone
Shear failure Compression zone
Fig. A7-5. Beam B1: (a) no sign of failure in connections; (b) sudden bending tension failure in LVL at one third span
Fig. A7-6. Beam C2: (a) no obvious failure in connections apart from hair line cracks and separation from LVL in one notch; (b) sudden bending tension failure in LVL at one third span
(a)
(a)
Fig. A7-7. Beam C1: (a) no sign of failure in connections; (b) sudden bending tension failure in LVL at one third span
Fig. A7-8. Beam E1: (a) Shear along notch length and compression failure; (b) complete
(a)
(b)
(a)
(b)
(c)
Shear along length
Compression
Separation
Fig. A7-9. (a) Dismantling of beam E1 after test; (b) Coach screws 1 (nearest to support), 2, 3 (nearest to point load at one third span). Only coach screw 3 had slight bent.
Fig. A7-10. Beam G1: No failure in connection (top left), and LVL bending tension failure at one third span
[image:53.595.89.530.313.652.2]Fig. A7-11. Beam F1: sudden bending tension failure in LVL at one third span
7.3 Load-deflection graphs of tested beams
Load-Deflection of Beam A1
0 10 20 30 40 50 60 70 80 90
0 10 20 30 40 50 60 70
Mid Span Deflection (mm)
L o ad , 2P ( k N ) A1 Exp Full Comp No Comp LVL only K0.4=112.78 kN/mm K0.6=102.20 kN/mm K0.8=76.06 kN/mm 0.8Fmax ULS SLS 4000 1650 700 2275 275 975 150 400 350 1300
2667/2 = 1333.5
BEAM A, span = 8 m
CONNECTION TYPE: 25x150 NCS16
Load-Deflection of Beam A2
0 10 20 30 40 50 60 70 80 90
0 10 20 30 40 50 60 70
Mid Span Deflection (mm)
Lo a d , 2 P ( k N ) A2 Exp Full Comp No Comp LVL only K0.4=112.78 kN/mm K0.6=102.20 kN/mm K0.8=76.06 kN/mm 0.8Fmax ULS SLS 4000 1650 700 2275 275 975 150 400 350 1300
2667/2 = 1333.5 BEAM A, span = 8 m
0 20 40
0 10 20 30 40 50 60 70 80
Mid Span Deflection (mm)
Loa d ULS SLS 4000 1200 600 1325 2725 2025 225 725 150 40 0 500
300 700 700
BEAM B,span = 8 m
CONNECTION: 25x150 NCS16
Load-Deflection of Beam B2
0 20 40 60 80 100 120
0 10 20 30 40 50 60 70 80
Mid Span Deflection (mm)
L o ad , 2P ( k N ) B2 Exp Full Comp No Comp LVL only K0.4=112.78 kN/mm K0.6=102.20 kN/mm K0.8=76.06 kN/mm 0.8Fmax ULS SLS 4000 1200 600 1325 2725 2025 225 725 150 400 500
300 700 700
BEAM B,span = 8 m
CONNECTION: 25x150 NCS16
2667/2 = 1333.5
Load-Deflection of Beam C1
0 20 40 60 80 100 120
0 10 20 30 40 50 60 70
Mid Span Deflection (mm)
L o ad , 2P ( k N ) C1 Exp Full Comp No Comp LVL only K0.4=145.76 kN/mm K0.6=138.84 kN/mm K0.8=115.91 kN/mm 0.8Fmax ULS SLS 500 1330 4000 2030 2730 BEAM C, span = 8 m CONNECTION: 30_60degTriNCS16 230 730 20 0 300 150 1200 700 600 700
Load-Deflection of Beam C2 0 20 40 60 80 100 120
0 10 20 30 40 50 60 70
Mid Span Deflection (mm)
Loa d, 2 P ( k N ) C2 Exp Full Comp No Comp LVL only K0.4=145.76 kN/mm K0.6=138.84 kN/mm K0.8=115.91 kN/mm 0.8Fmax ULS SLS 500 1330 4000 2030 2730
BEAM C, span = 8 m
CONNECTION: 30_60degTriNCS16 230 730 20 0 300 150 1200 700 600 700
2667/2 = 1333.5
Load-Deflection of Beam D1
0 10 20 30 40 50 60 70 80 90
0 5 10 15 20 25 30 35 40 45 50
Mid Span Deflection (mm)
Loa d, 2 P ( k N ) D1 Exp Full Comp No Comp LVL only K0.4=247.23 kN/mm K0.6=241.43 kN/mm K0.8=194.24 kN/mm 0.8Fmax ULS SLS 40 0 1100 4000 2300 300 150 800
BEAM D, span = 8 m
CONNECTION:50x300 NCS16
450 1200 1550
2667/2 = 1333.5
Load-Deflection of Beam E1
0 10 20 30 40 50 60 70 80
0 10 20 30 40 50 60 70 80 90 100
Mid Span Deflection (mm)
Lo a d , 2 P ( k N ) E1 Exp Full Comp No Comp LVL only K0.4=247.23 kN/mm K0.6=241.43 kN/mm K0.8=194.24 kN/mm 0.8Fmax ULS SLS 1500 5000 3150 40 0 1650 450 150 1200 600 1700
BEAM E, span = 10 m
CONNECTION: 50x300 NCS16
0 10 20 30
0 10 20 30 40 50 60 70 80 90 100
Mid Span Deflection (mm)
Loa ULS SLS 1500 5000 3150 40 0 1650 450 150 1200 600 1700
BEAM E, span = 10 m
CONNECTION: 50x300 NCS16
Load-Deflection of Beam F1
0 20 40 60 80 100 120 140 160 180
0 10 20 30 40 50 60 70 80 90 100
Mid Span Deflection (mm)
L o ad , 2P ( k N
) F1 Exp
Full Comp No Comp LVL only K0.4=463.67 kN/mm K0.6=394.65 kN/mm K0.8=256.82 kN/mm 0.8Fmax ULS SLS 700 40 0
550 800 1000 1100
136
333
4000
2667/2 = 1333.5
Load-Deflection of Beam G1
0 30 60 90 120 150 180 210
0 10 20 30 40 50 60 70 80 90 100
Mid Span Deflection (mm)
L o ad , 2P ( k N ) G1 Exp Full Comp No Comp LVL only K0.4=225.55 kN/mm K0.6=204.39 kN/mm K0.8=152.13 kN/mm 0.8Fmax ULS SLS 700 2725 2025 4000 150 725 1325 225 500 400
300 600 700 1200 2667/2 = 1333.5
BEAM G, span = 8 m
7.4 Connection slips measured for selected beams
Note that connection number 1 referred to one nearest to the support and connection with
the largest number referred to one nearest to the midspan.
Load-Connection Slip for Beam A1
0 10 20 30 40 50 60 70 80
0 0.2 0.4 0.6 0.8 1 1.2 1.4 1.6 1.8 2
Connection Slip (mm)
L o a d , 2 P (k N ) Conn 1_A1 Conn 2_A1 Conn 3_A1
Load-Connection Slip for Beam A2
0 10 20 30 40 50 60 70 80
0 0.2 0.4 0.6 0.8 1 1.2 1.4 1.6 1.8 2
Connection Slip (mm)
Load-Connection Slip for Beam B1
0 20 40
0 0.2 0.4 0.6 0.8 1 1.2 1.4 1.6 1.8 2
Connection Slip (mm)
L o ad , 2P Conn 3_B1 Conn 4_B1 Conn 5_B1
Load-Connection Slip for Beam B2
0 20 40 60 80 100 120
0 0.2 0.4 0.6 0.8 1 1.2 1.4 1.6 1.8 2
Connection Slip (mm)
Loa d , 2 P ( k N ) Conn 1_B2 Conn 2_B2 Conn 3_B2 Conn 4_B2 Conn 5_B2
Load-Connection Slip for Beam C1
0 10 20 30 40 50 60 70 80 90 100
0 0.2 0.4 0.6 0.8 1 1.2 1.4 1.6 1.8 2
Connection Slip (mm)
Load-Connection Slip for Beam C2 0 20 40 60 80 100 120
0 0.2 0.4 0.6 0.8 1 1.2 1.4 1.6 1.8 2
Connection Slip (mm)
Lo ad, 2P ( k N ) Conn 1_C2 Conn 2_C2 Conn 3_C2 Conn 4_C2 Conn 5_C2
Load-Connection Slip for Beam D1
0 10 20 30 40 50 60 70 80 90
0 0.2 0.4 0.6 0.8 1 1.2 1.4 1.6 1.8 2
Connection Slip (mm)
Load, 2 P ( k N ) Conn 1_D1 Conn 2_D1 Conn 3_D1
Load-Connection Slip for Beam E1
0 20 40 60 80 100
0 0.2 0.4 0.6 0.8 1 1.2 1.4 1.6 1.8 2
Load-Connection Slip for Beam E2
0 10 20
0 0.2 0.4 0.6 0.8 1 1.2 1.4 1.6 1.8 2
Connection Slip (mm)
L o ad , 2P Conn 1_E2 Conn 2_E2 Conn 3_E2
Load-Connection Slip for Beam F1
0 20 40 60 80 100 120 140 160 180
0 1 2 3 4 5 6
Connection Slip (mm)
Loa d, 2 P ( k N ) Conn 2_F1 Conn 3_F1 Conn 4_F1
Load-Connection Slip for Beam G1
0 30 60 90 120 150 180 210
0 0.2 0.4 0.6 0.8 1 1.2 1.4 1.6 1.8 2
Connection Slip (mm)
APPENDIX
8.
Design, construction and setup of long-term push-out Test
frames
This appendix describes in the design and construction of test frames used for the
long-term push-out test.
8.1 General
3 types of connections were built and tested in the long-term with the objective to
determine the creep coefficient of each connection for 1 year and then extended to 50
years: (1) Triangular notch 30°_60° 137l × 60d coach screw φ16 – T; (2) Rectangular
notch 300l×50d coach screw φ16 – R; and (3) Toothed metal plate 2×333l staggered – P.
3 frames were designed and built for this purpose. Plans for the test began in September
2007 with the design and drawings of the frames for the long-term push-out test while the
construction of the frames started in middle January 2008. The frames were completed in
late April 2008 and the long-term test commenced on the 19th May 2008. Another separate
3 specimens of each connection were setup without any load applied known as dummy
specimens. These dummy specimens were used to monitor possible displacements induced
by the self-weight of the specimens due to the change in temperature and relative humidity.
3 frames were constructed in the Structures Laboratory, Department of Civil and Natural
Resources Engineering, University of Canterbury. The frames were assembled in a garage
situated on Creyke Road located a few blocks from the University of Canterbury. This
long-term push-out test on the connections shared the same garage with the already
on-going long-term test on 3 timber-concrete composite beams. The garage is sheltered on all
sides without any insulation on the walls and, under unheated and uncontrolled
environmental condition. The stages involved in preparing for the frames are as follows:
implemented due to the large amount of service loads imposed on the frames. Existing
weights from other projects in the form of concrete blocks of 1000b× 1000w × 330h mm
weighing 823 kg each or equivalent to 8.07 kN were used as loads in the frames. The
service load imposed on each push-out specimen was defined as 0.3Fmax representing the
quasi-permanent part of the serviceability design load where Fmax is the maximum strength
of the connection determined from the short-term push-out test. The length (LR) of each
frame housing the 3 different connections were calculated based on the weight of the
concrete block so that the force exerted on the push-out specimen was equivalent to
0.3Fmax. The point of load application at the specimen to the pivot was decided as 400 mm
so that the specimen can be seated closest to the vertical member of the frame. Fig. A8-1
shows a typical set up of a long-term push-out test frame and Table A8-1 summarizes the
design details for the frames. The top horizontal member of the frames were designed with
universal column 200 UC 46.2 kg/m while the lower horizontal, vertical and other
stabilizing members were designed from single or double parallel flange channels 200
PFC 22.9 kg/m.
Table A8-1. Design details for long-term push-out test frames
Frame Fmax (kN) 0.3Fmax (kN) Weight (kN) LR (mm)
1 165 50 8.07 2680
2 240 72 8.07 3770
Fig. A8-1. Typical set up of a long-term push-out test frame (a) Side elevation; and (b) 3-dimensional view of frame
8.3 Construction of frames
The universal columns and parallel flange channels came in lengths of 6 m and had to be
cut to the required length according to the drawings. Fig. A8-2 to Fig. A8-4 presents the
side elevations and plan views for frames 1, 2 and 3 for triangular notched connection,
rectangular notched connection and toothed metal plate connection push-out specimens
respectively. Fig. A8-5 and Fig. A8-6 illustrate the connection details for the 3 frames.
(a)
blue paint.
Fig. A8-2. Frame 1 for triangular notched connection push-out specimen: (a) Side elevation; and (b) Bottom and top member plan view
Fig. A8-3. Frame 2 for rectangular notched connection push-out specimen: (a) Side elevation; and (b) Bottom and top member plan view
8.4 Assembly of frames
The ready elements were transported to the garage and assembled there because of logistic
and handling reasons. Due to the space and head room limitations in the garage, and the
physical conditions of the elements, the assembly tasks have to be carefully thought and
planned.
(a)
Fig. A8-4. Frame 3 for toothed metal plate connection push-out specimen: (a) Side elevation; (b) Bottom and top member plan view; and (c) Coupling of 2 concrete blocks together acting as weight in frame
(a)
(b)
Fig. A8-6. Connection details for frames 2 and 3
Due to the floor and head room constraints in the garage, and the heavy weight of the
high frame with pulleys and chain block; and (2) low frame with rollers, have to be made
for the purpose of assembling the test frames with the specimens under them. The lower
frame was used to sit the concrete weight and pushed it into position under the test frame
as shown in Fig. A8-7(a) and (b). The high lifting frame was used to lift the top member of
the test frame before bolting it to the vertical member of the test frame (Fig. A8-7(c)). It
was also used to lift the push-out specimen to position under the test frame as shown in
Fig. A8-7(d).
Fig. A8-7. Two specially built lifting frames for use in the assembly of test frames in garage: (a) and (b) Lower frame to si the weights and pushed them to position; (c) and (d) High frame fixed with pulleys and chain block to lift top member of frame or push-out specimen to position
(a)
(b)
[image:70.595.89.506.237.653.2]Fig. A8-8. Assembly of long-term push-out test frames: (a) Moving elements of a frame into the garage; (b) Positioning push-out specimen for frame 3; (c) Locating concrete weights for frame 3; (d) Frame 3 with push-out specimen and weights fully set up; (e) Hydraulic jack with LVL blocks used to temporarily held up frames before being loaded; and (f) Concrete weight fastened to top member of frame
The assembly of all frames with specimens in placed to be loaded took a total of 8 days in
May 2008. The handling and maneuvering of each push-out specimen was very difficult
and required at least two men due to the weight of the specimen being in the range of 100
to 150 kg and its odd irregular shape. The specimens had to be seated properly so as to
avoid any unevenness or eccentricity. Several 10 and/or 20 mm steel plates were used as
seats for this purpose and also to eliminate any height discrepancies. Similarly 20 mm
steel plates were slotted in between the top member and the LVL member of the specimen
where the load was applied onto. Individual LVL blocks or pieces were inserted to provide
(a)
(b)
(c)
(d)
a uniformly distribution of the load. Fig. A8-8 shows the assembly process of the test
frames in the garage.
Fig. A8-9. Potentiometers mounted to push-out specimens and loaded in test frames: (a) and (b) Frame 1 for triangular notched connection; and (c) and (d) Frame 2 for rectangular notched connection
(a)
(b)
push-out specimens in the short-term test.
The setup of the loading frames and push-out specimens with all the instrumentation were
ready on the 15th May 2008. A data acquisition trial run of the specimens under no loads
was carried out for a few days in order to eliminate any unnecessary errors. Finally on the
20th May 2008, the hydraulic jacks supporting the concrete weights were released to apply
the load on the specimens in the frames hence commencing the long-term test for a period
of 1 year. Initial sampling rate was set at every 1 minute for the first two days followed by
every 15 minutes in the next 1 week and subsequently every 1 hour. Temperature and
relative humidity data were taken from the existing long-term test setup for LVL-concrete
composite beams in the garage. The test was monitored on a weekly basis and the data
APPENDIX
9.
Construction and setup of long-term beam test
This appendix describes the construction and setting up of beams for long-term tests.
9.1 Construction and setup of long-term test beams – photographs
Three beams were constructed in a garage and tested in the long-term under sustained
load. Fig. A9-1 to Fig. A9-3 show the construction and setting up of a 600 mm wide TCC
single LVL with 300 mm rectangular notched coach screw connection and Fig. A9-4 to
Fig. A9-7 for a 1200 mm wide TCC double LVL with metal plate connection.
Fig. A9-1. (a) Construction of formwork for single LVL TCC 600 mm flange; (b) formwork ready with a coat of acrylic white paint and 300 mm rectangular notched with