ORIGINAL RESEARCH
ADULT BRAIN
Combining Quantitative Susceptibility Mapping with
Automatic Zero Reference (QSM0) and Myelin Water Fraction
Imaging to Quantify Iron-Related Myelin Damage in Chronic
Active MS Lesions
XY. Yao,XT.D. Nguyen,XS. Pandya,XY. Zhang,XS. Hurtado Ru´a,XI. Kovanlikaya,XA. Kuceyeski,X Z. Liu,XY. Wang, and XS.A. Gauthier
ABSTRACT
BACKGROUND AND PURPOSE: A hyperintense rim on susceptibility in chronic MS lesions is consistent with iron deposition, and the purpose of this study was to quantify iron-related myelin damage within these lesions as compared with those without rim.
MATERIALS AND METHODS: Forty-six patients had 2 longitudinal quantitative susceptibility mapping with automatic zero reference scans with a mean interval of 28.9⫾11.4 months. Myelin water fraction mapping by using fast acquisition with spiral trajectory and T2 prep was obtained at the second time point to measure myelin damage. Mixed-effects models were used to assess lesion quantitative susceptibility mapping and myelin water fraction values.
RESULTS:Quantitative susceptibility mapping scans were on average 6.8 parts per billion higher in 116 rim-positive lesions compared with 441 rim-negative lesions (P⬍.001). All rim-positive lesions retained a hyperintense rim over time, with increasing quantitative susceptibility mapping values of both the rim and core regions (P⬍.001). Quantitative susceptibility mapping scans and myelin water fraction in rim-positive lesions decreased from rim to core, which is consistent with rim iron deposition. Whole lesion myelin water fractions for rim-positive and rim-negative lesions were 0.055⫾0.07 and 0.066⫾0.04, respectively. In the mixed-effects model, rim-positive lesions had on average 0.01 lower myelin water fraction compared with rim-negative lesions (P⬍.001). The volume of the rim at the initial quantitative susceptibility mapping scan was negatively associated with follow-up myelin water fraction (P⬍.01).
CONCLUSIONS: Quantitative susceptibility mapping rim-positive lesions maintained a hyperintense rim, increased in susceptibility, and had more myelin damage compared with rim-negative lesions. Our results are consistent with the identification of chronic active MS lesions and may provide a target for therapeutic interventions to reduce myelin damage.
ABBREVIATIONS:FAST-T2⫽fast acquisition with spiral trajectory and T2-prep; GRE⫽gradient-echo; MWF⫽myelin water fraction; ppb⫽parts per billion; QSM⫽quantitative susceptibility mapping; QSM0⫽QSM with automatic uniform CSF zero reference; rim⫺ ⫽rim-negative; rim⫹ ⫽rim-positive
M
S is an inflammatory demyelinating and neurodegenerative disease of the CNS. Differentiating MS lesions, especially chronic lesions, may provide a biomarker for disease progression and a therapeutic target to reduce ongoing tissue damage. A subset of chronic lesions, identified as chronic active or slowly expanding le-sions, have been described as having a rim of iron-enriched proin-flammatory activated microglia and macrophages.1-4Iron-enrichedproinflammatory microglia release cytotoxins to adjacent oligoden-drocytes,5limit remyelination, and contribute to further demyelina-tion in chronic active lesions.3Therefore, identifying MS lesions with iron accumulation may enable the prediction of tissue damage.
MR imaging with a gradient-echo (GRE) sequence is sensitive to iron1,6and has been explored by many investigators to detect an iron rim in chronic active MS lesions.1,3,4,7-9Iron may be de-tected as hypointensity on a T2*-weighted GRE magnitude image or its phase-enhanced version known as SWI.8,10An R2*(⫽1⫼ T2*) map computed from a multiecho GRE magnitude image can be used to estimate iron content.11Unfortunately, precise map-ping of iron location by these magnitude-based approaches is
Received June 16, 2017; accepted after revision October 13.
From the Department of Radiology (Y.Y., Y.Z.), Tongji Hospital, Tongji Medical Col-lege, Huazhong University of Science & Technology, Wuhan, China; Departments of Radiology (Y.Y., T.D.N., S.P., I.K., A.K., Z.L., Y.W.) and Neurology (S.A.G.), Weill Cornell Medicine, New York, New York; Department of Mathematics (S.H.R.), Cleveland State University, Cleveland, Ohio; and Department of Biomedical Engi-neering (Z.L., Y.W.), Cornell University, Ithaca, New York.
This work was supported by grant RG 4661-A-2 from the National Multiple Sclero-sis Society, grant RO1 NS090464 from the National Institutes of Health, and grant UL1 TR000456-06 from the Weill Cornell Clinical and Translational Science Center (CTSC).
Paper previously presented at: Annual Meeting and Exhibition of the International Society for Magnetic Resonance in Medicine, April 22–27, 2017; Honolulu, Hawaii.
Please address correspondence to Susan A. Gauthier, DO, MPH, Department of Neurology, Weill Cornell Medical College, 1305 York Ave, Suite Y217, New York, NY 10021; e-mail: [email protected]
Indicates open access to non-subscribers at www.ajnr.org Indicates article with supplemental on-line photos.
hindered by blooming artifacts, particularly at high iron concen-trations.12Alternatively, the local magnetic field derived from a GRE phase image has been studied to quantify iron.13,14However, because the local phase is affected by magnetic sources in the surrounding tissue, the phase pattern may not represent the true magnetic susceptibility pattern.15 Quantitative susceptibility mapping (QSM)16is a phase-based magnetic field deconvolution technique that overcomes the blooming artifacts and provides more accurate quantification and localization of the magnetic sources.17,18QSM has been established as a more sensitive and quantitative technique for measuring brain iron compared with T2*, R2, and R2*.19,20Studies have emerged combining QSM with additional MR tissue parameters, such as R2*, to characterize the pattern of iron deposition and demyelination among various MS lesions.21-23 However, the interpretation of iron accumulation and the associated tissue damage can be complicated because QSM and R2*are both sensitive to iron and myelin. Moreover, accurate tracking of lesion susceptibility changes over time is hin-dered by the lack of a reliable susceptibility reference, given that CSF can often appear highly heterogeneous on QSM and normal-appearing white matter may undergo pathologic iron or myelin changes.14
This study aimed to address these challenges by combining 2 recently developed techniques: myelin water fraction (MWF) im-aging by using fast acquisition with spiral trajectory and T2-prep (FAST-T2)24,25and QSM with automatic uniform CSF zero ref-erence (QSM0). MWF is a well-validated quantitative MR imag-ing biomarker for myelin,26,27which can be mapped efficiently and reproducibly with FAST-T2.25,28The QSM0 algorithm im-proves QSM zero reference selection by enforcing the susceptibil-ity homogenesusceptibil-ity of CSF within the brain ventricles and eliminat-ing the need for manual draweliminat-ing of CSF ROIs. QSM0 and MWF were used to identify MS lesions with a hyperintense rim pattern consistent with iron deposition and to assess the extent of myelin damage found within these lesions.
MATERIALS AND METHODS
Patient PopulationThis was a retrospective study of a cohort of 46 patients with MS (14 men, 32 women; mean age, 43.6⫾10.7 years) selected from a prospective, ongoing clinical MS MR imaging data base from Oc-tober 2011 to April 2015. The only inclusion criteria consisted of having simultaneous QSM and FAST-T2 sequences and a prior QSM. This cohort consisted of 1 patient with clinically isolated syndrome, 44 with relapsing-remitting MS, and 1 with second-ary-progressive MS (mean disease duration, 8.7⫾7.5 years; mean Expanded Disability Status Scale score, 1.78 ⫾ 1.84). Forty-three patients were on various disease-modifying thera-pies, and 3 were untreated. Patients identified for analysis had completed 2 longitudinal brain MR imaging examinations with a mean time interval of 28.9 ⫾11.4 months. Approxi-mately 45% of the patients changed to a different MS treatment between the 2 MR imaging time points. This study was ap-proved by the Weill Cornell Medicine institutional review board.
MR Imaging Data Acquisition
Brain MR imaging was performed on a 3T MR scanner (Signa HDxt; GE Healthcare, Milwaukee, Wisconsin) with an 8-channel head coil. The scanning protocol consisted of standard T1-weighted and T2-T1-weighted sequences for anatomy and multiecho GRE imaging for QSM, as well as gadolinium-enhanced T1-weighted imaging to detect blood-brain barrier disruption. In ad-dition, a FAST-T2 sequence was run at the second time point to map lesion MWF as a quantitative biomarker of myelin damage. The typical imaging parameters for pertinent imaging sequences were as follows: 1) T2-weighted multisection 2D fast spin-echo: TR, 5250 ms; TE, 86 ms; axial field of view, 24 cm; phase field of view factor, 0.75; acquisition matrix, 416⫻256 interpolated to 512⫻512; section thickness, 3 mm without gap; flip angle, 90°; echo-train length, 23; number of signal averages, 2; and readout bandwidth,⫾50 kHz; 2) multiecho GRE: TR, 57 ms; first TE, 4.3 ms; echo spacing, 4.8 ms; echo-train length, 11; axial field of view, 24 cm; phase field of view factor, 0.8; acquisition matrix, 416⫻ 320 interpolated to 512⫻512; section thickness, 3 mm; flip angle, 20°; bandwidth, 244 kHz; number of signal averages, 0.75; and readout bandwidth,⫾62.5 kHz; 3) 3D stack-of-spirals FAST-T2: spiral TR, 7.8 ms; spiral TE, 0.5 ms; nominal T2-prep times, 0 ms (T2-prep turned off), 7.6, 17.6, 27.6, 67.6, 147.6, and 307.6 ms; number of spiral leaves per stack, 32; axial field of view, 24 cm; acquisition matrix, 192⫻192 interpolated to 256⫻256; section thickness, 5 mm; number of sections, 32; flip angle, 10°; and read-out bandwidth,⫾125 kHz.
MR Imaging Postprocessing
Brain QSM0 maps were reconstructed from multiecho GRE data by using the morphology-enabled dipole inversion method29,30 and incorporating automated segmentation and regularization specific to CSF. Briefly, CSF within the lateral ventricles was iden-tified by thresholding of the R2*map (R2*⬍5 seconds⫺1) and imposing voxel connectivity. A regularization term penalizing susceptibility variation within the CSF mask was incorporated into the morphology-enabled dipole inversion algorithm to search for a solution with homogeneous CSF susceptibility. MWF maps were reconstructed from FAST-T2 data by using a multivoxel non-linear least-squares data-fitting algorithm with spatial smoothness constraints.25The lower and upper T2 bounds for each of the 3 water pools (in milliseconds) were set to [5 20], [20 200], and [200 2000], respectively (corresponding to myelin water, intra- and extracellular water, and long-T2 water such as CSF). MWF was calculated as the ratio of the myelin water signal and the total water signal within a voxel. Anatomic images and MWF maps were co-registered to GRE magnitude images (and the associated QSM maps) by using the FMRIB Linear Image Registration Tool (FLIRT;
https://fsl.fmrib.ox.ac.uk/fsl/fslwiki/FLIRT) algorithm.31
Image Analysis
their visual appearance on QSM obtained at each time point (QSM1 and QSM2). In the case of a disagreement, a third neuroradiologist (I.K.) with 20 years of experience was called on to determine the lesion subtype. Next, ROI analysis was performed by using ITK-SNAP software (version 3.2; http://www.itksnap.org/) to obtain re-gional QSM measurements within the identified lesions. ROIs were traced on QSM and MWF for the whole lesion by using the T2-weighted lesion ROI as a starting point, with additional manual ad-justments if needed. Central veins, identified as vessel-like structures with a hyperintense QSM appearance, were manually removed from QSM ROIs. In addition, for rim⫹lesions, the lesion core (defined as the part of the lesion that extends from the center to the inner bound-ary of the hyperintense QSM rim) was traced on QSM and then transferred to MWF maps and manually edited if necessary. Lesion rim ROI was defined as the ROI difference between the whole lesion and the lesion core.
Statistical Analysis
Mixed-effects models were implemented to assess the variables of interest (lesion QSM and MWF values) among rim⫹and rim⫺ le-sions. The modeling strategy accounts for multiple lesions per patient and repeated measurements (longitudinal analysis), and the follow-ing covariates were always considered: patient age, sex, T2-weighted lesion volume, and time interval between MRIs. The final model is reported after using a back-fitting procedure set at␣⫽0.10 for
in-clusion. The mean QSM and MWF values within the lesion core and rim areas of rim⫹ lesions were compared by a pairedttest.
RESULTS
Identification of QSM Rimⴙand RimⴚLesions
All T2-weighted hyperintense lesions that were present at both time points were reviewed and considered chronic if they were not enhancing with gadolin-ium. Two lesions were excluded because of a subthreshold volume (⬍14 mm3), and 15 lesions were excluded because of image artifacts and poor QSM quality. The remaining lesions included 116 rim⫹lesions from 35 of 46 patients with MS (34 relapsing-remitting and 1 sec-ondary-progressive) and 441 rim⫺ le-sions from 42 of 46 patients with MS (1 clinically isolated syndrome, 40 relaps-ing-remitting, and 1 secondary-progres-sive). Most patients (31 of 46) were found to have both rim⫹and rim⫺ le-sions. Of the patients having 1 lesion subtype, 4 of 15 had only rim⫹lesions and the remaining patients (11 of 15) had only rim⫺lesions. Ten patients had gadolinium-enhancing lesions at any time point (12 lesions). The clinical char-acteristics (ie, disease duration or Ex-panded Disability Status Scale score) be-tween the 2 groups of patients having only 1 lesion subtype were similar. Among all the patients, there was no significant correlation between the number of rim⫹lesions and dis-ease duration (P⫽.43).
Comparison of QSM Rimⴙand RimⴚLesions
Figure 1shows an example of T2-weighted images and corre-sponding QSM from 2 patients with relapsing-remitting MS, il-lustrating the appearance of rim⫹and rim⫺lesions on QSM (4 additional patient examples are shown in On-line Fig 1). For whole lesion ROI, QSM1 of rim⫹lesions and rim⫺lesions were 6.0⫾14.4 parts per billion (ppb) and⫺7.0⫾17.1 ppb, respec-tively (On-line Fig 2). There was no significant difference between the patient age among the rim⫹ and rim⫺ lesion subgroups (44.1⫾10.6 versus 43.5⫾10.7;P⫽ .82), and the Expanded Disability Status Scale score was similar among the lesion subtype groups (P ⫽.80). After accounting for patient variability as a random effect (mixed-effects model), the QSM1 values in rim⫹ lesions were on average 6.8 ppb higher than those in rim⫺lesions (P⬍.001). There was no significant association found with T2-weighted lesion volume, sex, or patient age.
Longitudinal Assessment of QSM Classification
QSM classification at follow-up MR imaging predominantly re-mained the same. All rim⫹lesions retained the hyperintense rim
[image:3.594.55.382.46.390.2]at both time points (QSM1 and QSM2). Three lesions were ini-tially identified as rim⫺at QSM1 and demonstrated a positive hyperintense rim at QSM2. T2 lesion volume remained stable between the 2 longitudinal MR imagings for both rim⫹(P⫽.94) and rim⫺(P⫽.07) lesions. Rim⫹lesions demonstrated an in-crease in whole-lesion QSM (4.8⫾10.3 ppb) over time, with both the core and rim ROI values increasing by 4.0⫾11.6 ppb and 5.3⫾11.0 ppb, respectively. QSM values for rim⫺lesions also increased over time, but with smaller differences (2.3⫾10.8 ppb). A mixed-effects model confirmed a significant change in QSM values within the rim (P⬍.001) and core (P⬍.001) regions of rim⫹lesions.
QSM and MWF Assessment of Lesions
At the second time point, QSM and MWF values within the rim and core regions of rim⫹lesions were examined to support the premise that iron is present at the lesion edge. The volumes of the rim and core area were 271.4⫾200.9 mm3and 116.6⫾113.7 mm3, respec-tively. There was a centripetal pattern of reduction observed in both QSM and MWF. In rim⫹lesions, the mean QSM value significantly decreased from the rim (13.3 ⫾ 16.3 ppb) to the core
(5.9⫾15.2 ppb;P⬍.01;Fig 2). As with QSM, the rim⫹lesions demonstrated a significant decrease of MWF from the rim (0.052⫾0.022) to the core (0.039⫾ 0.022;P⬍.01;Fig 2).
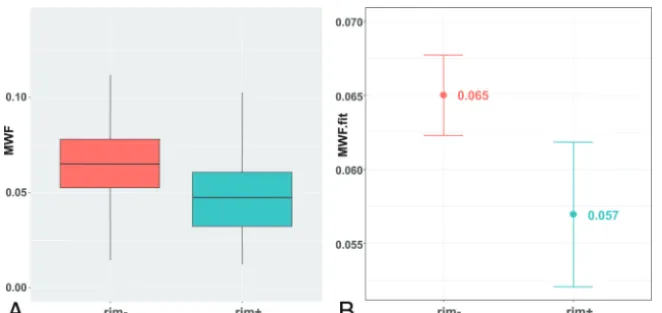
MWF whole-lesion values for rim⫹ lesions were lower compared with rim⫺ lesions (0.055 ⫾ 0.070 and 0.066 ⫾ 0.040, respectively;Fig. 3) and found to be consistently lower with the exclusion of patients with gadolinium-enhancing lesions (0.044 ⫾ 0.021 and 0.068 ⫾ 0.040, respectively; On-line Fig 3). This difference became more obvious in the mixed-effects model, which showed that whole-lesion MWF in rim⫹lesions was on average 0.01 (Fig 3) lower compared with rim⫺(P⬍.001). A similar differ-ence in MWF (0.011; P ⬍ .001) was found with the exclusion of patients with gadolinium-enhancing lesions (On-line Fig 3). T2-weighted lesion volume remained a significant covariate in the final model (P⬍.001). For every cubic millimeter increase in T2-weighted volume, MWF decreased by 0.000013. The MWF differences among rim⫹and rim⫺lesions can be appreciated on the MWF map shown inFig 4. In rim⫹ lesions, we further expanded our analysis to explore the specific relationship of the hyperintense rim at the first time point (sus-ceptibility value and volume on QSM1) and subsequent MWF. In the mixed-effects model, the volume of the rim at QSM1 (P⬍.01) was the only significant covariate; for every cubic millimeter increase in QSM1 rim volume, lesion MWF decreased by 0.00002.Figure 5
highlights the MWF differences between thick rim and thin rim lesions.
DISCUSSION
Our study is one of many demonstrating that GRE MR imaging can identify a discrete subset of chronic MS lesions,1,3,4,7-9and as with other studies, we demonstrate the retention of the iron rim and more tissue damage in these selected lesions. There are 3
FIG 2. Comparison of susceptibility (A) and MWF (B) differences within the rim and core of QSM hyperintense rim⫹lesions. Rim ROIs (green) have significantly higher susceptibility and higher MWF compared with core ROIs (yellow).
[image:4.594.56.530.45.228.2] [image:4.594.54.385.266.422.2]unique components to our study: 1) the application of QSM0 for a more accu-rate identification and quantification of iron rim lesions in a longitudinal study, compared with conventional QSM, SWI, or MR phase; 2) a multitechnique approach of combining QSM with a my-elin-specific MR imaging acquisition (MWF); and 3) quantitatively examin-ing the susceptibility and myelin content within the individual components of QSM hyperintense rim⫹ lesions (rim and core regions). Our work provides further in vivo evidence that GRE MR imaging can identify chronic lesions with more demyelination, which is con-sistent with the known histopathologic classification of a chronic active MS lesion.
QSM studies of MS lesions have un-covered interesting dynamics wherein lesion susceptibility substantially in-creases shortly after gadolinium en-hancement and remains high for the first few years.32,33The susceptibility in-crease in MS lesions can come from de-myelination and/or iron accumula-tion.17 The integrated multitechnique QSM⫹MWF approach described in this study allows for a novel quantitative in-vestigation of the connection between iron-associated inflammation and tissue damage in the brains of patients with MS. Recent patient studies demon-strated increased tissue damage on T1-weighted images for MS lesions with a persistent rim on phase images4and a
FIG 4. T2-weighted (A), QSM (B), and MWF map (C) images of a patient with relapsing-remitting MS are shown. The hypointense appearance of rim⫹ lesions (yellow arrows) on the MWF map is consistent with a lower MWF compared with the more isointense appearance of a rim⫺lesion (red arrow).
[image:5.594.53.531.47.259.2] [image:5.594.67.366.302.656.2]higher occurrence of lesions with a QSM rim in patients with progressive MS and increasing disability.23However, it is difficult to quantify tissue damage on T1-weighted hypointensity. In ad-dition, studies using QSM and R2*described QSM hyperintense rim lesions as having minor myelin loss compared with other lesion subtypes,22which is inconsistent with the histopathologic description of chronic active lesions as having extensive demyeli-nation34; this discrepancy may be the consequence of R2*being influenced by iron. For a quantitative assessment of tissue damage in white matter MS lesions, MWF is regarded as an indirect mea-sure of myelin with a relatively high specificity given the strong pathologic correlation.26-28We recognize that an increase of sus-ceptibility within a chronic lesion can be due to demyelination or iron deposition, which limits direct iron quantification by QSM.17We identify QSM rim⫹lesions as having a rim of iron based upon the susceptibility gradient between the rim and core regions. Support of this approach is based upon 3 factors: 1) a known pattern of demyelination found within chronic active MS lesions (attenuated loss of myelin in core)3,6,12; 2) histologic stud-ies demonstrating that GRE can detect iron within activated mi-croglia and macrophages at the edge of chronic active MS le-sions1,3,4,11,14,15; and 3) our own data, demonstrating a decrease in both susceptibility and MWF from rim to core, which can only be explained by iron deposition. Thus, we conclude that iron is contributing, at least in part, to the signal at the rim, but impor-tantly, we are not quantifying the absolute extent that iron or myelin is contributing to the QSM signal.
This QSM⫹MWF study helps highlight the clinical impor-tance of chronic active lesions, which have been largely ignored in current clinical practice, but may potentially be treated to reduce tissue damage and possibly slow disease progression as suggested by clinical and immunohistologic data. After the acute stage, a significant increase in both QSM and R2*occurs in lesions that are no longer enhancing, yet under 1 year of age, suggesting that iron release occurs during the early stages after myelin destruction.21 These findings are consistent with the release of iron secondary to myelin and oligodendrocyte destruction9,35and provide a source for iron-laden proinflammatory microglia and for iron-driven amplification of oxidative stress within the acute MS lesion.2,36 Studies have shown evidence for oxidative stress damage to oligo-dendrocytes and mitochondrial and dystrophic axons in acute MS lesions,37which consequently inhibit endogenous remyelination. Correspondingly, we found that lesions having a QSM hyperin-tense rim had a significantly lower MWF throughout the whole lesion compared with those identified as without rim. Interest-ingly, we found an association with rim volume and lesion MWF, which is consistent with thicker-rimmed chronic lesions demon-strating more active demyelination.34
Chronic active MS lesions have been found to be more prom-inent in progressive disease compared with the relapsing stage of the disease, and their continued expansion may play an essential role in the pathogenesis of progressive disease.38In vivo imaging studies of phase or QSM have revealed conflicting results regard-ing the prevalence of rim⫹lesions among patients with MS.39 One previous study demonstrated a vast difference among QSM and phase results, wherein the authors concluded that QSM was superior to the depiction of spatial susceptibility patterns in MS
lesions.15Similarly, we found wide-ranging differences in lesion classification based upon QSM versus phase images (data not shown). A major contributing factor to the difficulty of identify-ing and quantifyidentify-ing rim⫹lesions has been the choice of suscep-tibility reference tissue. Wiggerman et al35have recently demon-strated in postmortem samples that lesion phase and QSM contrast can be highly influenced by pathologic alterations in my-elin and iron in normal-appearing white matter, a typical choice of QSM reference in MS lesion studies. CSF being 99% pure water is another common choice of susceptibility reference; however, current QSM reconstruction algorithms often produce a highly inhomogeneous CSF appearance in the brain ventricles, most likely due to the susceptibility anisotropy effect of the adjacent brain white matter. Consequently, the zero reference in previous studies often depends on the manual selection of ROI, making it less suited for longitudinal studies. A unique component of our study was the use of QSM0, a recently developed QSM inversion method that automatically selects a CSF mask based on R2* de-rived from a GRE magnitude image and enforces uniformity within the CSF region. This improvement could lead to better detection and quantification of QSM lesions. Interestingly, the current study population is predominantly relapsing patients with minimal disability and differs significantly from postmortem studies, which generally lack the inclusion of younger patients. Therefore, to determine the true prevalence and incidence of these lesions among patients with MS, future studies will require a consistent imaging protocol, for which we favor QSM0, on a larger cohort of patients that includes both relapsing and progres-sive stages of the disease. In addition, QSM and MWF provides an opportunity to further explore the range of myelin damage of these particular lesions, especially those found in younger MS patients.
stud-ies would be required to properly assess the influence of specific treatments on QSM and MWF. In addition, in a separate analysis, we assessed the potential influence of enhancing lesions and the remote effect of inflammation related to breakdown of the blood-brain barrier. We found that after removing patients with enhanc-ing lesions, a significant difference in MWF remained among rim⫹and rim⫺lesions.
CONCLUSIONS
Our study demonstrated that differences exist among individual lesions based upon the QSM hyperintensity pattern. QSM rim⫹ lesions maintained a hyperintense rim and demonstrated an in-crease in susceptibility over time. Centripetal dein-crease in QSM and MWF identified a subset of MS lesions with excess iron de-position at the rim and more myelin damage. These results raise the possibility that QSM may provide insight into pathologic mechanisms of injury, such as iron release and chronic inflamma-tion, within individual lesions. Furthermore, a hyperintense rim on QSM may provide a biomarker to target and study myelin injury within chronic active MS lesions. Treatments targeting the modulation of chronic CNS inflammation would provide a novel therapeutic strategy to prevent ongoing myelin damage as well as enhance remyelination and decrease disease progression.
Disclosures: Thanh Nguyen—RELATED:Grants/Grants Pending: National Institutes of Health;UNRELATED:Grants/Grants Pending: National Institutes of Health, Na-tional Multiple Sclerosis Society*. Yi Wang—RELATED:Grants/Grants Pending: Na-tional Institutes of Health,Comments: grant R01 NS090464*;UNRELATED:Grants/ Grants Pending: National Institutes of Health,Comments: we are actively seeking National Institutes of Health grants to translate our work into clinical practice*;
Patents (Planned, Pending, or Issued): Cornell University,Comments: I am one of the inventors named on the QSM patents*;Stock/Stock Options: Medimagemetric,
Comments: Medimagemetric is working with Cornell to commercialize QSM tech-nology. Susan Gauthier—RELATED:Grants/Grants Pending: National Institutes of Health,Comments: grant R01NS090464, focused on multiple sclerosis lesion mag-netic susceptibility activity*; UNRELATED:Grants/Grants Pending: Genzyme*, Mallinckrodt*, Novartis*. *Money paid to the institution.
REFERENCES
1. Bagnato F, Hametner S, Yao B, et al.Tracking iron in multiple sclerosis: a combined imaging and histopathological study at 7 Te-sla.Brain2011;134:3602–15CrossRef Medline
2. Stephenson E, Nathoo N, Mahjoub Y, et al.Iron in multiple sclerosis: roles in neurodegeneration and repair.Nat Rev Neurol2014;10: 459 – 68CrossRef Medline
3. Dal-Bianco A, Grabner G, Kronnerwetter C, et al.Slow expansion of multiple sclerosis iron rim lesions: pathology and 7 T magnetic resonance imaging. Acta Neuropathol 2017;133:25– 42 CrossRef Medline
4. Absinta M, Sati P, Schindler M, et al.Persistent 7-Tesla phase rim predicts poor outcome in new multiple sclerosis patient lesions.
J Clin Invest2016;126:2597– 609CrossRef Medline
5. Cairo G, Recalcati S, Mantovani A, et al.Iron trafficking and metab-olism in macrophages: contribution to the polarized phenotype.
Trends Immunol2011;32:241– 47CrossRef Medline
6. Langkammer C, Schweser F, Krebs N, et al.Quantitative susceptibil-ity mapping (QSM) as a means to measure brain iron? A post mor-tem validation study. Neuroimage 2012;62:1593–99 CrossRef Medline
7. Hammond KE, Metcalf M, Carvajal L, et al.Quantitative in vivo magnetic resonance imaging of multiple sclerosis at 7 Tesla with sensitivity to iron.Ann Neurol2008;64:707–13CrossRef Medline
8. Yao B, Ikonomidou VN, Cantor FK, et al.Heterogeneity of multiple
sclerosis white matter lesions detected with T2*-weighted imaging at 7.0 Tesla.J Neuroimaging2015;25:799 – 806CrossRef Medline
9. Mehta V, Pei W, Yang G, et al.Iron is a sensitive biomarker for inflammation in multiple sclerosis lesions.PLoS One2013;8:e57573
CrossRef Medline
10. Haacke EM, Makki M, Ge Y, et al.Characterizing iron deposition in multiple sclerosis lesions using susceptibility weighted imaging.J Magn Reson Imaging2009;29:537– 44CrossRef Medline
11. Langkammer C, Krebs N, Goessler W, et al.Quantitative MR imag-ing of brain iron: a postmortem validation study.Radiology2010; 257:455– 62CrossRef Medline
12. Li J, Chang S, Liu T, et al.Reducing the object orientation depen-dence of susceptibility effects in gradient echo MRI through quan-titative susceptibility mapping.Magn Reson Med2012;68:1563– 69
CrossRef Medline
13. Hopp K, Popescu BF, McCrea RP, et al.Brain iron detected by SWI high pass filtered phase calibrated with synchrotron X-ray fluores-cence.J Magn Reson Imaging2010;31:1346 –54CrossRef Medline
14. Wiggermann V, Hametner S, Hernandez-Torres E, et al. Susceptibil-ity-sensitive MRI of multiple sclerosis lesions and the impact of normal-appearing white matter changes. NMR Biomed 2017;30
CrossRef Medline
15. Eskreis-Winkler S, Deh K, Gupta A, et al.Multiple sclerosis lesion geometry in quantitative susceptibility mapping (QSM) and phase imaging.J Magn Reson Imaging2015;42:224 –29CrossRef Medline
16. Wang Y, Liu T.Quantitative susceptibility mapping (QSM): decod-ing MRI data for a tissue magnetic biomarker.Magn Reson Med 2015;73:82–101CrossRef Medline
17. Wisnieff C, Ramanan S, Olesik J, et al.Quantitative susceptibility mapping (QSM) of white matter multiple sclerosis lesions: inter-preting positive susceptibility and the presence of iron.Magn Reson Med2015;74:564 –70CrossRef Medline
18. Stuber C, Pitt D, Wang Y.Iron in multiple sclerosis and its nonin-vasive imaging with quantitative susceptibility mapping.Int J Mol Sci2016;17:E100CrossRef Medline
19. Deistung A, Scha¨fer A, Schweser F, et al.Toward in vivo histology: a comparison of quantitative susceptibility mapping (QSM) with magnitude-, phase-, and R2*-imaging at ultra-high magnetic field strength.Neuroimage2013;65:299 –314CrossRef Medline
20. Langkammer C, Liu T, Khalil M, et al.Quantitative susceptibility mapping in multiple sclerosis.Radiology2013;267:551–59CrossRef Medline
21. Zhang Y, Gauthier SA, Gupta A, et al.Quantitative susceptibility mapping and R2* measured changes during white matter lesion development in multiple sclerosis: myelin breakdown, myelin de-bris degradation and removal, and iron accumulation.AJNR Am J Neuroradiol2016;37:1629 –35CrossRef Medline
22. Li X, Harrison DM, Liu H, et al.Magnetic susceptibility contrast variations in multiple sclerosis lesions.J Magn Reson Imaging2016; 43:463–73CrossRef Medline
23. Harrison DM, Li X, Liu H, et al.Lesion heterogeneity on high-field susceptibility MRI is associated with multiple sclerosis severity.
AJNR Am J Neuroradiol2016;37:1447–53CrossRef Medline
24. Nguyen TD, Wisnieff C, Cooper MA, et al.T2 prep three-dimen-sional spiral imaging with efficient whole brain coverage for myelin water quantification at 1.5 Tesla.Magn Reson Med2012;67:614 –21
CrossRef Medline
25. Nguyen TD, Deh K, Monohan E, et al.Feasibility and reproducibil-ity of whole brain myelin water mapping in 4 minutes using fast acquisition with spiral trajectory and adiabatic T2prep (FAST-T2) at 3T.Magn Reson Med2016;76:456 – 65CrossRef Medline
26. Laule C, Kozlowski P, Leung E, et al.Myelin water imaging of mul-tiple sclerosis at 7 T: correlations with histopathology.Neuroimage 2008;40:1575– 80CrossRef Medline
27. McCreary CR, Bjarnason TA, Skihar V, et al.Multiexponential T2 and magnetization transfer MRI of demyelination and remyelination in murine spinal cord.Neuroimage2009;45:1173– 82CrossRef Medline
myelin water fraction in new multiple sclerosis lesions.Neuroimage Clin2015;9:369 –75CrossRef Medline
29. de Rochefort L, Liu T, Kressler B, et al.Quantitative susceptibility map reconstruction from MR phase data using Bayesian regularization: validation and application to brain imaging.Magn Reson Med2010;63:194 –206CrossRef Medline
30. Liu J, Liu T, de Rochefort L, et al.Morphology enabled dipole inver-sion for quantitative susceptibility mapping using structural con-sistency between the magnitude image and the susceptibility map.
Neuroimage2012;59:2560 – 68CrossRef Medline
31. Jenkinson M, Bannister P, Brady M, et al.Improved optimization for the robust and accurate linear registration and motion correction of brain images.Neuromage2002;17:825– 41CrossRef Medline
32. Chen W, Gauthier SA, Gupta A, et al.Quantitative susceptibility mapping of multiple sclerosis lesions at various ages.Radiology 2014;271:183–92CrossRef Medline
33. Zhang Y, Gauthier SA, Gupta A, et al.Longitudinal change in mag-netic susceptibility of new enhanced multiple sclerosis (MS) lesions measured on serial quantitative susceptibility mapping (QSM).J Magn Reson Imaging2016;44:426 –32CrossRef Medline
34. Kuhlmann T, Ludwin S, Prat A, et al.An updated histological clas-sification system for multiple sclerosis lesions.Acta Neuropathol 2017;133:13–24CrossRef Medline
35. Wiggermann V, Herna´ndez Torres E, Vavasour IM, et al.Magnetic resonance frequency shifts during acute MS lesion formation. Neu-rology2013;81:211–18CrossRef Medline
36. Haider L.Inflammation, iron, energy failure, and oxidative stress in the pathogenesis of multiple sclerosis.Oxid Med Cell Longev2015; 2015:725370CrossRef Medline
37. Haider L, Fischer MT, Frischer JM, et al.Oxidative damage in multiple sclerosis lesions. Brain 2011;134:1914 –24 CrossRef Medline
38. Prineas JW, Kwon EE, Cho ES, et al.Immunopathology of second-ary-progressive multiple sclerosis. Ann Neurol 2001;50:646 –57
CrossRef Medline