THALES
The transition from operational
availability to mission
availability
Case study
Unclassified
Author Supervisors
J.L. Schmal Ir. R. Ypma, Thales
Dr. M.C. van der Heijden, University of Twente Dr. A. Al Hanbali, University of Twente
J.L. Schmal The transition from operational availability to mission availability Case Study I
Preface
The results of my graduation period at Thales Netherlands in Hengelo at the department ILS competence center are presented in this Master of Science thesis. The Master of Science thesis has been performed during the period September 2013 and May 2014.
I conducted an extension on a baseline study in the first three months to get an overview of the maintenance and logistics at Thales Nederland. The baseline study is the basis of my Master of Science thesis (Heida & Schmal, 2014). Some parts are cannibalized from this study for this research.
This Master of Science thesis was an informative assignment. I learned a lot during my graduation period. The logistic support environment was a new experience to me. Thanks to Thales I learned a lot from this industry. I consider this graduation as a valuable experience.
I am thankful to Thales Netherlands for giving me the opportunity to graduate for my Master of Science thesis. With this opportunity I could graduate with my study Industrial Engineering and Management with as specialization track: Production and Logistics. I would like to take this opportunity to thank the following people. Firstly, I would like to thank Rindert Ypma for his time to help and support me during my graduation period. I could perform this Master of Science thesis thanks to Rindert Ypma. Secondly, I would like to thank Mathieu Pivaut, who was my supervisor at Thales Nederland in the first three months. I would like to thank him for his time and effort to help me with my baseline study. I would also like to thank my colleagues at the department ILS competence center for the pleasant work environment. Thirdly, I would like to thank my supervisors Matthieu van der Heijden and Ahmad Al Hanbali of the University of Twente. They spend a lot of time reading and giving extensive feedback on my draft versions of my Master of Science thesis. I would also thank them for the general feedback during my graduation period.
Finally, I would like to thank my family and friends for supporting me during my graduation period. Jaco Schmal
II Case Study The transition from operational availability to mission availability J.L. Schmal
Management summary
Thales is planning to deliver systems with a Performance Based Logistic contract. Thales is responsible for the whole maintenance process against a fixed fee. The key performance indicator is the mission availability per ship over a certain time period. The mission availability is defined as the system uptime during the mission divided by the mission time (mission uptime + mission downtime). The downtime is measured by the supply availability. Within a performance based logistic contract, Thales will receive financial penalties when the mission availability drops below the agreed mission availability target. Thales receives a financial bonus when the system performed as agreed. It is of great importance for Thales to determine what the effects are of a performance based contract. Thales performed several studies to estimate the effects and costs of a performance based logistic contract. This research focuses on the transition from the key performance indicator ‘supply availability’ to the mission availability. The objective of this research is to find an optimal spare parts allocation procedure for the antenna of the Smart-L ELR case. An optimal spare parts procedure involves minimizing the cost with as constraint a minimum mission availability target. Simultaneously it should take into account the mission’s length, annual operational hours, repair lead-time, of the multi-indenture antenna. In addition Thales prefers an spare parts allocation procedure which is “robust”. The solution of the optimized procedure are as less sensitive as possible for variations of the Mean Time Between Failure. In that case the solution may have slightly higher cost. With this objective the main research question is formulated:
What is the optimal spare parts allocation procedure of the antenna of the Smart-L ELR to ensure that the minimum mission availability constraint is satisfied, the cost are minimized, considering mission profiles, annual operational hours, and repair lead-time?
In this research there are four allocation procedures constructed, whereby the transfer point from Inventri to Simlox is different per procedure. The second procedure uses two types of ships, namely a mission ship and a mission ship. A mission ship goes on mission for several months and the short-mission ships will perform multiple short short-missions per year. The second procedure calculates the supply availability of the mission ships and the short-mission ships separately by Inventri. The mission ship allocation is combined with the ship spare parts of the short-mission ship allocations. Subsequently, Simlox is used to allocate the spare parts following a single-site METRIC allocation process, whereby the ships together are considered as single-site. Procedure 3 calculates the spare parts allocation to a supply availability level of 99.99% with Inventri. Afterwards checks the allocation list when the short-mission ship is allocated too. The spare parts allocation list, until the short-mission ship is allocated, is implemented in Simlox. Subsequently, Simlox is used to allocate the spare parts following a single-site METRIC allocation process, whereby the ships together are considered as single-site.
The case study consists of a 3-echelon, multi-indenture supply network with three ships, one shore stock location and one original equipment manufacturer (Thales).
From this case study, we can conclude:
The third procedure generates higher mission availability solutions which are less sensitive to MTBF variations, but costs slightly more
J.L. Schmal The transition from operational availability to mission availability Case Study III MTBF variations, regardless it has slightly higher costs. The third procedure can cope for this case at least to 12.5% lower Smart-L antenna MTBF values, but costs maximal 11% more.
Procedure 2 generates overall the most cost-effective solutions
Procedure 2 generates overall the most cost-effective solutions. Compared to procedure 3 this is a more labor-intensive procedure (more iterations), but generates cheaper solutions.
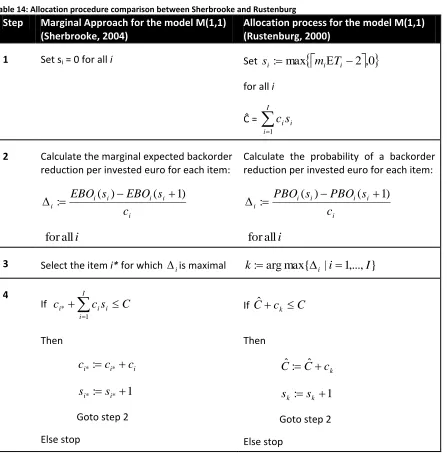
The probability of backorders reduction is made plausible linearly proportional to the mission availability addition.
It is made plausible that the delta probability of backorders (PBO) is linearly proportional to the delta mission availability. This is made plausible for a 3-echelon structure whereby in all the stock locations the delta EBO is made plausible to be linearly proportional to the delta mission availability. This results in that the choices of the VARI-METRIC model can be used to allocate the spare parts.
The reduction of the repair lead-time can reduce the initial spare parts cost in this case with 39.76%, but it can only be realized by stocking component spare parts.
The largest total initial spare parts cost is achievable by reducing the repair lead-time. The reduction of the repair lead-time is only allowable when Thales stocks components as spare parts. The component spare parts cost is much lower than the Line Replaceable Unit (LRU) spare parts. The maximal initial spare parts cost reduction is for a steady state model in this Smart-L case 39.76%.
The reduction of the shipment cycle time reduces the initial spare parts costs, in this case 28.13%.
The one month shipment cycle time and two months shipment cycle time is studied and how it influences the initial spare parts costs. The total initial spare parts cost is higher for the shipment time of two months than the total initial spare parts cost of one month. The initial spare parts costs reduction is in this Smart-L case 28.13%.
The following recommendation can be presented based on this case study:
Use the third procedure to allocate the spare parts for requested minimum mission availability target, because it generates in general higher mission availability solutions which are less sensitive to MTBF variations
This procedure, which generates a solution with slightly higher costs, can cope better with the MTBF variations due to higher average mission availability solutions. Therefore the recommendation is to use the third procedure for allocating the spare parts to stock locations.
Reduce the repair lead-time, because it reduces the initial spare parts costs
In the systems of Thales there are a lot of printed circuit boards. These printed circuit boards are designed to be an LRU. In a PBL contract environment the inventory costs are at the expense of Thales. The recommendation is that costs can be saved by reducing the repair lead-time in a PBL contract environment. Reducing the repair lead-time can only be realized by stocking components as spare parts.
Reduce the shipment time between customer’s site and the ships from two months to one month
IV Case Study The transition from operational availability to mission availability J.L. Schmal
Table of Contents
Preface ... I
Management summary ... II
List of figures ... VI
List of tables ... VII
List of abbreviations... VIII
1 Thales ... 1
1.1 History ... 1
1.2 Internal organization ... 2
1.3 Market of Thales ... 4
1.4 Smart-L ... 6
2 Research design ... 8
2.1 Core problem ... 8
2.2 Research objective ... 10
2.3 Research approach ... 11
2.4 Deliverables ... 12
2.5 Research outline/plan ... 12
3 Service of the antenna ... 13
3.1 Performance Based Logistic contract ... 13
3.2 Service supply chain ... 14
3.3 Repair of the Smart-L ELR ... 20
3.4 Spare parts repair ... 21
3.5 Conclusion ... 23
4 Literature ... 24
4.1 Multi-Echelon Technique for Recoverable Inventory Control (METRIC) ... 24
4.2 VARI-METRIC ... 30
4.3 Depot repair ... 32
4.4 Conclusion ... 33
5 Steady state spare parts allocation (Inventri) ... 35
5.1 Initial component spare part cost per repair lead-time ... 36
5.2 LRU inventory in the supply chain ... 37
5.3 Conclusion ... 40
6 Transition procedure from Inventri to Simlox ... 42
6.1 Differences between Inventri and Simlox ... 42
6.2 Operational availability versus mission availability ... 43
6.3 Could the allocation procedure of METRIC be used? ... 46
6.4 Transition procedures ... 51
J.L. Schmal The transition from operational availability to mission availability Case Study V
7 Transition procedure evaluation ... 60
7.1 Procedure results evaluation ... 60
7.2 Procedure evaluation by variation of the MTBF ... 64
7.3 Conclusions ... 67
8 Conclusion & recommendations ... 68
8.1 Conclusions ... 68
8.2 Recommendations ... 70
8.3 Research limitations ... 71
8.4 Further research ... 71
Reference ... 73
Appendix ... 74
A. Antenna breakdown ... 75
B. Schedule to repair ... 76
C. VARI-METRIC formulas ... 77
D. Repair process for the LRUs ... 81
E. Initial component spare part costs (Inventri) ... 82
F. Derivation of Inventri correction ... 84
G. Mission deployment variations ... 85
H. Derivation delta availability is linearly proportional to delta EBO ... 86
I. Spare part stock variations on the ships ... 87
J. Spare part stock variations at the customer’s site ... 88
K. Spare part stock variations at Thales ... 89
L. Proof delta EBO single-site ... 90
VI Case Study The transition from operational availability to mission availability J.L. Schmal
List of figures
Figure 1: Major industries Thales Nederland ... 2
Figure 2: Organizational structure Naval Systems ... 2
Figure 3: Organizational structure Sensors ... 3
Figure 4: Worldwide presence ... 4
Figure 5: Short to long range radars ... 5
Figure 6: Smart-L system structure ... 7
Figure 7: Product scope's breakdown ... 8
Figure 8: Service supply chain for a traditional service contract ... 15
Figure 9: Service supply chain in terms performance based logistic contract ... 16
Figure 10: Case service supply chain in terms performance based logistic contract ... 19
Figure 11: The accessibility of Smart-L ELR above deck ... 20
Figure 12: Repair Throughput Time (Donderwinkel, 2005) ... 22
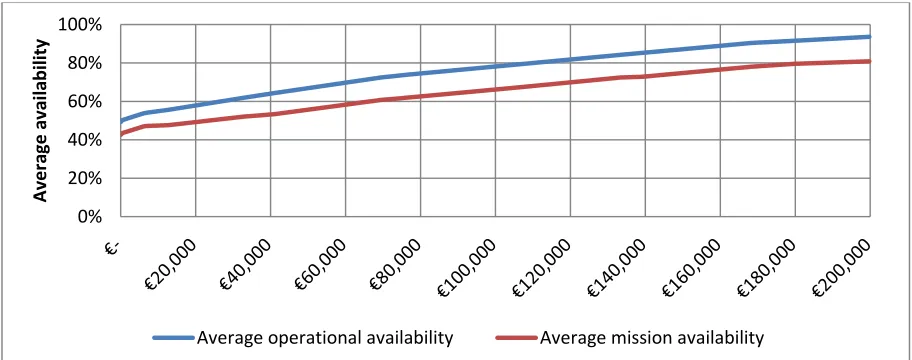
Figure 13: Cost-Availability curve efficient frontier ... 24
Figure 14: Steady state single-site, multi-indenture model ... 31
Figure 15: Demand formulas per location per indenture (Sherbrooke, 2004) ... 32
Figure 16: Division of the repair lead-time ... 35
Figure 17: LRU total cost per shipment to ships (VARI-METRIC) ... 38
Figure 18: Mission availability differences per ship ... 44
Figure 19: Differences in average mission availability ... 45
Figure 20: Difference between operational availability and mission availability ... 45
Figure 21: Example measurement 4 months mission availability in respect to operational availability ... 46
Figure 22: Linear proportionality is simulated at the ships scenario ... 47
Figure 23: Linear comparison of delta PBO and delta mission availabilities per ship ... 48
Figure 24: Linear proportionality is simulated at customer’s site scenario 1 ... 49
Figure 25: Linear proportionality is simulated at customer’s site scenario 2 ... 49
Figure 26: Summation of delta PBO and delta mission availability over the ships when spare parts are added at customer's site ... 49
Figure 27: Summation of delta PBO and delta mission availability over the ships when spare parts are added at Thales ... 50
Figure 28: Procedure 1 Cost/Availability curve ... 54
Figure 29: Supply chain of the short-mission ship model of Inventri ... 54
Figure 30: Supply chain of the mission ship model of Inventri ... 54
Figure 31: Procedure 2 Cost/Availability curve ... 56
Figure 32: Procedure 3 Cost/Availability curve ... 58
Figure 33: Procedure VARI-METRIC choices Cost/Availability curve ... 59
Figure 34: Typical differences among procedures in respect to MTBF variation ... 64
Figure 35: MTBF variation among scenarios in procedure 1 ... 65
Figure 36: MTBF variation among scenarios in procedure 2 ... 65
Figure 37: MTBF variation among scenarios in procedure 3 ... 66
Figure 38: MTBF variation among scenarios in procedure VARI-METRIC choices ... 66
Figure 39: Standard repair lead-time LRU 1 ... 81
Figure 40: Standard repair lead-time LRU 2 ... 81
Figure 41: Standard repair lead-time LRU 3 ... 81
J.L. Schmal The transition from operational availability to mission availability Case Study VII
List of tables
Table 1: Top five most sold systems ... 6
Table 2: Amount of systems sold per continent ... 6
Table 3: Specifications Smart-L (Data Sheet Thales Smart-L, 2012) ... 7
Table 4: Specifications of the ship type ... 18
Table 5: Operational hours per year, per ship ... 18
Table 6: Determination of the additional five days ... 19
Table 7: Pros & cons between the repair processes ... 22
Table 8: Explanation of variables for the supply availability ... 26
Table 9: Explanation of variable for the non-linear programming problem Sherbrooke ... 27
Table 10: Comparison of non-linear programming problem between Sherbrooke and Rustenburg ... 27
Table 11: Explanation of variable for difference between EBO and PBO ... 28
Table 12: The difference between EBO and PBO ... 28
Table 13: Item availability comparison between Sherbrooke and Rustenburg ... 28
Table 14: Allocation procedure comparison between Sherbrooke and Rustenburg ... 29
Table 15: Explanation of variables for the allocation procedures ... 30
Table 16: Four types of distributions related to Vx and E[X] (Rustenburg, 2000, p. 58) ... 30
Table 17: Explanation of variables for the calculation of the depot repair probability ... 33
Table 18: Total cost of components per repair lead-time ... 37
Table 19: Total cost for 20 days return shipment time ... 39
Table 20: Total cost for 35 days return shipment time ... 39
Table 21: Variable setting which will be studied more in depth ... 40
Table 22: Explanation of variable for availability per base and the delta PBO proposition ... 47
Table 23: Explanation of variable for the derivation of delta ... 51
Table 24: Allocation procedure 1 ... 53
Table 25: Allocation procedure 2 ... 55
Table 26: Allocation procedure 3 ... 57
Table 27: Costs difference between best solution and procedure 1 and 2 ... 61
Table 28: Criteria results of each procedure per scenario ... 63
Table 29: New target in respect of MTBF variation ... 65
VIII Case Study The transition from operational availability to mission availability J.L. Schmal
List of abbreviations
AAW Anti Air Warfare
ACE Advanced Centre for Electronics AOH Annual operational hours ASuW Anti Surface Warfare B2G Business to Government BIT Built In Test
CMMS Computerized Maintenance Management System COTS Commercial Off-The-Shelf
CSS Customer Service Support DFM Design For Maintenance EBO Expected backorders ELR Extended Long Range EWC Early Warning Capability ILS Integrated Logistic Support
IVVQ Integration, Verification, Validation and Qualification KPI Key Performance Indicator
LRU Line Replaceable Unit
MaSeLMa Integrated maintenance and service logistics concept for maritime and offshore
MDT Mean Down Time
METRIC Multi-Echelon Technique for Recoverable Inventory Control
MSD Mean Supply Delay
MTBF Mean Time Between Failure MTBM Mean Time Between Maintenance MTTR Mean Time To Repair
OEM Original Equipment Manufacturer PBL Performance Based Logistics PBO Probability of backorders PCB Printed Circuit Board PNBO Probability of no backorders PPM Product Portfolio Management SCC Software Competence Centre
J.L. Schmal The transition from operational availability to mission availability Case Study 1
1
Thales
This chapter introduces Thales (Thales Group). The company is responsible for the production of the Smart-L radar system and Smart-L ELR radar system.
Thales Nederland B.V. was established in 1922 under the name of “NV Hazemeyer’s fabriek voor signaalapparaturen” in the city of Hengelo, since then the company has been known as: Hollandse Signaalapparaten, Thomson CSF signal and since 2000 Thales Nederland. The main expertise of Thales Nederland has been the development of fire control, radar systems and combat management for navies around the world. Thales Nederland is an expert in the field of radar technology, it produces radars as well as complete combat systems including radars. Thales Nederland is the original equipment manufacturer (OEM) and supplies initial products as well as spare parts and offers repairs for their products. A more detailed history description is discussed in paragraph 1.1, the internal organization of Thales in paragraph 1.2, the market wherein Thales performs in paragraph 1.3 and the system Smart-L in paragraph 1.4.
1.1
History
Hazemeyer started the company to produce fire control equipment for the Hr.Ms. Sumatra and Hr.Ms. Java ships of the Royal Netherlands Navy. Thereafter the company grew rapidly and started to supply to foreign navies like Sweden, Spain and Greece. In 1940 the German army captured the factory. Fortunately, a great part of the staff was able to escape to the United Kingdom and continued their work on radar and fire control systems in the UK. After the war the staff returned to find the factory deserted and pillaged. The Dutch government bought the factory in 1945 to establish a good defence industry, the company name changed to N.V. Hollandse Signaalapparten. With new facilities and staff a rapid development in radar and fire control for the army as well as computer and air traffic equipment was established. Philips bought a large part of the shares in 1956 and becoming main shareholder. The company kept growing and expended across several cities in the Netherlands. At the end of the eighties 5000 people were employed serving customers over 35 countries. The end of the Cold War changed the political view of governments and companies, high defence budgets were no longer needed. Philips discarded defence and control systems as part of its core business. In 1990 the already reorganised Hollandse Signaalapparaten was taken over by Thomson-CSF. The reorganisation and fusion of the company brought a change in the company’s vision; from now on new systems were designed targeting defence equipment and combat management. In 2000 Thomson-CSF changed its name to Thales to carry out a clear corporate structure.
The originally French Thales Group is a global technology leader for defence & security and aerospace & transport markets. In 2011 Thales was located in 56 countries and employed 67000 people of whom 22500 were engineers and researchers. From the generated revenues in 2011 (12.9 billion euros) 20% was invested in research and development, giving Thales the unique possibility to design, develop and deploy systems and services which are highly complex. Nowadays the Thales Group has three core businesses: Defence, Aerospace & Space and Security.
2 Case Study The transition from operational availability to mission availability J.L. Schmal
1.2
Internal organization
Thales Nederland is divided in three industries (Figure 1).
Figure 1: Major industries Thales Nederland
Land defense and C4l transportation systems
The development of land defence and transportation products and systems is executed by this industry. Products of the land defence department are the Sotas vehicle system (a navigation and communication system suitable for all vehicle types in missions) and the Squire (a hard to detect portable radar). A non-related, but notable product that the transportation department also developed is the OV-chipcard reader for the Dutch Railways (NS).
Naval systems
The support and development of naval product, except the physical hardware, is executed by this industry. Software development, logistics, support, acquisition, communication, etc. are accomplished by the departments of this industry.
Sensors
Development, production and maintenance of the hardware of the naval product takes place in this industry. Furthermore, this industry is responsible for the design, testing, production a repair of the physical products. The naval system and the sensor industry departments are responsible for the repairs, therefore these departments are further described. In Figure 2 the organization structure of the Naval Systems industry is shown.
Figure 2: Organizational structure Naval Systems
J.L. Schmal The transition from operational availability to mission availability Case Study 3 responsibilities of the departments is given. The department of customer service support is described in detail for a better insight.
Product Portfolio Management (PPM): Develops new products
Software Competence Centre (SCC): Develops software that controls the radar system Naval mission solutions: Combines software and hardware to a working system
Customer Service Support (CSS): Develops and provides services and support for the radar systems.
o Service development: Responsible for the development of new service, maintenance and logistic concepts based on customer demands.
o Service delivery: Responsible for the service during the use phase. (helpdesk support, sending expert engineers/spare parts)
o Capturing: Responsible for the sales of radars to customers Bid support: Supports capturing
o Integrated Logistic Support (ILS) competence centre: Responsible for the theoretical maintenance (Design For Maintenance (DFM)) and logistic design for the radar systems.
ILS Delivery centre: Responsible for documentation and training which are necessary to use the radar systems
Figure 3: Organizational structure Sensors
Figure 3 shows the organizational structure of the Sensors industry. Below a short description of the activities and responsibilities of the departments is given. For insight the department is described in detail.
Radar engineering & integration: Responsible for the specifications of the hardware Radar delivery: Responsible for the assembly of the product
o Final assembly: Responsible for assembling all sub-systems into the final product o Logistics: Responsible for the logistics in the whole product chain. From
documentation to orders for the demanded parts, to the delivery of all sub-systems to final assembly.
o Purchasing: Responsible for purchasing modules of the sub-systems from external suppliers and for purchasing components and parts for Thales production department.
4 Case Study The transition from operational availability to mission availability J.L. Schmal o Test & integration: Responsible for the integration, verification, validation and
qualification (IVVQ) of the products. Parts are examined and tested in this department.
o Industrialisation: Responsible for the preparation of the system after the prototype is operational and before selling the product on the market.
o Advanced Centre for Electronics (ACE): Responsible for the assembly of components on the PCBs into a working electrical product.
Portfolio & products: Responsible for the development of new products
BU Naval radar: Responsible for bringing in new orders from (potential) customers.
Quality department sensors: Independent department responsible for the quality control of the whole product chain from documentation to the final product.
1.3
Market of Thales
[image:14.612.83.428.339.560.2]Thales has customers in over 55 countries. The company sells their products to the agencies of governments or directly to the governments and therefore performs in a Business-to-Government (B2G) market. Figure 4 shows Thales’ worldwide presence; showing the number of employees per country.
Figure 4: Worldwide presence
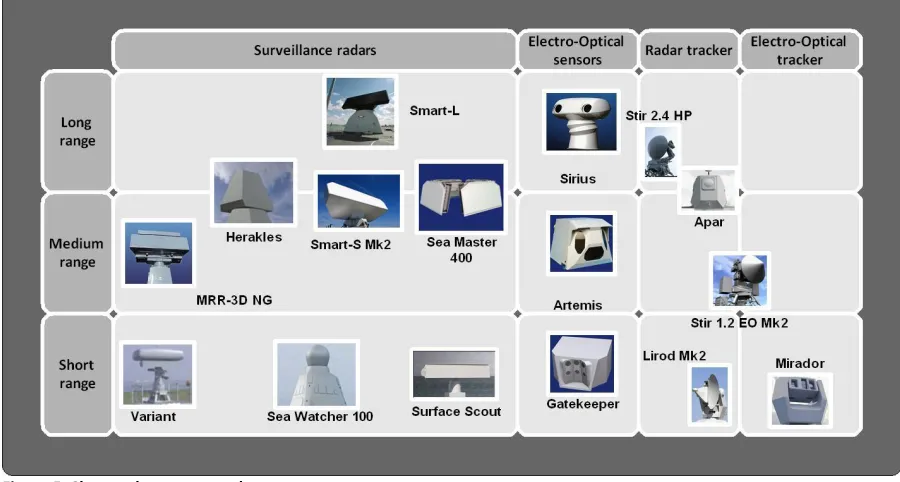
J.L. Schmal The transition from operational availability to mission availability Case Study 5 Figure 5: Short to long range radars
The latest innovation of Thales is the integrated mast family namely the I-Mast. The I-Mast is an all-in-one radar mast, which contains all the major radars, sensors and antennas for a naval ship. There are four types of I-mast: the I-mast 50, I-mast 100, I-mast 400 and the I-mast 500. Each I-mast is intended for a different class of naval vessels.
Using the classic radar equation (Wolff) the range of a radar can be determined, due to the 4th power in the equation; doubling the range a 16 times higher transmitted power is necessary. The radio power of a long range radar like the Smart-L increases rapidly when extending the range. The equation of Wolff is as followed:
2 2 2 4
)
4
(
*
*
*
*
E s
P
G
P
R
R = range [m]
Ps= transmitted power [W] PE = received power [W]
G = antenna gain [antenna's directivity and electrical efficiency] λ = wavelength [m]
σ = Antenna cross section [m2]
Thales sold in 2013 over 1300 systems. These systems are installed all over the world. Table 2 provides an overview on the number of systems in each continent. Most systems are installed in Europe. The Netherlands has a 5.62% share of the systems. In Table 1 presents the top five most sold system types.
6 Case Study The transition from operational availability to mission availability J.L. Schmal Table 1: Top five most sold systems Table 2: Amount of systems sold per continent
Amount of systems sold
Percentage of systems sold
STIR 180 Base, I/K, 180/240 HP 150 10.96%
TACTICOS 143 10.45%
WM 22 - 28 122 8.91%
SCOUT-Mk1 113 8.25%
LW08 66 4.82%
Amount of systems sold worldwide
Percentage of systems sold worldwide
Europe 630 46.02%
Asia 364 26.59%
South-America 161 11.76%
Africa 140 10.23%
North-America 72 5.26%
Australia 2 0.15%
Grand Total 1369 100.00%
Stir
The Stir is a tracker for gun and missile fire control. The Stir has a long range to track the airborne missile. This radar guides the Semi Active Homing missiles to their targets.
Tacticos
Tacticos is a combat management system which combines the combat operations and the maritime security operations. The system controls the ship’s radars and provides onboard missile guidance. Tacticos is also implemented with multiple mission profiles for a variety of ship types.
WM 22 – 28
The WM surveillance and tracking radar is an ancestor of the I-Mast. The WM family is over 40 years old. This system could surveillance and track missiles in the air. The last WM system is sold in 1990 and is only updated and supported by Thales.
Scout – MK1
The scout is a stand-alone mobile system which could also be operated remotely. This radar performs at a short-to-medium range. The Scout is a fully solid-state system with high reliability, low weight and small dimensions.
LW08
The LW08 is high-power radar which is designed for long-range surveillance and target indication for weapon control systems.
1.4
Smart-L
J.L. Schmal The transition from operational availability to mission availability Case Study 7 customer’s wishes; all are Smart-L systems but every single one is uniquely tuned. In Table 3, general specifications of the Smart-L are presented.
Table 3: Specifications Smart-L (Data Sheet Thales Smart-L, 2012)
General specification Smart-L
Dimensions 8.4 x 4 x 4.4 [m]
Weight 7800 [kg]
Antenna Rotations 12 [rpm]
Frequency 110-170 [GHz] (D-band), former 0.5 – 1.55 [GHz] (L-band)
Range (air) 400 [km]
Range (surface) 60 [km]
Elevation coverage 0-70 [°]
Capacity (air) >1000 [tracks]
Capacity (surface) >100 [tracks]
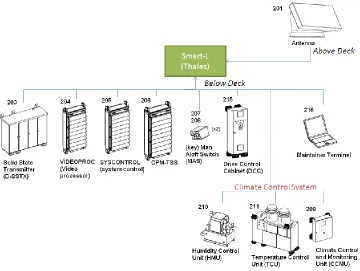
The Smart-L radar system contains 11 sub-systems, as can be seen in Figure 6. The Antenna is the only sub-system above deck and contains the bearing and the rotary joint unit, which are the main dynamic parts of the system. Below deck the other 10 sub-systems are located, these systems control and monitor the radar and mainly consist of electrical and electronic parts.
Figure 6: Smart-L system structure
8 Case Study The transition from operational availability to mission availability J.L. Schmal
2
Research design
Currently, Thales is developing a redesign of the Smart-L. This redesign (Smart-L ELR) contributes to the logistics of the availability contract: Performance Based Logistic (PBL) contract. This chapter will provide an outline for the research. In paragraph 2.1 the core problem will be discussed by giving a description about the Smart-L ELR antenna and the key performance indicator: availability. In paragraph 2.2 the research objectives will be defined with the research questions. In paragraph 2.3 the research approach is stated. In paragraph 2.4 the deliverables to Thales are explained and finally in paragraph 2.5 the research outline/plan is provided.
2.1
Core problem
Currently there is a service request shift from the traditional service contract to a Performance Based Logistic (PBL) contract. This means that the responsibility of the maintenance will shift from the customer to Thales. This changing customer demand lies at the root of this research. Thales must guarantee the system’s availability to the customer by delivering the demanded service shift. Thales is currently redeveloping a system (Smart-L ELR) whereby this kind of service could be provided. This research will focus on the Smart-L ELR antenna. The scope of the product is defined in section 2.1.1 and the availability of the system in chapter 2.1.2.
2.1.1
Smart-L ELR antenna
The antenna system of the Smart-L ELR consists of five levels of parts. Each level consists of one or more parts. The first level is the antenna which will be referred to as the system in this research. The second level in the antenna is building blocks, which are virtual parts. In reality these are spaces on the antenna which consist of parts. The repair of the building blocks has to be conducted by replacement of Line Replaceable Units (LRUs). The third level is then subsequently the LRU level. This level consists of the parts which could be exchanged onboard the ship during missions to repair the antenna. The fourth level is the Shop Replaceable Units (SRUs) level. The LRUs consist of SRUs which could be exchanged to repair the LRU. The LRUs are repaired at Thales. The fifth level consists of components. The SRUs can be repaired by exchanging the components. The replacement of the components on the SRUs requires an environment where solder activities could take place thus Thales.
Figure 7: Product scope's breakdown
In the antenna of the Smart-L ELR are transmitters and receivers located. The Smart-L ELR has 28 building blocks which consist of parts who provide a transmit and receive function. The building blocks are 28 times mounted to the antenna and cannot be removed from the antenna. The building
Components
SRU
LRU
Building blocks
System
AntennaBuilding blocks (28x)
LRU 1 (8x)
SRU 1A
components
SRU 1B
components
LRU 2
SRU 2A
components
LRU 3
SRU 3A
components
J.L. Schmal The transition from operational availability to mission availability Case Study 9 blocks consist of seven LRUs which are necessary to create a bundle of the transmit and receive function. See Figure 7 for a complete overview.
All parts are considered critical parts. When one of the parts fails than the higher indenture part (a building block) also fails.
The LRU 1 is placed eight times in one building block. Each LRU 1 is divided into two SRUs namely the SRU 1A and the SRU 1B. The LRU 1 is repairable by replacement of the SRU 1A or the SRU 1B and these SRUs are repairable by replacement of components. The complete breakdown structure of the antenna could be found in appendix A.
2.1.2
Availability
In a PBL contract, the Smart-L ELR has a minimum availability target per ship per calender year.
Operational availability
Currently, the availability is based on annual operational hours. The operational availability could be calculated by the up time divided by the uptime plus the down time. This equals to the Mean Time Between Maintenance (MTBM) divided by the Mean Time Between Maintenance plus Mean Down Time (MDT).
Operational availability
*
100
%
MDT
MTBM
MTBM
%
100
*
Downtime
Uptime
Uptime
Supply availability
Thales uses the Mean Down Time (MDT) as waiting time for spare parts. The downtime for the system repair by replacing LRUs should take a couple hours and could be neglected on yearly basis. The waiting time of the spare parts is the mearused variable. This kind of availability is defined by Sherbrooke as supply availability. (Sherbrooke, 2004) Whereby the Mean Supply Delay (MSD) is the delay on the spare parts. In this research the term operational availability refers to the supply availability.
Supply availability
*
100
%
MSD
Uptime
Uptime
To achieve the availability obligation, several spare parts have to be stored in a multi-echelon supply chain. Thales receives a yearly fixed fee for maintenance on the sold systems. Depending on the contract Thales could get bonusses or penalties for the availability.
Smart-L ELR antenna availability
This case, the Smart-L ELR has an availability of 90%. This does not imply that the antenna of the smart-L ELR also has an availability of only 90%. In contrary the antenna of the Smart-L ELR has a higher availability necessary to ensure the 90% availability of the Smart-L ELR. In this case we use a Smart-L ELR MTBF of proximately of 450 hours. The availability of the antenna could easily be calculated with formula of the supply availability.
Supply availability Smart-L ELR 90% MSD
450 450
10 Case Study The transition from operational availability to mission availability J.L. Schmal MSD = 50
Supply availability antenna *100% 93.3% 50
700
700
The availability of the antenna is approximately 93.3%. When the MTBF of the parts of the antenna is changed the availability of the antenna will also change. The basis is the availability of 93.3%.
Mission availability
The mission availability will be measured by the customer and Thales. Thales uses an internal clock in the systems. The captain of the ship measures for the customer. Every day the captain checks if the system is operational and documents it. The systems should be operational during missions. Therefore this case the system is 90% available during missions. The mission availability will be formulated like the operational availability, but the measurement will take place during missions.
Mission availability
*
100
%
downtime
Mission
uptime
Mission
uptime
Mission
2.2
Research objective
The objective of this research is to find an optimal spare parts allocation procedure for the antenna of the Smart-L ELR. An optimal spare parts allocation procedure involves minimizing the cost and maximizes the mission availability constraint with a minimum availability target for the Smart-L ELR. Simultaneously it should take into account the mission length, annual operational hours, repair lead-time, of the multi-indenture antenna. In addition Thales prefers an allocation procedure which is “robust”. The solutions of the procedure are as little as possible sensitive for variations of the Mean Time Between Failure. Thales prefers solutions which are less sensitive to variations to the Mean Time Between Failure, which may have slightly higher cost.
In order to tackle the problem multiple research question are generated. The research questions serve for a methodical way of answering the main research question. The main research question is: What is the optimal spare parts allocation procedure of the antenna of the Smart-L ELR to ensure that the minimum mission availability constraint is satisfied, the cost are minimized, considering mission profiles, annual operational hours, and repair lead-time?
The following research questions are formulated as sub questions.
1. How is the service supply chain of the Smart-L ELR structured? (chapter 3)
a. What is a Performance Based Logistic (PBL) contract?
b. What is the supply chainof the antenna of the Smart-L ELR?
c. How is the repair process organized for the Smart-L ELR?
2. How is the literature of METRIC and VARI-METRIC applicable to the case study of the Smart-L
ELR antenna? (chapter 4)
3. What are the optimal spare parts time parameters with Inventri (VARI-METRIC) and what
influence has the repair lead-time on the spare parts inventory cost? (chapter 5)
4. How to step-by-step transform the VARI-METRIC (operational availability) solution to a
mission availability solution? (chapter 6)
J.L. Schmal The transition from operational availability to mission availability Case Study 11 Answering these sub questions eventually makes it possible to answer the main research question. This answer is stated in the conclusion in chapter 8.
2.3
Research approach
The baseline study for this research has already been carried out during the project MaSeLMa. For this study employees from Thales were interviewed and data files are evaluated. Parts of this baseline study will be used to answer the first research question.
A supply chain overview will be constructed for the first research question. This represents the work processes at Thales. This service supply chain includes the repair lead-time, shipment lead-times between stock locations. A flow diagram will be constructed for an overview.
Currently, Thales produces systems and sells most of their systems based on a traditional contract. This means that the system is sold with a warranty and for every service a new contract must be agreed. Mostly a system is sold with extra services like spare parts provisioning list, maintenance handbooks and training. Thales uses VARI-METRIC model variant of Rustenburg software called Inventri to calculate the spare parts provisioning. To answer the second research question a research of the VARI-METRIC model is required. Some assumptions are made to calculate the spare part stock per echelon in function of the availability of the spare parts against minimal cost. These assumptions, the parameters which the environment provides and the decision variable of this model should be defined. To research this mode the books of Sherbrooke and Rustenburg are used. (Sherbrooke, 2004) (Rustenburg, 2000).
Inventri could maybe be used for a first number of iterations of the initial spare part stock level calculation per echelon.
Thales uses at this moment Inventri to calculate the spare part list for their customers. To calculate their spare parts Thales uses standard repair lead-time and a procurement lead-time for a traditional “On Demand” contract. This is not beneficial for a PBL contract. M.C. van Zwam and T. Groener concluded that shorter repair lead-times create less initial spare parts cost. In addition, M.C. van Zwam concluded that short time parameters will create robustness to annual operational hours (AOH) variations. The failure demand is directly related to the MTBF and AOH. The failure demand is the MTBF divided by the AOH. Therefore it is expected that short time parameters will also create a less sensitivity to MTBF variations.
For research question three, the consequences of modifying these lead-times to the costs are investigated. The goal is to find an optimal steady state solution.
Research question four computes a spare parts allocation procedure. This procedure defines the spare part stock level at each supply chain location. The emphasis in this research question lies on transition from the operational availability of Inventri to the mission availability. The mission availability is calculated in the software Simlox. Simlox is a commercial off-the-shelf simulation software package that can simulate the missions and with this software a mission availability of a ship or multiple ships can be calculated. Simlox gives among others as output the operational availability, the mission availability and the probability of backorders per item per location.
12 Case Study The transition from operational availability to mission availability J.L. Schmal research question five the robustness of the spare parts inventory towards the shipment times and the repair lead-time are examined.
2.4
Deliverables
This research results in two deliverables for Thales. Firstly, Thales will receive a copy of this master thesis report. In this report Thales will find a foundation for the maintenance procedure and the underlying choices which are made during the research. Secondly, Thales will receive Simlox simulation input files with the optimal configuration based on this research.
2.5
Research outline/plan
In this paragraph, the outline of the master thesis is discussed. The sub research questions divide the report in chapters.
In chapter 3 the baseline of this research will be described (research question 1). Within the baseline the service contract, the supply chain, the repair of the system and LRU are described. In chapter 3 Inventri is introduced to calculate the spare parts allocations. In this research Inventri will be used to calculate the spare parts Inventory over the supply chain.
Inventri is introduced to calculate the spare parts allocations in chapter 3. This research will use Inventri to calculate the spare parts Inventory over the supply chain. Literature research is performed in chapter 4 in order to understand how Inventri calculates the spare parts allocation. Inventri calculates the spare parts allocation following the VARI-METRIC model variant of Rustenburg. Firstly, the model METRIC has to be investigated to understand the VARI-METRIC model. Secondly, the VARI-METRIC model will be discussed. Finally, the depot repair of Inventri is investigated. At the end of this chapter research question two will be answered and will be clear whether Inventri could be used.
In chapter 5 is discussed what the spare part stock level should be for the Smart-L ELR antenna in a steady state model (research question 3). Firstly, to determine what the spare part stock levels should be at Thales a calculation of the repair lead-time versus the investment cost of the lower indenture spare parts (components) is performed and analyzed. Secondly, the inventory of the LRU over the supply chain has to be calculated and investigated. The repair lead-time and the investment of the lower indenture have influence on the investment on LRU spare part stock levels. At the end of this chapter a balanced steady state solution will be provided.
The consequences of the steady state solution for the mission availability are investigated in chapter 6. From one Key Performance Indicator (KPI) of Inventri the transitions must be made to Simlox, which has KPI per system. A procedure is designed, which transforms step-by-step the operational availability solution to a mission availability solution. In this chapter research question 4 is answered and will be clear, how the transition could be made to the mission availability allocation.
J.L. Schmal The transition from operational availability to mission availability Case Study 13
3
Service of the antenna
Currently there is a service request shift from the traditional service contract to a Performance Based Logistic (PBL) contract. This means that the responsibility of the maintenance will shift from the customer to Thales. This is a new approach of maintenance for Thales. We will discuss the properties of the PBL contract in paragraph 3.1.
Due to the service responsibility change from the customer to Thales there will be also a change in the service supply chain. We will discuss the differences in paragraph 3.2.
The system repair onboard the ship is conducted by exchanging LRUs. Therefore the ship has a stock of ready-for-use LRUs. An LRU has the soft restriction that it must be exchangeable onboard the ship. For this research the assumption is that only the LRUs could be exchanged onboard the ship. The system repair will be more elaborated in paragraph 3.3.
Within Thales there are multiple repair flows. The LRUs are repaired by exchanging SRUs and the SRUs are repaired by exchanging components. Beside the repair process there is also an incoming flow from the suppliers of new LRU, SRU and components. It dependents on the part whether it is repaired or ordered from the supplier. There is also a possibility that the parts cannot successfully be repaired anymore and a new part should be ordered by the supplier. We will discuss the part repair process in paragraph 3.4.
The key findings of this chapter are given in paragraph 3.5.
3.1
Performance Based Logistic contract
Thales delivers their systems with a service contract. The terms of responsibility per actor are given in the service contract. Currently, Thales has three kinds of fundamental contracts namely, “On Demand” (traditional) contract, Service Level Agreement and Contract for Availability (PBL contract). Currently, Thales sells mostly “On Demand” contracts which are similar to a traditional service contract. An “On Demand” contract is sold with a warranty and for each additional service a separate contract has to be agreed. This also means that when the system fails and the ship is on a mission the customer is responsible for whether the required spare parts stock is available. With the “On Demand” contract the customer is final responsible for the system and their spare parts availability.
14 Case Study The transition from operational availability to mission availability J.L. Schmal Continuous investments in an In-Service support organisation are no longer needed;
A fixed annual In-Service support fee ensures the agreed operational availability by Thales;
Financial planning by the customer is better feasible as a result of the fixed fee;
Periodic reports by Thales that show the achieved performance based upon Key Performance Indicators;
Thales provide continuous monitoring of customer’s products, services and processes with a view on improvement;
Risks will be externalized. Risks relating to system availability are handled by Thales. In short a PBL contract means that the customer owns the system and Thales performs all the service which the system requires. The services are planned, controlled and executed by Thales. Thales does not have a lot of experience with PBL contracts. Currently there are only a view contracts sold of this format.
3.2
Service supply chain
Thales advices their customers which spare parts should be procured when they buy an “On Demand” contract. In the context of the service part supply system (Verrijdt, 1997) Thales recommends a flexible option namely the allocation flexibility. Thales uses Inventri which is based on a VARI-METRIC model variant of Rustenburg (2000) to calculate the spare part stock level per spare part stock location (echelon). The calculation is executed by the software Inventri. Inventri is custom made and special developed by the company ORTEC. Thales is the single owner of this software. The relation among the availability, spare parts allocation, repair lead-time and the shipment times of METRIC are more in depth discussed in chapter 5. Furthermore the VARI-METRIC model will be reviewed in chapter 4. In this paragraph we will discuss the service supply chain of Thales. Firstly, we will discuss the traditional contract service supply chain in section 3.2.1. Secondly we will discuss the PBL contract service supply chain in section 3.2.2. Finally we will discuss the case supply chain in section 3.2.3.
3.2.1
Traditional contract service supply chain
Inventri basically calculates the spare parts allocation under restriction of a minimum availability and/or maximum budget. Inventri allocates every iteration a spare part which gains the highest possible system availability per invested value. The customer requests typically two types of procurement recommendations with a traditional contract.
First advice of Thales is: the customer has a budget to invest in their spare parts and requests Thales which items should be procured to get the best possible system availability. Second advice of Thales is: the customer demands certain system availability and Thales
J.L. Schmal The transition from operational availability to mission availability Case Study 15 In special cases like the Dutch navy, some repairs could be done at the customer’s site as it is displayed in Figure 8. For example, the Dutch navy invested in a lot of repair equipment. If the depot could not repair the spare parts, the repair will be executed a level higher. Commonly the costumer’s site does not have a depot to repair the spare parts. Then spare parts repair will also be executed by a higher level, thus Thales.
3.2.2
Performance Based Logistic contract service supply chain
The traditional service contract procedures are described in the previous paragraph. With a PBL contract Thales has full responsibility for maintaining the systems. In addition the spare part repairs will only be executed by Thales. A new supply chain is modelled to give an overview of the supply chain that is used in this research. In Figure 9 is only the LRU part flow indicated. The LRUs are repaired at Thales or a supplier of Thales. There must be a spare part stock of SRUs and components at Thales to ensure short repair lead-time of the LRU.
[image:25.612.90.546.71.315.2]Figure 9 provides an overview of the part flow and which spare parts could be stocked at a location. The SRUs and components could only be stocked at Thales. The LRUs could be stocked onboard the ship, at the customer site or at Thales. When the failed part is not repairable then Thales orders a new part at the supplier.
16 Case Study The transition from operational availability to mission availability J.L. Schmal Figure 9: Service supply chain in terms performance based logistic contract
Within a service supply chain there are multiple environment parameters and decision variables. The environment parameters are dependent on the customer and system. The Dutch navy has different environment parameters compared with for example Brazil and each system has parts with their own specifications. The decision variables are the variables which Thales could influence to improve the availability and reduce the costs. The following environment parameters will be used in this research:
Input parameters:
Annual Operating Hours Echelon structure Mission profiles Part MTBF
Shipment times (replenishment time)
Annual Operating Hours
The systems are in general bought with the ship’s purpose. The Smart-L is bought for long missions. This means that the annual operating hours for the Smart-L is typically large. The annual operating hours are per fleet of systems.
Echelon structure
The echelon structure is also dependent on the customer. One customer has one harbor and five ships, while another customer could have two harbors and six ships.
Mission profiles
J.L. Schmal The transition from operational availability to mission availability Case Study 17 take 3 to 7 months. The sum of the mission length may not exceed the total annual operating hours. These mission profiles are dependent of the ship type. These types will be discussed in section 3.2.3.
Part MTBF
Each system contains out of parts and each part has Mean Time Between Failure (MTBF). A MTBF is a typically failure rate for parts. The failure rate could be calculated with MTBF formula:
MTBF 1 rate
Failure
MTBF is calculated by the reliability engineers to predict failure from the system. The MTBF is the amount of operational hours between two failures.
failures of
number Total
hours operating Total
MTBF
Shipment times (replenishment time)
The shipment of parts from Thales to the customer’s site and from the customer’s site to the ship is called: Shipment time from mother station. The shipment from the ship to the customer’s site and from the customer’s site to Thales is called: Shipment time to mother station. This way the variable could be used in multiple levels in the supply chain. Simlox uses the same terms. It is advisable to create many variables, because each software will use the data in a different way. For example Inventri uses only the shipment time from mother station and the shipment time to the mother station is part of the repair lead-time.
The following decision variables are used to influence the supply chain to optimize the availability and minimize the cost:
Spare parts allocation per echelon level Repair lead-time
Spare parts allocation per echelon level
The spare parts could be stored at different levels, namely Thales, at the customer’s site or onboard the ship. The position of the spare parts is a tactical decision. It could be possible that it is cheaper to store one LRU at the customer’s site instead of storing an LRU on each ship. Unfortunately some parts need to be stored onboard the ship, because they have a high failure rate.
Repair lead-time
Failed parts are sent to Thales. The repair lead-time of Thales could influence the LRU spare parts inventory. The repair lead-time is dependent on the spare parts of the lower indenture parts like the SRUs and the components. The inventory levels of the lower indenture are important for the repair lead-time. More about this topic in paragraph 3.4.
3.2.3
Case study service supply chain
18 Case Study The transition from operational availability to mission availability J.L. Schmal
Annual Operating Hours
The ships will have X annual operational hours together. The mission ship will go on large missions. Large missions have mission duration from three to seven months. We will use proportions to provide the division between the mission ships and the short-mission ships. In this case study the mission ships will have the proportion 9/20X hours operational for long missions and the short-mission ships will have the proportion 1/10X hours operational divided over multiple small short-missions. Small mission has mission duration from three to seven days.
Mission profiles
The missions are typical per ship per year. Therefore a classification of ship types could be made. This research has two types of ships, a mission ship and a short-mission ship. A mission ship goes on mission for several months and the short-mission ships will be close to the harbour for practices and tests. The short-mission ships will perform multiple short missions per year for several days. In Table 4 a short overview is presented.
Table 4: Specifications of the ship type
Mission ship type Length mission
Mission ship 3 to 7 months
Short-mission ship 3 to 7 days
[image:28.612.66.411.443.720.2]Naturally, the ships will annually cycle on mission ship type. Simlox will require mission profiles. The profiles will be programmed as Table 5. Simlox is modelled with one year warm-up period. This year will be deleted. For this reason there is a year zero in Table 5. Thus there will be an average over five years.
Table 5: Operational hours per year, per ship
Year Operational hours per ship Description mission
0 Ship: 9/20X hours Ship: 9/20X hours Ship: 1/10X hours
mission ship mission ship short-mission ship
1 Ship: 9/20X hours Ship: 9/20X hours Ship: 1/10X hours
mission ship mission ship short-mission ship
2 Ship: 9/20X hours Ship: 9/20X hours Ship: 1/10X hours
mission ship mission ship short-mission ship
3 Ship: 9/20X hours Ship: 9/20X hours Ship: 1/10X hours
mission ship mission ship short-mission ship
4 Ship: 9/20X hours Ship: 9/20X hours Ship: 1/10X hours
mission ship mission ship short-mission ship
5 Ship: 9/20X hours Ship: 9/20X hours Ship: 1/10X hours
J.L. Schmal The transition from operational availability to mission availability Case Study 19
Resupply cycle
The ships are on mission for months, but there could be a monthly or every other month resupply. These resupply options are possible for Thales. The parts have an average waiting time of 15 days for a monthly resupply. The parts have an average waiting time of 30 days for an every other month resupply. The spare parts will be stored as much as at the customer’s site instead of Thales. Thales could use the seven workdays of the customer. Thales gets eventually the call if the part should be replenished. The shipment times from the customer’s site to the mission ship will be summed with additional five days, because this will include administrational delay. The delay is determined in Table 6.
Table 6: Determination of the additional five days
Spare parts shipment decision time Time
Captain will contact shore for a spare parts One day
The shore will contact Thales One day
Thales finds the responsible employee who decides the spare parts are replenishment One day Thales gives green light to shore for spare parts replenishment One day
Shore includes the spare parts to the replenishment cycle One day
Total Five days
[image:29.612.59.574.390.707.2]Forward shipment time will be 20 days for the mission ships and three days for the short-mission ships.Figure 10 shows a total overview.
20 Case Study The transition from operational availability to mission availability J.L. Schmal
Return shipment time
The return shipment times from the mission ships to Thales will take about the same time as the forward shipment time. This means that the 5 days from shore to Thales plus the 15 or 30 days from the mission ships to shore. This will be 21 days (three calendar weeks) or 35 days (five calendar weeks). The shipment time is modified to 21 days due to calendar weeks notation. For the small mission ships it will be five days from shore to Thales plus the three days from small mission ship to shore. In total eight days for the return shipment.
The shipment times will vary between ships and shore stock locations. Shipment time from Thales to the customer’s site will be the same for all the ships. In this research the shipment between Thales and the customer’s site will be five days.
The repair lead-time at Thales will be defined in chapter 5.
3.3
Repair of the Smart-L ELR
Thales created the original maintenance concept for the Smart-L ELR. Within this research several principles will be used. The Smart-L ELR is a redesign on the Smart-L. Hereby it is well known that a ship could be on mission for large part of the year. A failure during a mission when there is no spare part stock will have consequences in terms of availability. Penalties are imposed when the system availability will descend below the agreed level of the contract. To prevent penalties the Smart-L ELR is built in such a way that the downtime is minimized. This is achieved by decomposing the functionality into parallel units, and decomposing the system into as much as possible LRUs. In this chapter the useful part of the current maintenance concept is described.
The Smart-L ELR is decomposed into as much as possible LRUs. The decomposition enables quick repairs onboard the ship if spare parts are available. Exchanging LRUs could be performed during missions and takes a few hours. LRU exchange must be possible to achieve the agreed availability target.
Figure 11: The accessibility of Smart-L ELR above deck
J.L. Schmal The transition from operational availability to mission availability Case Study 21 which LRU has failed by the Built In Test (BIT), which is implemented into the software of the radar. In Figure 11 a maintainer is displayed to give an overview of how the LRUs are accessible. To exchange LRUs there has to be a spare part stock onboard the ship. The spare part stock level could be calculated by Inventri. This is calculated by systems operational hour per year and the replenishment time of the ships stock, but cannot consider mission profiles. The software Simlox is used to calculate the mission profiles of the ships. To manage the spare part stock onboard the ship the following requirements are necessary.
Spare part stock on shore
The spare parts onboard the ship will run out over time. When the ship is on mission and LRUs fail, these will be exchanged by the spare parts. The failed LRUs should be replenished by ready-for-use spare parts. Therefore a shore stock is necessary to ensure short replenishment lead-time of the ship. Especially after long missions the ship has a relatively large stock of failed LRUs that should be replenished by the shore stock.
Replenishment procedure for the failed LRUs
When the failed LRUs are on shore, then these LRUs should also be replenished by ready-for-use LRUs. This could be accomplished by repair or replacement by new ones. This is dependent on the repair abilities of the LRUs. When it is cheaper to buy a new LRU the failed LRU will be replaced by a new LRU. Otherwise the LRU should be repaired by Thales.
Monitoring of the stock levels and location of spare parts
Monitoring of the stock levels and location of the spare parts are necessary. This is executed by a Computerized Maintenance Management System (CMMS). It tracks and traces the position and levels of the spare parts to ensure the stock levels are sufficient.
A maintainer as part of the ship’s crew is needed for these exchanges. This maintainer needs to be trained and certified by Thales to a basic maintenance skill level. When an LRU fails the maintainer should be able to exchange the LRU with manuals which serve as a guide for the maintenance procedure.
3.4
Spare parts repair
Thales repairs the LRUs. Due to few acquisitions per year and few commonalities among systems of the parts, the repairs are performed in a one-for-one process. Thales repairs parts by repair & return or replacement & repair. Most parts (>90%) are processed by the repair & return procedure. Due to the amount of sold “On Demand” contracts it was no debatable to change the repair process into a replacement & repair process.
Repair & return (>=90%)
The failed part is sent to Thales. Thales repairs the failed part and afterwards the repaired part is returned to customer.
Replacement & repair (<10%)
22 Case Study The transition from operational availability to mission availability J.L. Schmal Both repair processes have their pros and cons. A quick overview is give of the differences in Table 7.
Table 7: Pros & cons between the repair processes
Process Repair lead-time Inventory cost
Repair & return Long Low
Replacement & repair Short High
The goal of this research is to minimize the initial spare parts inventory costs. Therefore, it is important to research this repair process in more detail. We will solely discuss the repair & return process.
Repair & return process
(Zwam, 2010)
In this section we will elaborate the repair & return process, because this is the general repair procedure of Thales. Reducing the repair lead-time could benefit the spare parts provision cost.
Figure 12: Repair Throughput Time (Donderwinkel, 2005)
The repair process of Thales consist of four phases: Quotation phase, order-handling phase, repair phase and the dispatch phase. Only the repair phase will be used, because only this phase is applicable for a PBL contract, which is the subject of this research. This means that there will be no negotiations for the repair quotation. This quotation phase is meant for other service contracts like the “On Demand” contract. The assumption in this research is that the parts with PBL contract gets the highest priority and therefore the Order handling phase and Dispatch phase could be set to zero weeks. The different phases will be described shortly.
Order-handling
The order-handling phase will start with the incoming failed part. In this phase the part will be examined and the defects will be reported. The part will be examined visually to check part’s conditions when enters the repair process. The examination will be reported into the system. The order-handling phase will take 14 days.
Standard repair