Sample Size Determination and Statistical Hypothesis
Testing for Core Centration in Press Coated Tablets
Pierre Lafaye de Micheaux1, Vincent Lemaire2
1Département de Mathématiques et Statistique, Université de Montréal, Montréal, Canada 2Pfizer Inc., San Francisco, USA
Email: [email protected], [email protected] Received April 11, 2012; revised May 15, 2012; accepted May 30, 2012
ABSTRACT
A novel statistical approach to evaluate the manufacturing quality of press coated tablets in terms of the centering of their core is presented. We also provide a formula to determine the necessary sample size. This approach is applied to real data.
Keywords: Core Centration; Statistical Hypothesis Testing; Dry-Coated Tablets; Sample Size
1. Introduction
Dry-coated tablets provide an adequate and inexpensive technology for the development of controlled-release tablets. The combinations of different compositions be-tween the core and the coat allows for a large variety of design of the release profile [1,2]. It is important that the core is well centered inside of the tablet to make the tab-let more light-stable, more water-stable or to preserve the release properties [2-4]. The positioning of the core var-ies slightly from tablet to tablet during the manufacture process [5-9]. A quality assessment process needs then to be established to guarantee that the centering of the core stays within certain specifications. Current methods used for evaluating core centration are either imprecise, where the core position is measured “by hand” [1,10], or ex-pensive, where costly diagnostic equipment is required [3]. An option to obtain well-centered cores is to use one- step dry-coated tablets [3,11] but the technology is rather new and not implemented everywhere. In this paper, we propose a relatively inexpensive and reliable methodol-ogy to monitor core centration during the manufacture of dry-coated tablets. The methodology is based on the cut-ting of a small sample of tablets (see Section 2), dyeing of the cut surface to distinguish the core from the coat, taking pictures of the cut surface with a digital camera, analysis of the pictures using image processing algo-rithms to extract core positioning parameters (see Section 3), and a statistical analysis of these data to provide core positioning information for the whole production batch and to compute the minimal sample size required to give a meaningful statistical answer. The goal of this paper is to present in details the statistical method that was devel-
oped (see Section 4) and an example of application to real data (see Section 5).
2. The Core Centration Problem
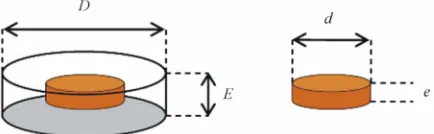
The notations for the dimensions of the diameter and thickness of the tablet and of the core are given on Fig-ure 1.
Generally, the exclusion criterion for deciding if the centering of a core is acceptable or not is if the minimum distance between the edge of the core and the border of the tablet is smaller to some fixed distance , let’s say 1/10th of min
m
0
m
D d 2,
E e
2
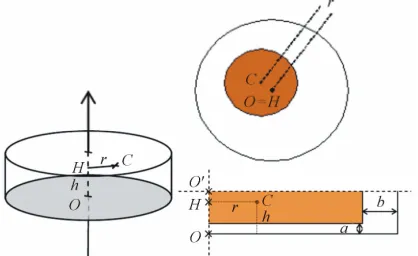
.We will assume that, for practical reasons (e.g. to pre-vent a breaking of the tablet), it is only possible to make one cut per tablet. The two types of cuts useful to meas-ure the quality of core centration and easy to perform are the longitudinal cut and the transverse cut, as schema-tized on Figure 2.
Once several tablets have been cut, transversely or lon-gitudinally, we measured various displacement quantities, as illustrated on Figure 3, using a modus operandi
[image:1.595.315.532.642.709.2]de-scribed in the next section. The needed measures of posi-tion and distance are:
Figure 2. Schematization of longitudinal and transverse cut.
Figure 3. Parameters of interest to determine core off-cen- ter. For symmetry reasons, the left and upper parts of the transverse cut may be omitted.
O is the center of the tablet on the bottom surface of it, while O is the real center of the tablet;
C is the position of the center of the core in the tab-let and H is its orthogonal projection on the rota-tional axis of symmetry of the tablet;
h is the distance (measured on the transverse cut) from H to the bottom surface of the tablet (along the axis of rotation), i.e. distance OH;
r is the distance (measured on the longitudinal cut) from the center of the core C to the rotational axis of symmetry of the tablet;
The distancesa:a
h h e 2 and
: d 2r that will be used in Section 4 to build the statistical test of core centration.
b b r D
Moreover, note that we will suppose that vertical and horizontal displacements are independent, and we will also neglect tilt movements of the core, which is a realis-tic assumption as can be seen on Figure 5.
3. A Pattern Recognition Tool
The cut tablets are placed on a tray and two pictures are taken, one for the longitudinal cut (see Figure 4) and one
for the transverse cut (see Figure 5). After dyeing, the
core appears dark brown and the outer layer appears beige. Using Matlab and its Image Processing Toolbox, we developed algorithms for image recognition to identify the border of each tablet and each core. The necessary positioning parameters are then computed and used for
[image:2.595.329.519.91.230.2]Figure 4. Picture of longitudinally cut tablets.
Figure 5. Picture of transversely cut tablets.
the statistical analysis.
4. A Statistical Hypothesis Test
4.1. The Statistical Formulation of the Question Let be a random variable giving, for each observed tablet, the minimum distance between the edge of its core and the border of this tablet. Let 0 be a reference distance below which a tablet is declared unacceptable and let
Μ
m
m
0
m be the unknown probability that is above the 0 threshold.
Μ
p P m
Μ m0
The objective is to significantly prove, namely with a small and controlled error risk (less than some fixed thresh- old α), that (in the population) pm0 > c = 1 – ε for a fixed and small given tolerance value ; that is to say that our tablets are correctly manufactured with high probability.
We can formalize this problem in the statistical hy-pothesis jargon, using the so-called null and alternative hypotheses:
H0:pm0c versus H p1: m0 c. (1)
Following the notations given in Section 2, we define
2
e
a and
R R2
D d
b
R
, where we will
suppose that the random variables and are in-dependent. It is easy to see that Μmin
a , Rb
. Since and are supposed to be independent, we haveR
R
Μ min , R
; R R
2 2 R
2 R 2
1 2 2
x a b x
a x b x
a x b x
e x D d x
x e D d x
F x e F D d x
P P
P
P P
P P
[image:2.595.68.277.215.343.2]
F
P
and
where R
arethe cumulative distribution functions of and res- pectively.
R
P
R
F
Thus
D d
2m0
.n n
n n
0 1 0 2 R
m
p F m e F (2)
4.2. The Statistic Used to Build the Test
Suppose we have a random sample of 1 2 tablets, where 1 (resp. 2) tablets have been longitudinally (resp. transversely) cut. So we end up with the random samples 1 1 and 1 2, independent copies
of and respectively. Based on these observations, we can estimate with the statistic
, , n
R
0 m
p
R , , R n
0 ,1 0 R,n2 0
ˆm 1 n 2 2
p Fˆ m e Fˆ D d m (3)
where Fˆ,1
1n1
11
n
n
i i1 and
2 R, 2 ˆ 1 nF n 2
1 R
n i
i
1 th
are the empirical distri- bution functions of and R respectively, wi 1
being the indicator function, nam equals 1 if condition is true and 0 otherwise.
ely
C
1 1 nn i i x
1
0, , n
1 1
in n p,
1 1 ni i i x
1
1 1
p F x
2
2 R,n x in
n p2, 2
2 R
p F x
C1
4.3. Distribution of the Test Statistic
We have n1
1Fˆ,1
x
n1
is a ran- dom variable that can take values in 1 . In fact,one can show that it has a binomial distribution with
1 1 1 1 1
1 1 1 1 ,
i
n p n x n
n n x n F x
1 1 P 1 n so . Similarly, one can show that ˆ
n F has a binomial distribution with .
Thus the test statistic,
0 1
1 2ˆm 1 1 ˆ ,n 0 2 R,nˆ
e
n n p n F m n F
2 2 2 0
D d m
is a random variable taking values in the set
0, , n
n p
1 2 , and whose dis- tribution is the product of two independent binomial distributions 1 h with
; , 0, ,
E k ij i j n
L
1 in ,
B
0
: 1 2
h
p F m e and B2 in
n p2, r
with
: R D 0
0 .
m h r
p p p
L
0 , .
n p k k E
B B
1
B B2
2
d m
r
p F . Note that from (2), we have
(4)
The (unknown) probabilities of distribution are
0 1 2ˆπk pm :πk n m
P
(5)
Let 1 and 2 be two independent random vari-ables with distributions and respectively, and let
,
0, , 1
0, , 2
;
.k i j n n ij k
k E
We have, for all ,
1 2 1 2 2 2 , 2 , 1 2 , 1 2 , π ; 1 1 1 1 , k k k k k i j i jn i n j
i j
h h r r
i j
n i n j
i j
h r h r
i j
k i j
i j
n n
p p p p
i j
n n
p p p p
i j
A B C
1 1 1 P P P P
where
1 2 2 1 0 0 0 1 2 , 1 2 , 1 1 1 1 k ki j i n i n j
h r r h r
i j i j
j i n j
n i
m m
i
m h
i j h h
i j
n n
A p p p p p
i j
p p
n n
p p
i j p p
1 2 2 1 0 0 1 2 , 1 2 , 1 1 1 1 k kj n i n j
i j
h h r h r
i j i j
n j
n i m
i j j
h m h
i j h
i j
n n
B p p p p p
i j
p n n
p p p
i j p
and
1 2 2 1 0 0 0 0 1 2 , 1 2 , 1 1 1 1 1 1 . 1 k k n ni h r
h r i
i j h r
i j n n m h h i m i
i j m
i j
h m
h
n n p p
C p p
i j p p
p p
n n p
p
i j p
p p p
:4.4. Critical Region and Statistical Decision
UnderH0 pm0 c, we have from (5) πkπk c
:π0k. For a pre-specified significance level (0.05 or 0.1 are classical values), let
p
h
be the largest (positive)
value, called the critical value, such that:
0
0
1 2ˆ 0 is true π .
h
m h k
k E k p
n n p p H
P (6)the observed value 1 2 0, of 1 2 m0 (computed
with our observations) will be greater than ˆm obs
n n p n n pˆ
p h . However, since h is unknown, we will substitute it with a value h given by an expert. This expert likely computed it from a preliminary study in a context where tablets were known (e.g. using more expensive and so-phisticated techniques) to be correctly manufactured (i.e.
).
p p
: π1 k k k0
p c
π π
m
4.5. Determination of Sample Size
We define as a (fixed and known) effect size value greater than c. Under 1 0 , we have from (5)
. The type II error risk : m
H p
is defined using the following equation, where is the same value as before:
hp
1
π .
h
k k E k p
0
1 2ˆ
n n p
m ph H1
is true
1
P
(7)
It is often required that the power 1
of the test be at least equal to some fixed value 0
1, ,2
n n
(e.g. 0.8). Now, using (6) and (7), it is possible to obtain a formula (pos-sibly not in closed form) relating , , ,c 0
,
and .
h
p
We will suppose without loss of generality that . For given values of 0
1 2
n n n , ,c and ph
h , the necessary sample size to use is thus obtained
by solving in the two unknown values
p
n ph
1
π
π
h
h
p
p
, the
following system:
0
0
. k
k
;
;
k E k
k E k
ˆ L
*
L
4.6. Other Approaches to Approximate the Distribution L
Two other approaches may be used to approximate the law L. We could resort to bootstrap methods (see [12]) to approximate it by say. Also, under some conditions we can approximate a binomial distribution with a Gaus-sian distribution. In this case, we could approximate L
with the product of the preceding Gaussian distribu-tions whose density is to be determined (knowing the joint density of the two Gaussians).
Here also, we will reject H0 (i.e. we will show H1: our tablets are correctly manufactured) with a controlled probability of taking a wrong decision as soon as the observed value 1 2 0, of 1 2 0 (computed with
our observations) will fall too far in the upper low prob-ability regions of or .
ˆm obs p
*
L
n n n n pˆm
ˆ L
5. A Real Data Application
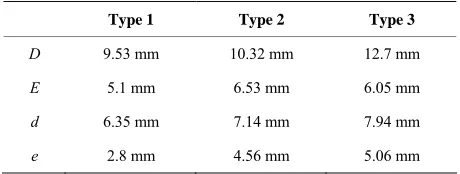
[image:4.595.308.538.101.188.2]We obtained samples of dry-coated tablets. The dimen-sions of these tablets are given in Table 1. We were able
Table 1. Dimensions of the tablets.
Type 1 Type 2 Type 3
D 9.53 mm 10.32 mm 12.7 mm
E 5.1 mm 6.53 mm 6.05 mm
d 6.35 mm 7.14 mm 7.94 mm
e 2.8 mm 4.56 mm 5.06 mm
to obtain the following i and measurements from 58 tablets of Type 1, from which 1 were cut lon-gitudinally and
h ri
28
n
30
n2 were cut transversely:
hi: 2.42413 2.43201 2.50639 2.38244 2.28380 2.40008 2.49024 2.36265 2.35915 2.45703 2.48598 2.42386 2.43107 2.44298 2.41016 2.41928 2.43686 2.29511 2.41397 2.52839 2.37148 2.46547 2.52098 2.46419 2.28514 2.27086 2.52790 2.40166 2.28546 2.39130;
ri: 0.32041 0.31734 0.22026 0.37408 0.21759 0.52229 0.35651 0.23147 0.33771 0.33981 0.28513 0.25708 0.23791 0.09140 0.26171 0.30145 0.34680 0.25996 0.31784 0.47770 0.06728 0.08803 0.14386 0.26170 0.14298 0.13447 0.19959 0.16734.
We used the R software, version 2.11.0 (2010-04-22)
[13] and our code is available from the first author. We performed the test using the (reasonable) values α = 0.05,
0.73
c , ph0.94 m00.89
ˆ 728
n n p
0.2
and . We obtained the following results: 1 2 m obs0, with a p-value equal
to 0.03647. Thus, it is possible to conclude at level 5% that the tablets are correctly manufactured. Note that choosing the values 0 and , the sample size needed can be computed as being 2 × 29 = 58 tab-lets.
0.9
6. Conclusion
A statistical hypothesis test was developed to evaluate the manufacturing quality of dry-coated tablets, in terms of off-centering of their core. We also presented a for-mula to compute the sample size needed to get a fixed power. This research could be refined by taking into ac-count the possible tilt movements of the core that have been neglected in this work. Also, sequential analysis and multiple testing problems could be investigated in this context.
7. Acknowledgements
The authors would like to thank the company which pro-vided the samples of tablets.
REFERENCES
using Gellable and Permeable Polymers,” Der Pharmacia Lettre, Scholars Research Library, Vol. 2, 2010, pp. 482- 497.
[2] Y. Ozeki, M. Ando, Y. Watanabe and K. Danjo, “Evalua- tion of Novel One-Step Dry-Coated Tablets as a Platform for Delayed-Release Tablets,” Journal of Controlled Re- lease, Vol. 95, No. 1, 2004, pp. 51-60.
doi:10.1016/j.jconrel.2003.10.028
[3] M. Ito, T. Suzuki, N. Wakiyama, H. Teramoto, E. Yo- nemochi and K. Terada, “Development of a Rapid Proc- ess Monitoring Method for Dry-Coated Tableting Process by Using Near-Infrared Spectroscopy,” Chemical and Pharmaceutical Bulletin, Vol. 59, No. 7, 2011, pp. 868- 873. doi:10.1248/cpb.59.868
[4] J. Windheuser and J. Cooper, “The Pharmaceutics of Coating Tablets by Compression,” Journal of the Ameri- can Pharmaceutical Association, Vol. 45, No. 8, 1956, pp. 542-545. doi:10.1002/jps.3030450812
[5] L. Lachman, P. P. Speiser and H. D. Sylwestrowicz, “Com- pressed Coated Tablets. I. Measurement and Factors In- fluencing Core Centration,” Journal of Pharmaceutical Science, Vol. 52, No. 4, 1963, pp. 379-390.
doi:10.1002/jps.2600520415
[6] Y. Ozeki, Y. Watanabe, S. Inoue and K. Danjo, “Com- parison of the Compression Characteristics between New One-Step Dry-Coated Tablets (OSDRC) and Dry-Coated Tablets (DC),” International Journal of Pharmaceutics, Vol. 259, No. 1-2, 2003, pp. 69-77.
doi:10.1016/S0378-5173(03)00208-4
[7] Y. Ozeki, Y. Watanabe, S. Inoue and K. Danjo, “Evalua-
tion of the Compression Characteristics and Physical Properties of the Newly Invented One-Step Dry-Coated Tablets,” International Journal of Pharmaceutics, Vol. 267, No. 1-2, 2003, pp. 69-78.
doi:10.1016/j.ijpharm.2003.07.011
[8] Y. Ozeki, Y. Watanabe, H. Okamoto and K. Danjo, “De- velopment of Dividable One-Step Dry-Coated Tablets (Dividable-OSDRC) and Their Evaluation as a New Plat- form for Controlled Drug Release,” Pharmaceutical Re- search, Vol. 21, No. 7, 2004, pp. 1177-1183.
doi:10.1023/B:PHAM.0000033004.88953.bc
[9] S. Rujivipat, “Novel Formulation and Processing Aspects for Compression-Coated Tablets and for the Compression of Polymercoated Multiparticulates,” Ph.D. Thesis, Free University of Berlin, Berlin, 2010.
[10] R. Srinivas, H. G. DeKay and G. S. Banker, “New Ap- proach to Development and Manufacture of Enteric Com- pression Coatings,” Journal of Pharmaceutical Sciences Vol. 55, No. 3, 1966, pp. 335-340.
doi:10.1002/jps.2600550314
[11] S. A. Yehi, A. H. Elshafeey, I. Sayed and A. H. Shehata, “Optimization of Budesonide Compression-Coated Tab- lets for Colonic Delivery,” AAPS PharmSciTech, Vol. 10, No. 1, 2009, pp. 147-157.
[12] B. Efron and R. J. Tibshirani, “An Introduction to the Bootstrap, Ser. Monographs on Statistics and Applied Probability,” Chapman and Hall, New York, 1993. [13] Development Core Team, A Language and Environment