ISSN Print: 2165-7408
DOI: 10.4236/ojoph.2018.83017 Jul. 25, 2018 133 Open Journal of Ophthalmology
Quantitative Assessment of Foveal Avascular
Zone in Patients with Early and Intermediate
Nonexudative Age-Related Macular
Degeneration Using Optical Coherence
Tomography-Angiography
Vladimir Stavrev, Nelly Sivkova, Desislava Koleva-Georgieva
Department of Ophthalmology, Faculty of Medicine, Medical University of Plovdiv, Plovdiv, Bulgaria
Abstract
Optical coherence tomography-angiography (OCT-A) is a relatively new non-invasive imaging technique which provides three-dimensional visualiza-tion of the retinal and choroidal microvasculature. Recently, OCT-A is widely used in the diagnosis of age-related macular degeneration (AMD). Purpose: To compare 3 quantitative indexes of foveal avascular zone (FAZ)—area (A), perimeter (Pm), and circularity (C) in patients with early and intermediate nonexudative AMD and healthy subjects using OCT-A. Methods: Eighty-nine patients with nonexudative AMD (n = 89 eyes) were enrolled in the study. They were compared with sex- and age-matched control group of 66 healthy subjects (n = 66 eyes). The patients with nonexudative AMD were divided in-to 2 subgroups—early AMD (n = 42 eyes) and intermediate AMD (n = 47 eyes). All participants underwent OCT-A (3 × 3 mm scans, Cirrus HD-OCT, Angioplex, Carl Zeiss Meditec, Dublin, CA). Results: There was no statistically significant difference in all 3 assessed indexes between the early AMD sub-group and the control sub-group (A − P = 0.139; Pm − P = 0.230; and C − P = 0.191). There was also no statistically significant difference in all 3 assessed indexes between the intermediate AMD subgroup and the control group (A − P = 0.106, Pm − P = 0.124, and C − P = 0.102, respectively). Conclusions: According to our results from the assessment of FAZ in patients with early and intermediate AMD, we hypothesize that macular perfusion remains fairly unchanged in the nonexudative stages of the disease. OCT-A is a reliable tech-nique for visualizing and quantifying FAZ in patients with nonexudative AMD.
How to cite this paper: Stavrev, V., Siv-kova, N. and Koleva-Georgieva, D. (2018) Quantitative Assessment of Foveal Avascu-lar Zone in Patients with Early and Inter-mediate Nonexudative Age-Related Macu-lar Degeneration Using Optical Coherence Tomography-Angiography. Open Journal of Ophthalmology, 8, 133-139.
https://doi.org/10.4236/ojoph.2018.83017
Received: May 29, 2018 Accepted: July 22, 2018 Published: July 25, 2018
Copyright © 2018 by authors and Scientific Research Publishing Inc. This work is licensed under the Creative Commons Attribution International License (CC BY 4.0).
DOI: 10.4236/ojoph.2018.83017 134 Open Journal of Ophthalmolog
Keywords
Age-Related Macular Degeneration, Optical Coherence Tomography-Angiography, Foveal Avascular Zone
1. Introduction
Age-related macular degeneration (AMD) is the leading cause of visual impair-ment in individuals over the age of 55 years worldwide [1]. The clinical classifi- cation of AMD defines 3 stages according to the size of drusen, pigmentary ab-normalities, and/or choroidal neovascularization (CNV) assessed within 2 disc diameters of the fovea—early, intermediate, and late AMD, including geographic atrophy (GA) and CNV [2].
The traditional multimodal imaging modalities in AMD include fluorescein angiography (FA), indocyanine green angiography (ICGA), and optical coherence tomography (OCT) [3]. OCT-angiography (OCT-A) is a relatively new non-invasive imaging technique. It provides three-dimensional visualization of the retinal and choroidal microvasculature, without the need of an intravenous dye [4]. A motion contrast is generated by differentiating between moving eryt-hrocytes in the vessels and static surrounding tissue [5]. Each OCT-A-scan is simultaneously obtained along with the corresponding standard OCT B-scan. Thus, both functional and morphological images are acquired [6].
Recently, OCT-A has been used in many vascular and degenerative diseases (AMD, diabetic retinopathy, central/branch retinal vein occlusion, etc.) to vi-sualize and examine microvasculature, as well as foveal avascular zone (FAZ), in different vascular plexuses separately [7][8]. FAZ is a non-vascular area within the central part of the macula—fovea. Its dimensions vary among normal indi-viduals [8] [9]. In addition, in various retinal diseases FAZ may be altered or deformed which may correlate with decreased best-corrected visual acuity (BCVA) [10][11][12].
The purpose of the recent study was to compare 3 quantitative indexes of the superficial FAZ—area (A), perimeter (Pm), and circularity (C) in a Caucasian cohort with early and intermediate nonexudative AMD, and healthy subjects using OCT-A.
2. Materials and Methods
DOI: 10.4236/ojoph.2018.83017 135 Open Journal of Ophthalmolog
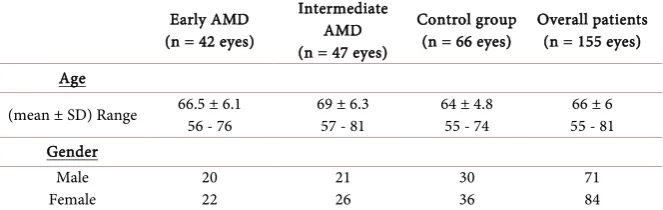
Table 1. Characteristics of the examined groups.
Early AMD (n = 42 eyes)
Intermediate AMD (n = 47 eyes)
Control group
(n = 66 eyes) Overall patients (n = 155 eyes) Age
(mean ± SD) Range 66.5 ± 6.1 56 - 76 69 ± 6.3 57 - 81 64 ± 4.8 55 - 74 55 - 81 66 ± 6 Gender
Male
Female 20 22 21 26 30 36 71 84
AMD = age-related macular degeneration, SD = standard deviation.
AMD with drusen ≥ 125 µm and/or pigmentary abnormalities (n = 47 eyes). Criteria for inclusion in AMD patients group were age ≥ 55 years old, drusen and/or retinal pigment epithelium (RPE) abnormalities (hyper-/hypopigmenta- tion) secondary to AMD, a spherical equivalent of ≥ −3D to ≤ +3D. Exclusion criteria were presence of CNV, GA, and other ocular degenerative, vascular or traumatic diseases. They were compared with sex- and age-matched control group of 66 healthy subjects (n = 66 eyes, 36 female and 30 male).The age was 64 ± 4.8 years, range 55 - 74. The inclusion criteria for the healthy volunteers were age ≥ 55 years old, BCVA of ≥ 1.0, and no history or evidence of ocular or sys-temic disease.
All participants underwent a complete ophthalmologic examination, includ-ing BCVA (Snellen charts), slit-lamp biomicroscopy with fundus examination, tonometry, and OCT-A (Cirrus HD-OCT, Angioplex, Carl Zeiss Meditec, Dub-lin, CA). OCT-A has automatic algorithms that provide estimates of the ‘‘non-flow’’ area in the center of the macula, defining the FAZ (Figure 1). Quantitative analyses of the FAZ were performed using the 3 × 3-mm en face OCT-A images. In this study we used only the preset settings for the superficial FAZ because of software limitations. We measured 3 indexes of the superficial FAZ-A in mm2,
Pm in mm, and C. OCT-A scans with low quality of images were excluded. Written informed consent was obtained from all participants.
All statistical analyses were performed using statistical software (IBM SPSS software Version 19; SPSS, Inc., Chicago, IL, USA). The correlation between healthy subjects and each AMD subgroup was generated by independent-sam- ples T-test. P values less than P < 0.05 were considered statistically significant.
3. Results
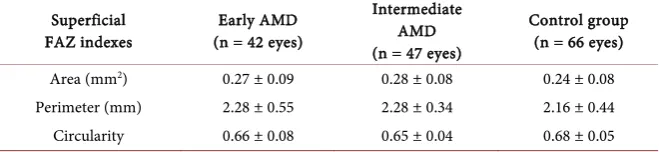
Our study analyzed 89 eyes of AMD patients and 66 eyes of healthy volunteers (n = 155 eyes, 66 ± 6 years, range: 55 - 81). In the early AMD subgroup the fol-lowing FAZ values (mean ± SD) were established: A—0.27 ± 0.09 mm2, Pm—2.28
± 0.55 mm, and C—0.66 ± 0.08. In the intermediate AMD subgroup the regis-tered values were: A—0.28 ± 0.08 mm2, Pm—2.28 ± 0.34 mm, and C—0.65 ±
0.04, and in the control group: A—0.24 ± 0.08 mm2, Pm—2.16 ± 0.44 mm, and
DOI: 10.4236/ojoph.2018.83017 136 Open Journal of Ophthalmolog (a)
[image:4.595.62.536.75.550.2](b) (c)
Figure 1. Superficial foveal avascular zone in healthy subject (a), in early AMD (b), and in intermediate AMD (c).
AMD subgroup and the control group: A – P = 0.139, Pm – P = 0.230, and C – P = 0.191. No statistically significant correlation was found in all 3 assessed indexes between the intermediate AMD subgroup and the control group as well: A – P = 0.106, Pm – P = 0.124, and C – P = 0.102, respectively.
4. Discussion
DOI: 10.4236/ojoph.2018.83017 137 Open Journal of Ophthalmolog
Table 2. Quantitative indexes of superficial foveal avascular zone (FAZ) in early and
in-termediate age-related macular degeneration (AMD), and in control group.
Superficial
FAZ indexes (n = 42 eyes) Early AMD
Intermediate AMD (n = 47 eyes)
Control group (n = 66 eyes)
Area (mm2) 0.27 ± 0.09 0.28 ± 0.08 0.24 ± 0.08
Perimeter (mm) 2.28 ± 0.55 2.28 ± 0.34 2.16 ± 0.44
Circularity 0.66 ± 0.08 0.65 ± 0.04 0.68 ± 0.05
eyes has been previously described by various studies. Samara et al.[8] and Tan
et al. [13] reported no correlation between FAZ area and age in normal eyes
whereas Iafe et al. [14] found a significant difference in the examined variables. In our study we did not find any statistically significant correlation between age and FAZ area in the group of healthy volunteers (P > 0.354). FAZ area and gender remain a controversial topic which has to be confirmed or rejected by additional studies [8][13].
In the analysis of superficial FAZ and examined parameters (A, Pm, and C) on 3 × 3-mm scans, our results did not show any statistically significant differ-ence between patients with different stages of nonexudative AMD and control group of healthy volunteers. According to that, we hypothesize that FAZ area and shape, as well as macular perfusion remain fairly unchanged in the nonvas-cular form of the disease. As far as we know this is the first study which com-pares FAZ variables such A, Pm, and C in patients with nonexudative AMD us-ing OCT-A.
There are some limitations in this study. We did not evaluate deep FAZ be-cause of the software version limitations. In all conducted studies deep FAZ was measured with a wider range compared to superficial FAZ [9] [14] [15]. Fur-thermore, central foveal thickness and axial length were not included in the overall assessment. Some authors describe negative correlation of superficial FAZ area with central retinal thickness [8][13].
5. Conclusion
In conclusion, OCT-A is an appropriate non-invasive and reliable method for evaluating superficial FAZ that provides automatic quantitative measurement of this “nonflow’’ area in the center of the macula. According to our results, we hypothesize that macular perfusion remains fairly unchanged in the nonexuda-tive stages of the disease. Additional studies are needed to confirm its applica-tion and importance in nonexudative stages of AMD.
Conflict of Interest
The authors declare no conflict of interest.
Funding
DOI: 10.4236/ojoph.2018.83017 138 Open Journal of Ophthalmolog
References
[1] Wong, W.L., Su, X., Li, X., et al. (2014) Global Prevalence of Age-Related Macular Degeneration and Disease Burden Projection for 2020 and 2040: A Systematic Re-view and Meta-Analysis. The Lancet Global Health, 2, e106-e116.
https://doi.org/10.1016/S2214-109X(13)70145-1
[2] Ferris III, F.L., Wilkinson, C.P., Bird, A., et al. (2013) Clinical Classification of Age-Related Macular Degeneration. Ophthalmology, 120, 844-851.
https://doi.org/10.1016/j.ophtha.2012.10.036
[3] Sulzbacher, F., Kiss, C., Munk, M., et al. (2011) Diagnostic Evaluation of Type 2 (classic) Choroidal Neovascularization: Optical Coherence Tomography, Indocya-nine Green Angiography, an Fluorescein Angiography. American Journal of Oph-thalmology, 152, 799-806 e1.
[4] Lumbroso, B., Huang, D., Jia, Y., et al. (2015) Clinical Guide to Angio-Oct Non In-vasive, Dyeless OCT Angiography. 1st Edition, Jaypee Brothers Medical Publisher (P) Ltd., New Delhi.
[5] Jia, Y., Tan, O., Tokayer, J., et al. (2012) Split-Spectrum Amplitude-Decorrelation Angiography with Optical Coherence Tomography. Optics Express, 20, 4710-4725. https://doi.org/10.1364/OE.20.004710
[6] Jia, Y., Bailey, S.T., Wilson, D.J., et al. (2014) Quantitative Optical Coheren Ceto-mography Angiography of Choroidal Neovascularizationin Age-Related Macular Degeneration. Ophthalmology, 121, 1435-1444.
https://doi.org/10.1016/j.ophtha.2014.01.034
[7] Spaide, R.F., Klancnik, J.M. and Cooney, M.J. (2015) Retinal Vascular Layers Im-aged by Fluorescein Angiography and Optical Coherence Tomography Angiogra-phy. JAMA Ophthalmology, 133, 45-50.
[8] Samara, W.A., Say, E.A.T., Khoo, C.T.L., Higgins, T.P., Magrath, G., Ferenczy, S., et al. (2015) Correlation of Foveal Avascular Zone Size with Foveal Morphology in normal Eyes Using Optical Coherence Tomography Angiography. Retina, 35, 2188-2195.
[9] Carpineto, P., Mastropasqua, R., Marchini, G., Toto, L., Di Nicola, M. and DiAnto-nio, L. (2016) Reproducibility and Repeatability of Foveal Avascular Zone Mea-surements in Healthy Subjects by Optical Coherence Tomography Angiography. British Journal of Ophthalmology, 100, 671-676.
[10] Coscas, F., et al. Optical Coherence Tomography Angiography in Retinal Vein Oc-clusion: Evaluation of Superficial and Deep Capillary Plexa. American Journal of Ophthalmology, 161, e161-e162.
[11] Balaratnasingam, C., et al. (2016) Visual Acuity Is Correlated with the Area of the Foveal Avascular Zone in Diabetic Retinopathy and Retinal Vein Occlusion. Oph-thalmology, 123, 2352-2367. https://doi.org/10.1016/j.ophtha.2016.07.008
[12] Al-Sheikh, M., Akil, H., Pfau, M. and Sadda, S.R. (2016) Swept-Source OCT Angio-graphy Imaging of the Foveal Avascular Zone and Macular Capillary Network Den-sity in Diabetic Retinopathy. Investigative Ophthalmology & Visual Science, 57, 3907-3913. https://doi.org/10.1167/iovs.16-19570
[13] Tan, C.S., Lim, L.W., Chow, V.S., et al. (2016) Optical Coherence Tomography An-giography Evaluation of the Parafoveal Vasculature and Its Relationship with Ocu-lar Factors. Investigative Ophthalmology & Visual Science, 57, OCT224-OCT234. https://doi.org/10.1167/iovs.15-18869
DOI: 10.4236/ojoph.2018.83017 139 Open Journal of Ophthalmolog Density and Foveal Avascular Zone Area Are Age-Dependent: Quantitative Analy-sis Using Optical Coherence Tomography Angiography. Investigative Ophthalmol-ogy & Visual Science, 57, 5780-5787. https://doi.org/10.1167/iovs.16-20045