Sensitivity Analysis for Systems under Epistemic
Uncertainty with Probability Bounds Analysis
Geng Feng
Department of Engineering Mathematics, School of Engineering, University of Bristol,
Bristol, United Kingdom
ABSTRACT
It is of paramount important to identify and rank the influence of components on the performance of interest. System sensitivity analysis provides a quantitative tool for accessing the importance of components within a specific system configuration. In practice, however, due to lack of information, there exist epistemic uncer-tainty within the components distribution parameters, which makes it is hard to estimate the reliability of the corresponding system. In this paper, survival signature is adopted to evaluate the system per-formance, and the area value of the probability box is introduced to reflect the epistemic uncertainty of the system. Also, in order to find out which component or components set is more sensitive to the system, the probability bounds analysis which bases on pinch-ing method is used. Two case studies are presented to show the applicability of the approaches.
Keywords
Sensitivity Analysis, Epistemic Uncertainty, Probability Bounds Analysis, Systems Reliability
1. INTRODUCTION
In large and complex engineering systems composed by a large number of components, it is of paramount important to identify and rank their influence on the system performance. System sensitivity analysis is a method to assess the sensitivity of a system to changes to its component parameters. In other words, sensitivity analysis is a quantitative study of how the inputs of a model influence the outputs of interest [21].
Most existing models assume that there are precise parameter val-ues available, so the quantification of uncertainty is mostly done by the use of precise probabilities [10]. However, due to lack of perfect knowledge, imprecision within the components failure time or their distribution parameters. Hence, the sensitivity analysis for the whole system is affected by the so called epistemic uncertainty [14].
In order to deal with the epistemic uncertainty, the Dempster-Shafer approach to representing uncertainty was articulated by Dempster [11] and Shafer [27]. A robust Bayesian approach to modelling epistemic uncertainty in common-cause failure models was pre-sented by Troffaes et al. [30]. Tonon [29] used random set theory to propagate epistemic uncertainty through a mechanical system. Hel-ton et al. [18] combined sensitivity analysis with evidence theory to
represent epistemic uncertainty. Fuzzy set theory is also proposed to deal with uncertainty in [4, 22]. An integrated framework to deal with scarce data, aleatory and epistemic uncertainties is presented in [23, 24], and it is an efficient tool to perform uncertainty man-agement of large finite element models.
Beyond of the above methods, William and Downs [31] introduced interval-type bounds on cumulative distribution functions, which is called “probability boxes” or “p-boxes” for short. The use of p-box in risk analysis offers many significant advantages over a traditional probabilistic approaches because it provides convenient and comprehensive ways to handle several of the most practical se-rious problems face by analysts [16]. For example, Karanki et al. [20] expressed uncertainty analysis based on p-box in probabilis-tic safety assessment. Evidential networks for reliability analysis and performance evaluation of systems with imprecise knowledge was introduced by Simon and Weber [28]. In order to make a quan-tification of margins and uncertainties, Sentz and Ferson [26] pre-sented probabilistic bounding analysis (PBA), which also can be used to perform the sensitivity analysis of systems. This approach represents the uncertainty about a probability distribution by a set of cumulative distribution functions lying entirely within a pair of bounding distributions [17]. Ali et al. [1] used PBA for radiological risk assessment.
Recently, survival signatures [7] have received more and more at-tention in system reliability analysis not only because they sepa-rate the system’s structure from its probabilistic characteristics, but also because they are suitable to deal with complex systems with multiple types of components. There are some developments on this method. Aslett developed a Reliability Theory package which was used to calculate the survival signature [2] and analysed sys-tem reliability within the Bayesian framework of statistics [3]. A non-parametric predictive inference for system reliability using the survival signature was proposed by Coolen and Coolen-Maturi [9]. Feng et al. [12] dealt with the imprecision within the system based on survival signature and presented new component importance measures. Some efficient simulation approaches which based on survival signature for reliability analysis on large system were pre-sented by Patelli et al. [25]. Coolen and Coolen-Maturi [8] linked the (imprecise) probabilistic structure function to the survival sig-nature.
the survival functions, and it is necessary to find out which compo-nent with imprecision is more sensitive to the system reliability. In order to solve the above problem, this paper represents the epis-temic uncertainty by probability box (p-box). To be specific, the area of p-box, which denotes asAP B, reflects the degree of the epistemic uncertainty. the p-boxes of the components inputs are propagated to the output of the system which bases on the sur-vival signature. Then, it is easy to know the former p-box value of
Abef oreP B . Since the decision maker may wants to reduce the epis-temic uncertainty, it can replace the imprecise distribution parame-ter of a specific component or components set with the precise dis-tribution parameter. Then we can get the new p-box and calculate theAaf terP B . Therefore, it is easy to know the percentage reduction and find out the most sensitive component or components set. The applicability of the proposed approach is demonstrated by solving the numerical examples.
This remainder of the paper is organized as follows. Section 2 gives a brief conceptions about the probability box and survival signa-ture. The probability bounds method based sensitivity analysis is presented in Section 3. In Section 4, a typical complex system is conducted to show the applicability and performance of the pro-posed approach. Finally, the paper is concluded in Section 5 with some discussions.
2. PROBABILITY BOX AND SURVIVAL SIGNATURE
2.1 Probability Box
SupposeX is an uncertain event with0≤P(X) ≤P(X)≤ 1, whereP(X)is called the lower probability for eventXandP(X)
is upper probability for eventX. When the functionsP(X)and
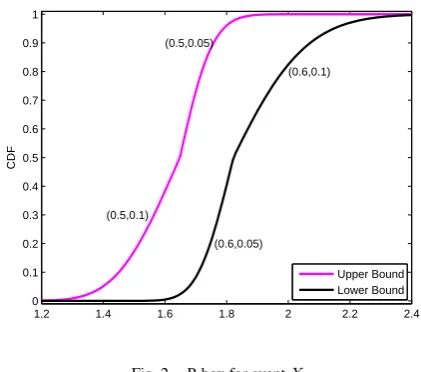
P(X)circumscribe an imprecisely known probability distribution, we call[P(X), P(X)], specified by the pair of functions, a “prob-ability box” or “p-box” for that distribution [15]. For instance, let assumeXis Lognormal distribution with imprecise parameters are ([0.5,0.6], [0.05,0.1]), the p-box of eventXis calculated by taking all combinations of (0.5, 0.05), (0.6, 0.05), (0.5, 0.1) and (0.6, 0.1) into account. Figure 1 reflects all the combination of distributions for eventX, while Figure 2 shows the p-box for eventX.
1.2 1.4 1.6 1.8 2 2.2 2.4 0
0.1 0.2 0.3 0.4 0.5 0.6 0.7 0.8 0.9 1
CDF
[image:2.595.327.538.75.261.2]Lognormal(0.6,0.1) Lognormal(0.5,0.05) Lognormal(0.6,0.05) Lognormal(0.5,0.1)
Fig. 1. All combination of distributions for eventX
1.2 1.4 1.6 1.8 2 2.2 2.4 0
0.1 0.2 0.3 0.4 0.5 0.6 0.7 0.8 0.9 1
CDF
(0.5,0.1) (0.5,0.05)
(0.6,0.05) (0.6,0.1)
Upper Bound Lower Bound
Fig. 2. P-box for eventX
2.2 Survival Signature
Suppose there is a system withm components which belong to
K ≥ 2 component types, with mk components of type k ∈
{1,2, ..., K}andPK
k=1mk = m. Assume that the random fail-ure times of components of the system type are exchangeable, while full independence is assumed for components belong to different types (iid), [7] proposed the survival signature which can be denoted by Φ(l1, l2, ..., lK), with lk = 0,1, ..., mk for
k = 1,2, ..., K. It defines the probability that the system func-tions given that lk of its mk components of type k work, for each k ∈ {1,2, ..., K}. There are mk
lk
state vectors xk with Pmk
i=1x
k
i =lk(k= 1,2, ..., K), wherexk = (xk1, xk2, ..., xkmk). LetSl1,l2,...,lKdenote the set of all state vectors for the whole sys-tem, and it can be known that all the state vectorsxk ∈ Sk
lk are equally likely to occur. Therefore, the survival signature can be ex-pressed as:
Φ(l1, ..., lK) = [ K Y
k=1
mk
lk −1
]× X
x∈Sl1,...,lK
φ(x) (1)
LetCk(t) ∈ {0,1, ..., mk}denote the number ofk components working at timet. Assume that the components of typekhave a known cumulative distribution function (CDF)Fk(t)and the com-ponents failure times of different type are assumed independent, then:
P(
K \
k=1
{Ck(t) =lk}) = K Y
k=1
P(Ck(t) =lk) =
K Y
k=1
mk
lk
[Fk(t)]mk−lk[1−Fk(t)]lk (2)
Hence, the survival function of the system withKtypes of compo-nents becomes:
P(t) =
m1
X
l1=0
...
mK X
lK=0
[image:2.595.66.276.491.657.2]P(
K \
k=1
{Ck(t) =lk}) (3)
Equation 3 shows that the structure of the system is separated from the its components failure times, which is the typical advantage of the survival signature. The survival signature is a summary of structure functions and only needs to be calculated once for the same system. As a result, it is an efficient method to perform system reliability analysis on complex systems with multiple component types.
2.3 Represent Epistemic Uncertainty by P-box
For the uncertain eventX,∆(X) =P(X)−P(X)is called the imprecision for the uncertain eventX[6]. Since epistemic uncer-tainty reflects the unsureness in the predicted reliability, a decision maker might want to reduce it by investing resource to more accu-rately estimate the value of each event parameter [33].
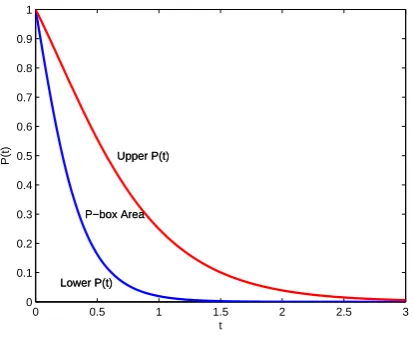
[image:3.595.67.274.349.519.2]As for the system reliability, the survival function is time varying, which can be seen in Equations 2 and 3. The epistemic uncertainty within the components failure time distribution parameters prop-agates to the survival function of the systemP(t). The epistemic uncertainty will lead to the lower and upper bound of the survival function, which can be expressed byP(t)andP(t)respectively. Figure 3 shows an example of the p-box of the system survival function.
0 0.5 1 1.5 2 2.5 3 0
0.1 0.2 0.3 0.4 0.5 0.6 0.7 0.8 0.9 1
t
P(t) Upper P(t)
P−box Area
Lower P(t) Upper P(t)
P−box Area
Lower P(t)
Fig. 3. Example of p-box of the system survival function
The area of p-box, denoted byAP B, reflects the degree of the epis-temic uncertainty. To be specific, to calculate the survival function of a time dependent system which is described by p-box, the time interval is discretized into several subintervals, the minimum and maximum difference value at each subinterval can be got. Then summarize the product of difference value and its corresponding subintervals, which can get the value ofAP B. The more knowledge or information on the failure time distribution, the smaller area of the p-box. If there exist no epistemic uncertainty, which means the precise values of the components failure distribution parameters are known to us, the area of p-boxAP Bwill shrink to zero.
Since it is clear thatP(t)≤P(t)≤P(t), andP(t)reflects the re-liability of the system at different timet, theAP Bcan be expressed by the following Equation.
AP B= Z ∞
0
[P(t)−P(t)]dt (4)
It can be seen from Equation 4 thatAP Bis the difference between the estimated upper and lower survival functions of the system in presence of epistemic uncertainty.
3. PROBABILITY BOUNDS ANALYSIS AS SENSITIVITY ANALYSIS
Ferson and Donald [13] developed probability bounds analysis (PBA) which can produce bounds around the output distribution from an assessment. These bounds enclose all the possible distribu-tions that could actually arise given what is known and what is not known about the model (system)and its inputs (components failure distribution parameters). Therefore, PBA represents uncertainty by using a p-box.
PBA is a combination of probability theory and interval analysis, and the main advantage of PBA is that it separates aleatory uncer-tainty from epistemic unceruncer-tainty and propagates them differently, thus each maintains its own characters [19].
System sensitivity analysis is a systematic study of how the inputs of the system influence the reliability of the system. Therefore, sys-tem sensitivity analysis has two fundamental features: one is to find out how the reliability and function of the system is influenced by the inputs, and another is to focus on improving estimates of inputs which will lead to the most improvement of the system reliability. Because of the obvious and fundamental importance of sensitivity analysis on systems, it is essential and of interest to perform a sen-sitivity analysis on the systems by combining with the probability bounds analysis. This paper uses pinch strategy to assess the impact of epistemic uncertainty on the systems.
As we known before, the epistemic uncertainty within the compo-nents failure time distribution will lead to lower and upper survival function bounds of the system, and the epistemic uncertainty de-gree can be quantified byAP B. If there are extra information or data are available on an input, there will be less uncertainty degree of the whole system, which also means theAP B will decrease. Therefore, it is doable to compare the value difference before and after “pinching” an input, i.e., replacing the uncertain input with a point value or with a precise distribution distribution function. Pinching can be applied to each input and the maximum reduction of uncertainty of the system is regarded as the most sensitive input of the system.
The estimate of the value of information for a parameter will de-pend on how much uncertainty within the parameter, and how it influences the uncertainty in the system reliability. The reduction or sensitivity can be expressed by Equation 5.
100
1− A af ter P B
Abef oreP B
% (5)
whereAbef oreP B is the former p-box value ofAP B, whileAaf terP B
Table 1. Survival signature of the typical complex system in Figure 4
l1 l2 l3 Φ(l1, l2, l3)
0 0 0 0
0 0 1 0
0 1 0 0
0 1 1 0
0 2 0 0
0 2 1 0
1 0 0 0
1 0 1 0
1 1 0 1/2
1 1 1 1
1 2 0 1
1 2 1 1
2 0 0 0
2 0 1 0
2 1 0 1
2 1 1 1
2 2 0 1
2 2 1 1
analysis on components set of the system, and then locate which components set is more sensitive. Therefore, it can use sensitivity index (SI) to represent Equation 5.
4. NUMERICAL EXAMPLES
Figure 4 shows a circuit bridge system, which is a typical complex system with three component types.
2
3
4
5
1
1
1
2
3
[image:4.595.309.565.83.201.2]2
Fig. 4. A typical complex system: the number outside the box is the com-ponent index, while the number inside the box represents the comcom-ponent type.
The components are all according to Exponential distribution, if there exist epistemic uncertainty within the parameters, the impre-cise and preimpre-cise distribution parameters of all components can be seen in Table 2.
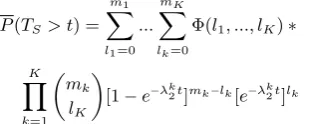
According to stochastic dominance theory [32] which has been ver-ified in [12], the lower bound of the survival function for the sys-tem, with components parametersλk∈[λk
1, λk2], is
P(TS> t) = m1
X
l1=0
...
mK X
lk=0
[image:4.595.356.511.234.296.2]Φ(l1, ..., lK)∗
Table 2. Imprecise and precise distribution parameters of all components in the typical complex system Component
in-dex
Component type
Imprecise param-eter
Precise parame-ter
1 1 [0.24, 0.50] 0.37
2 1 [0.24, 0.50] 0.37
3 2 [0.18, 0.55] 0.365
4 2 [0.18, 0.55] 0.365
5 3 [0.21, 0.45] 0.33
K Y
k=1
mk
lK
[1−e−λk1t]mk−lk[e−λk1t]lk (6)
The corresponding upper bound of the survival function becomes:
P(TS> t) = m1
X
l1=0
...
mK X
lk=0
Φ(l1, ..., lK)∗
K Y
k=1
mk
lK
[1−e−λk2t]mk−lk[e−λk2t]lk (7)
The bounds of imprecise survival function and precise survival function of the typical system can be seen in Figure 5.
0 0.2 0.4 0.6 0.8 1 1.2 1.4 1.6 1.8 0
0.1 0.2 0.3 0.4 0.5 0.6 0.7 0.8 0.9 1
Time t
Survival Funtion P(Ts>t)
Lower Bound of Survival Function Uppper Bound of Survival Function Precise Survival Function
Fig. 5. The bounds of imprecise survival function and precise survival function of the typical system
The area of p-boxAbef oreP B = 0.2551by using Equation 4, which reflects the degree of the epistemic uncertainty. Then let perform sensitivity analysis on specific component and components set un-der epistemic uncertainty with probability bounds analysis.
4.1 Sensitivity Analysis on Specific Component
Let replace the imprecise input with a precise distribution parame-ter of each component, as shows in Table 2.
[image:4.595.326.551.344.511.2] [image:4.595.54.293.382.532.2]0 0.2 0.4 0.6 0.8 1 1.2 1.4 1.6 1.8
Time t
0 0.1 0.2 0.3 0.4 0.5 0.6 0.7 0.8 0.9 1
Survival Funtion P(Ts>t)
[image:5.595.57.293.64.257.2]Former Lower Bound Former Upper Bound Lower Bound Uppper Bound
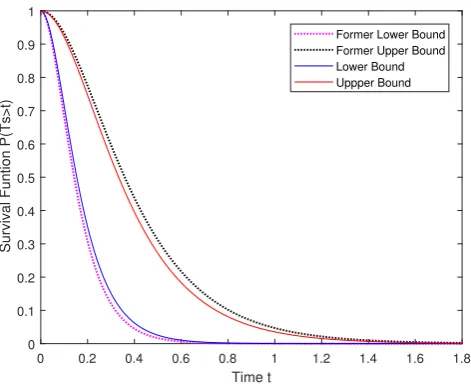
Fig. 6. The p-box of the system survival function when component 1 is pinched by a precise distribution
Therefore, it can be got thatAaf terP B1 = 0.2112through Equation 4. The sensitivity index of component 1 can be calculated by Equation 5, which is17.209%.
Similarly, the sensitivity index of component 2, 3, 4 and 5 is
17.21%,27.95%,27.95% and4.98%respectively. Thus, the se-quence of each component’s sensitivity index isSI3 = SI4 > SI1 = SI2 > SI5, which means components 3 and 4 are more sensitive than other three components.
4.2 Sensitivity Analysis on Components Set
It is sometimes important to analyse the sensitivity degree of differ-ent compondiffer-ents sets to the system. For instance, if people want to know the sensitivity index of these five different components sets: C[1,3], C[2,4,5], C[1,2], C[3,4] and C[5], it is necessary to replace the imprecise distribution parameters of components in each set with precise distribution parameter, which can also see in Table 2. Pinching component 1 and component 3 to a distribution with pre-cise parameter, to be specific, component 1 with Exponential(0.37) while component 3 with Exponential(0.33). Then calculate the lower and upper bounds of the system survival function, which shows in Figure 7.
Here it can see that the area of p-box shrinks a lot compared to the initial one, to be specific,Aaf terP B13= 0.1321after quantization calculation. Therefore, the percentage reduction is48.22%. Similarly as the above case, compare with the former epistemic uncertainty degreeAbef oreP B , the percentage reduction is53.19%,
34.89%,55.27% and4.98% for the other four components sets, which meansSIC[3,4] > SIC[2,4,5] > SIC[1,3] > SIC[1,2] > SIC[5]. Engineers should pay more attention on components sets
C[3,4] and C[2,4,5] as they are more sensitive than the other com-ponents sets.
5. CONCLUSIONS
Sensitivity analysis on complex systems is essential in real engi-neering applications. Engineers often perform sensitivity analysis to explore how changes in the inputs of the component affect the outputs of the system. Most former works mainly focus on com-ponents with precise distribution parameters, however, there
ex-0 0.2 0.4 0.6 0.8 1 1.2 1.4 1.6 1.8
Time t
0 0.1 0.2 0.3 0.4 0.5 0.6 0.7 0.8 0.9 1
Survival Funtion P(Ts>t)
[image:5.595.315.555.66.259.2]Lower Bound Uppper Bound
Fig. 7. The p-box of the system survival function when components set C[1,3] is pinched by a precise distribution
ist epistemic uncertainty within the components distribution due to lack of information. The epistemic uncertainty within the com-ponents will lead to reliability bounds (which is called p-box) of the corresponding system.
This paper uses the area of the p-box to reflect the epistemic uncer-tainty degree. The lower and upper survival function of the complex system can be calculated based on the survival signature, which leads to former area value of p-boxAbef oreP B . In order to find out which component or components set is more sensitive to the sys-tem, the probability bounds analysis which bases on pinching the-ory is introduced, therefore, the new p-box andAaf terP B can be cal-culated. Two cases have been studied to show applicability of sen-sitivity analysis for systems under epistemic uncertainty with prob-ability bounds analysis. There are also some interesting works to do in the future. For example, the distribution type of Exponential dis-tribution can be extended to other disdis-tribution types. Also, there are maybe some other methods to represent the epistemic uncertainty in the systems.
6. ACKNOWLEDGEMENT
The author would like to thank Professor Scott Ferson’s initial in-troduction of probability bounds analysis, Professor Michael Beer and Professor Frank P.A. Coolen’s guidance of imprecision theory.
7. REFERENCES
[1] Tazid Ali, Hrishikesh Boruah, and Palash Dutta. Sensitiv-ity analysis in radiological risk assessment using probabilSensitiv-ity bounds analysis.International Journal of Computer Applica-tions, 44(17), 2012.
[2] Louis J.M. Aslett. Reliabilitytheory: Tools for structural reli-ability analysis. r package, 2012.
[4] Michael Beer, Scott Ferson, and Vladik Kreinovich. Impre-cise probabilities in engineering analyses.Mechanical sys-tems and signal processing, 37(1):4–29, 2013.
[5] Daniele Binosi and Joannis Papavassiliou. Pinch technique: theory and applications. Physics Reports, 479(1):1–152, 2009.
[6] FPA Coolen. On the use of imprecise probabilities in re-liability. Quality and Reliability Engineering International, 20(3):193–202, 2004.
[7] Frank P.A. Coolen and Tahani Coolen-Maturi. Generaliz-ing the signature to systems with multiple types of compo-nents. InComplex Systems and Dependability, pages 115– 130. Springer, 2012.
[8] Frank PA Coolen and Tahani Coolen-Maturi. The structure function for system reliability as predictive (imprecise) proba-bility.Reliability Engineering & System Safety, 154:180–187, 2016.
[9] Frank P.A. Coolen, Tahani Coolen-Maturi, and Abdullah H Al-Nefaiee. Nonparametric predictive inference for system reliability using the survival signature.Proceedings of the In-stitution of Mechanical Engineers, Part O: Journal of Risk and Reliability, 228(5):437–448, 2014.
[10] Frank PA Coolen, Matthias CM Troffaes, and Thomas Au-gustin. Imprecise probability. InInternational encyclopedia of statistical science, pages 645–648. Springer, 2011. [11] Arthur P Dempster. Upper and lower probabilities induced by
a multivalued mapping.The annals of mathematical statistics, pages 325–339, 1967.
[12] Geng Feng, Edoardo Patelli, Michael Beer, and Frank PA Coolen. Imprecise system reliability and component impor-tance based on survival signature.Reliability Engineering & System Safety, 150:116–125, 2016.
[13] S Ferson and S Donald. Probability bounds analysis. In Inter-national Conference on Probabilistic Safety Assessment and Management (PSAM4), pages 1203–1208, 1998.
[14] Scott Ferson and Lev R Ginzburg. Different methods are needed to propagate ignorance and variability.Reliability En-gineering & System Safety, 54(2):133–144, 1996.
[15] Scott Ferson and Janos G Hajagos. Arithmetic with uncertain numbers: rigorous and (often) best possible answers. Relia-bility Engineering & System Safety, 85(1):135–152, 2004. [16] Scott Ferson, Vladik Kreinovich, Lev Ginzburg, Davis S
Myers, and Kari Sentz.Constructing probability boxes and Dempster-Shafer structures, volume 835. Sandia National Laboratories, 2002.
[17] Scott Ferson and W Troy Tucker. Sensitivity analysis us-ing probability boundus-ing.Reliability Engineering & System Safety, 91(10):1435–1442, 2006.
[18] Jon C Helton, Jay D Johnson, WL Oberkampf, and C´edric J Sallaberry. Sensitivity analysis in conjunction with evidence theory representations of epistemic uncertainty. Reliability Engineering & System Safety, 91(10):1414–1434, 2006. [19] F Owen Hoffman and Jana S Hammonds. Propagation of
un-certainty in risk assessments: the need to distinguish between uncertainty due to lack of knowledge and uncertainty due to variability.Risk analysis, 14(5):707–712, 1994.
[20] Durga Rao Karanki, Hari Shankar Kushwaha, Ajit Kumar Verma, and Srividya Ajit. Uncertainty analysis based on prob-ability bounds (p-box) approach in probabilistic safety assess-ment.Risk Analysis, 29(5):662–675, 2009.
[21] Edward E Leamer. Sensitivity analyses would help. The American Economic Review, 75(3):308–313, 1985.
[22] Bernd M¨oller and Michael Beer. Fuzzy randomness: un-certainty in civil engineering and computational mechanics. Springer Science & Business Media, 2013.
[23] Edoardo Patelli, Diego A Alvarez, Matteo Broggi, and Marco de Angelis. An integrated and efficient numerical framework for uncertainty quantification: application to the nasa langley multidisciplinary uncertainty quantification challenge. In16th AIAA Non-Deterministic Approaches Conference (SciTech 2014), pages 2014–1501, 2014.
[24] Edoardo Patelli and Geng Feng. Efficient simulation ap-proaches for reliability analysis of large systems. In Inter-national Conference on Information Processing and Man-agement of Uncertainty in Knowledge-Based Systems, pages 129–140. Springer, 2016.
[25] Edoardo Patelli, Geng Feng, Frank PA Coolen, and Tahani Coolen-Maturi. Simulation methods for system reliability us-ing the survival signature.Reliability Engineering & System Safety, 167:327–337, 2017.
[26] Kari Sentz and Scott Ferson. Probabilistic bounding analysis in the quantification of margins and uncertainties.Reliability Engineering & System Safety, 96(9):1126–1136, 2011. [27] Glenn Shafer et al.A mathematical theory of evidence,
vol-ume 1. Princeton university press Princeton, 1976.
[28] Christophe Simon and Philippe Weber. Evidential networks for reliability analysis and performance evaluation of systems with imprecise knowledge.IEEE Transactions on Reliability, 58(1):69–87, 2009.
[29] Fulvio Tonon. Using random set theory to propagate epis-temic uncertainty through a mechanical system. Reliability Engineering & System Safety, 85(1):169–181, 2004. [30] Matthias CM Troffaes, Gero Walter, and Dana Kelly. A
ro-bust bayesian approach to modeling epistemic uncertainty in common-cause failure models.Reliability Engineering & System Safety, 125:13–21, 2014.
[31] Robert C Williamson and Tom Downs. Probabilistic arith-metic. i. numerical methods for calculating convolutions and dependency bounds. International journal of approximate reasoning, 4(2):89–158, 1990.
[32] Elmar Wolfstetter et al.Stochastic dominance: theory and ap-plications. Humboldt-Univ., Wirtschaftswiss. Fak., 1993. [33] Qingyuan Zhang, Zhiguo Zeng, Enrico Zio, and Rui Kang.