BIHARMONIC FUNCTION OF PROTEIN IN MOCORIN AND ITS OPTIMIZATION
1
Department of Mathematics, Science and Mathematics Faculty
Jl. Diponegoro 52
2
Department of Chemistry, Science and Mathematics Faculty
Jl. Diponegoro 52
ARTICLE INFO ABSTRACT
Nutritional values of MOCORIN (Modification Of Bisi 2 Variety Yellow Corn (Zea Mays
protein.
mass from 5 types of data which are mixtures of yellow corn and rice bran. There are 5 types proportion used in the observation. The proportions of rice bran are 0% (only yellow corn),
best proportion with maximum protein leading to optimization problem. By assuming protein follows a biharmonic function, the function is possible to be conve
Therefore one can
properties are used and the result shows that 37.5% of rice bran is the best proportion.
Copyright © 2014 Parhusip and Hartini. This is an open access
use, distribution, and reproduction in any medium, provided the original work is properly cited.
INTRODUCTION
There are two objective functions required to set up optimization problem based on the given data,
objective function is due to parameter determination and the second one is due to optimal values of the obtained objective function after the parameters are found. Before solving the second optimization problem, some basic properties known, i.e. convexity of the chosen objective function convex domain leading to minimum value of the objective function and a concave function in a concave domain leading to maximum value. However two properties may be hold locally in some sub domains. This situation
paper since the given data provide these two properties, convexity and concavity of the obtained objective function. Hence to model a minimization problem one needs convexity of an objective function and only some data satisfy convexity. Five sets of data are taken from observation of nutritional values of MOCORIN (Modification Of Bisi 2 Variety Yellow Corn (Zea Mays L.) - Rice Bran Flour)
Department of SWCU 2012 where some experiments were set up to study moisture content, mineral content
by biuret method, fat content, carbohydrate content method, fiber content and making of “cat's tongue”
*Corresponding author: Parhusip,
Department of Mathematics, Science and Mathematics Faculty, Satya Wacana Christian University, Jl.Diponegoro 52-60 Salatiga 50711, Indonesia
ISSN: 0975-833X
Article History:
Received 22nd August, 2014 Received in revised form 29th September, 2014 Accepted 14th October, 2014 Published online 18th November,2014
Key words:
Protein, Carbohydrate,Convexity, Concavity, Lagrangian, Interpolation, Hessian Matrix.
RESEARCH ARTICLE
BIHARMONIC FUNCTION OF PROTEIN IN MOCORIN AND ITS OPTIMIZATION
1,*
Parhusip and
2Hartini
Science and Mathematics Faculty, Satya Wacana Christian University
Diponegoro 52-60 Salatiga 50711, Indonesia
Department of Chemistry, Science and Mathematics Faculty, Satya Wacana Christian University
Diponegoro 52-60 Salatiga 50711, Indonesia
ABSTRACT
Nutritional values of MOCORIN (Modification Of Bisi 2 Variety Yellow Corn
Zea Mays L.) - Rice Bran Flour) are studied based on the used mass
in. Optimal protein in MOCORIN is studied due to the observed carbohydate and mass from 5 types of data which are mixtures of yellow corn and rice bran. There are 5 types proportion used in the observation. The proportions of rice bran are 0% (only yellow corn), 12.5%,25%,37.5%, 50% respectively . The purpose of the research is to determine best proportion with maximum protein leading to optimization problem. By assuming protein follows a biharmonic function, the function is possible to be conve
Therefore one cannot have only maximum value of protein. Hessian matrix and convexity properties are used and the result shows that 37.5% of rice bran is the best proportion.
is an open access article distributed under the Creative Commons Attribution License, which permits unrestricted use, distribution, and reproduction in any medium, provided the original work is properly cited.
There are two objective functions required to set up optimization problem based on the given data, i.e. the first ion is due to parameter determination and the second one is due to optimal values of the obtained objective function after the parameters are found. Before solving the some basic properties must be chosen objective function in a to minimum value of the objective nction in a concave domain leading to maximum value. However two properties may be hold domains. This situation is found in this paper since the given data provide these two properties, i.e. convexity and concavity of the obtained objective function. Hence to model a minimization problem one needs convexity of an objective function and only some data satisfy convexity.
sets of data are taken from observation of nutritional values of MOCORIN (Modification Of Bisi 2 Variety Yellow Rice Bran Flour) in Chemistry Department of SWCU 2012 where some experiments were set l content, protein content carbohydrate content by anthrone
cat's tongue” cookies.
Department of Mathematics, Science and Mathematics Faculty, Satya 60 Salatiga 50711,
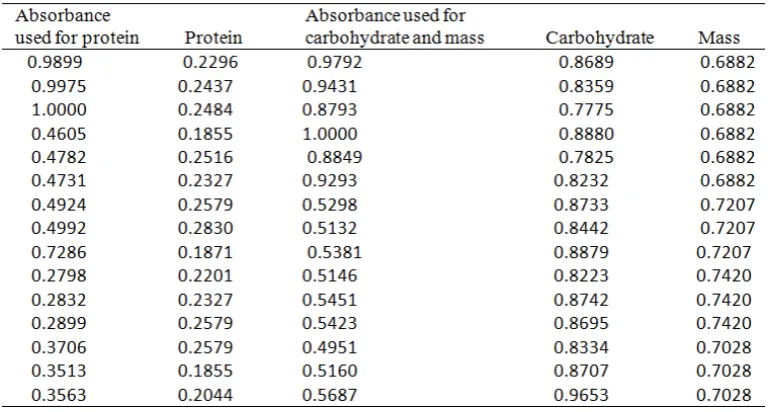
The materials were the mixtures between yellow corn and rice bran with proportion 0%,12.5%,25%, 37.5%, 50% respectively (Silvia, 2012). Since there are 5 sets of data, there will be 5 objective functions to optimize. Each set has a set of parameters that relates to each objective function. We focus on this study by considering that the protein content depends on mass and carbohydrate contents. The
are determined due to the mass and carbohydrate in the materials and one yields best proportion. Some variables must be introduced which are all dimensi
in the interval (0,1], these are : and P:= protein.
In this research, we consider firstly that protein ( carbohydrate (K) and mass (M
function of absorbance as independent variable. By interpolating each variable to the used absorbance, protein is then considered to be dependent variable and carbohydrate and mass are its independent variable. Assuming protein biharmonic function of carbohydrate and mass, one has 5 continuous explicit form of objective functions.
of biharmonic function and some underline theories are shown in the next sections. The results of its optimization are discussed in the analysis.
International Journal of Current Research
Vol. 6, Issue, 11, pp.9694-9700, November,2014
BIHARMONIC FUNCTION OF PROTEIN IN MOCORIN AND ITS OPTIMIZATION
Satya Wacana Christian University,
Satya Wacana Christian University,
Nutritional values of MOCORIN (Modification Of Bisi 2 Variety Yellow Corn studied based on the used mass, i.e. carbohydrate and
Optimal protein in MOCORIN is studied due to the observed carbohydate and mass from 5 types of data which are mixtures of yellow corn and rice bran. There are 5 types proportion used in the observation. The proportions of rice bran are 0% (only yellow 12.5%,25%,37.5%, 50% respectively . The purpose of the research is to determine best proportion with maximum protein leading to optimization problem. By assuming protein follows a biharmonic function, the function is possible to be convex or concave. not have only maximum value of protein. Hessian matrix and convexity properties are used and the result shows that 37.5% of rice bran is the best proportion.
article distributed under the Creative Commons Attribution License, which permits unrestricted
The materials were the mixtures between yellow corn and rice bran with proportion 0%,12.5%,25%, 37.5%, 50%
2012). Since there are 5 sets of data, there l be 5 objective functions to optimize. Each set has a set of parameters that relates to each objective function. We focus on this study by considering that the protein content depends on d carbohydrate contents. The optimal values of protein etermined due to the mass and carbohydrate in the yields best proportion. Some variables must introduced which are all dimensionless, i.e. all variables are in the interval (0,1], these are : M := mass ; K:= carbohydrate;
In this research, we consider firstly that protein (P), ) and mass (M) are dependent variables as function of absorbance as independent variable. By interpolating each variable to the used absorbance, protein is then considered to be dependent variable and carbohydrate and mass are its independent variable. Assuming protein as a biharmonic function of carbohydrate and mass, one has 5 of objective functions. Construction of biharmonic function and some underline theories are shown in the next sections. The results of its optimization are
DESIGN OF OBJECTIVE FUCTION AND ITS OPTIMIZATION
Construction of Biharmonic function for model of protein in MOCORIN
Biharmonic function can be considered as a solution of biharmonic operator in the form of forth order of partial differential equation. One possible solution is a linear combination of Green functions centered at each data point for one dimensional biharmonic operator. In two dimensional case, Green functions were applied to create interpolation technique (Sandwell, 1987) to produce and accurate sea surface topography maps from satellite altimeter profiles. In this paper, the biharmonic function is the solution of the forth order of partial differential equation in the form
0 2 4 4 2 2 4 4 4 M P K M P K
P ………..………… (1)
The analytic representation of P(K,M) had been known (Ugail,2006) and its representation was a combination of a separable function, i.e
) sin( ) ( ) cos( ) ( ) ,
(K M X K nM X K nM
P …….…….…
(2)
where n is an integer number and X(K) was also investigated (Ugail, 2006), that is
nK nK nK nK Ke c e c Ke c e c K
X
1 2 3 4
) (
. ……… (3)
The parameters are
c
1,
c
2,
c
3,
c
4 and n were analyticallycompletely defined. However in order to simplify the procedure, we use least square method to find the best
4 3 2 1
,
c
,
c
,
c
c
. As soon as these parameters are found, minimize
2 1 model , data ,
N i i iP
P
R
……….…… (4)where
P
i,model given by Eq. (2)-(3) . Denotingy
to be the vector in R with each component is
i
y
P
i,data
P
i,model,
i
,then Eq.(4) in vector form is
R
y
Ty
and the best parametersc
1,
c
2,
c
3,
c
4 must satisfy0
R
. Solving this nonlinear system leads to find critical solution of R.Optimization of biharmonic function with Karush Kuhn Tucker theorem
Karush Kuhn-Tucker theorem (Peressini,et.al.1987) guarantees the existence of solution in the convex domain (D) due to the minimization Lagrangian
n i i ig K MM K f M K L 1 ) , ( ) , ( ) , ,
( as a convex program, i.e.:
minimize f(K,M) ……….…..(5)
subject to the constraints 0
) , (K M
gi ………(6)
where
x
K
M
D
T
,
.
The optimizer x*
K* M*
T,
exists if only if there is a n
R
*
such that
i. * 0
ii. L(x*,)L(x*,*)L(x*,) for all xK,MTand for all
0
iii. *i
g
i(
x
*)
0
for i =1,2,...,m.The proof has been shown rigorously (Peressini,et.al,1987) and the fmincon.m function provided by MATLAB will be implemented to find the optimizers automatically without solving the gradient of L . The sufficient conditions for the
local optimal
x
*
K
*,
M
*
T
are
i. *
0
ii.
0
.
* *
I
i
x
g
ii
iii.
*0
.
1 * *
x
g
x
f
i m i i
The optimization result will be analyzed based on this theorem. Defining the problem into standard problem in Eq.(4) and Eq.(5) in fmincon.m, one yields the optimizers. Additionally, the convexity of the objective function is also required where
we assume that the given domain is a convex subset D of
R
n . By assumingf
(
K
,
M
)
has continuous first partial derivatives on D, then the functionf
(
x
)
f
(
K
,
M
)
is convex if and only if
y
x
f
y
f
x
f
(
)
for allx
,y
in D………. (6)One may recall the complete proof in the literature (Peressini,et.al,1987,pp.52-53). There exists another definition
of convexity which depends on a parameter and
f
is not required. For simplicity, we will use the definition given by Eq.(6). However the objective function needs to be maximized, and hence instead of convexity, one needs the objective function must be concave, which means that the inequality sign in Eq.(6) must be defined reversely. Unfortunately, each variable depends on the used absorbance. To reduce this difficulty, all necessary variables are interpolated as functions of absorbanceInterpolation of Protein, Carbohydrate and Mass into functions of absorbance
problem of solving the linear system
a
J
TJ
1J
Ty
and hence the approximation will be~
y
J
a
where J is a matrix with its –ith row contains
zi zi2 zi3ziM
1
(Yang et al., 2005). This type of interpolation is not good
enough for high oscillation data and small number of samples. Higher order polynomial frequently leads to singular matrix of
J
J
T for such data. We prefer to use spline interpolation for our data set. Exercises data are presented in Table 1. Table 1 gives us two sets of values of z which are given in the first column and the third column. Spline interpolation relies on piecewise cubic polynomial interpolation on each two pairs consecutive data where the derivatives of each polynomial on each subinterval are taken into account. One of examples in our research was that this method had been used to interpolate spectrum of
charoten through aceton (Parhusip et al. 2005). [image:3.595.325.538.73.145.2]Advantages of this method are that we do not need to choose any smooth function explicitly and additional data can be generated to fit with original data. The function is available in MATLAB 6.5 (or higher version) that can be used easily. Suppose some of the given data absorbance and the related carbohydrates are given in Table 1. The Spline method leads to generate additional data that depend on the used step size in the spline function provided by MATLAB. For instance, the number of original data is 15, the number of data becomes 721 by using step size 0.001 on absorbance. If the used step size too small (e.g. :0.001), the error of harmonic function is too big (> 30%) and hence we choose bigger step size. Using 0.01 step size of absorbance, the error harmonic function is 20.9628 %. The comparison of each data and the approximation is shown in Figure 4 and Figure 5. The error function becomes 21.0393% if we use step size 0.02. Numerical examples are shown in Figure 1-3. The spline curves present the protein and carbohydrate as functions of absorbance. Data are generated by spline will be used in Eq (2)-(3) to define the objective function.
Table 2. Variation error due to stepsize of absorbance
Size of stepsize Error of biharmonic function (%)
0.01 20.9628
0.02 21.0393
0.03 11.1217
0.04 31.5323
0.05 10.5954
0.06 33.0270
Protein as a Biharmonic function of carbohydrate and mass
In this case protein is assumed to be the dependent variable where mass and carbohydrate are the independent variables. To guarantee that the objective function is good enough, we observe for several step sizes and study the resulting errors as shown in Table 2. For the given data Table 1, we have the error may decrease for a bigger step size and hence we will vary the step size for the whole given data in the research which is shown in Results and Discussion.
Each set of data indicated by observation set of each proportion has some multiples values which lead to technical errors. The error is shown by comment MATLAB's spline() function complains that "the data sites should be distinct”. Referring to some comments of programmers in webs, one may replace the function spline with parametric representation of data and using interp1() function provided in MATLAB. Thus two kinds of interpolation functions are employed here to present protein, carbohydrate and mass as functions of absorbance.
RESULTS AND DISCUSSION
Convexity and concavity of biharmonic function
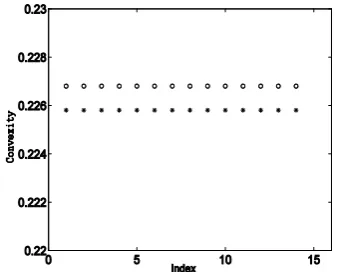
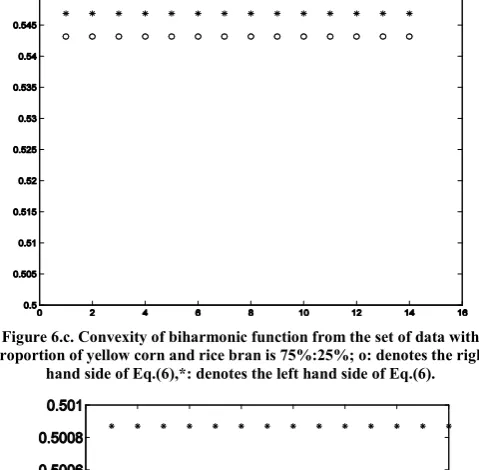
The convexity and concavity are required conditions for the existences of optimal of objective functions. Therefore here the convexity and concavity are studied for each set of data based on Eq.(6). Some observation are shown in the Figure 6.a-6.e. For 5 data sets, we have the biharmonic functions are possible
[image:3.595.107.492.316.522.2]to be convex and concave. Figure 6.a-6.c illustrate that the biharmonic functions for the first three data sets are convex. The forth data set is concave and the last one is nearly undetected. The practical application based on this result is that if the proportion of yellow corn and rice bran in the type of 87.5%:12.5% and 50%:50% then maximum protein will not be obtained. This research suggests that one may use 62.5%:37.5% for gaining maximum protein where mass and carbohydrate contents have been taken into account.
[image:4.595.47.284.186.334.2]Figure 1. Protein is fitted as a function of absorbance.
Figure 2. Carbohydrate is fitted as a function of absorbance
Figure 3. Spline interpolation of mass as a function of absorbance
[image:4.595.319.552.222.334.2]Figure 4. Protein is a harmonic function of carbohydrate and mass compared to data obtained by spline.
[image:4.595.50.280.372.557.2]Figure 5. Protein is a harmonic surface of carbohydrate and mass with error 20.9628%.
Figure 6.a. Convexity of biharmonic function from the set of data with proportion of yellow corn and rice bran is 100%:0%; o: denotes the right
[image:4.595.350.519.378.514.2]hand side of Eq.(6) ,*: denotes the left hand side of Eq.(6).
Figure 6.b. Convexity of biharmonic function from the set of data with proportion of yellow corn and rice bran is 87.5%:12.5%; o: denotes the
[image:4.595.42.291.592.702.2]Figure 6.c. Convexity of biharmonic function from the set of data with proportion of yellow corn and rice bran is 75%:25%; o: denotes the right
[image:5.595.310.556.156.241.2]hand side of Eq.(6),*: denotes the left hand side of Eq.(6).
Figure 6.d. Convexity of biharmonic function from the set of data with proportion of yellow corn and rice bran is 62.5%:37.5%; o: denotes the
[image:5.595.56.277.467.634.2]right hand side of Eq.(6),*: denotes the left hand side of Eq.(6).
Figure 6.e. Convexity of biharmonic function from the set of data with proportion of yellow corn and rice bran is 50%:50%; o: denotes the right
hand side of Eq.(6),*: denotes the left hand side of Eq.(6).
Construction of biharmonic function and its maximum
All observation data are used, i.e. each proportion contains observation of protein content, carbohydrate and mass contents. We have 5 sets of these type of data. Thus we have 5 sets of parameters in Eq.(2)-(3). Using lsqnonlin.m function provided by MATLAB, one obtains the parameters listed in
Table 3. These parameters are then implemented to the objective functions subject to the given constraints, i.e. the minimum of each independent variable. The objective function becomes : maximize protein subject to the constraints :
min
M
M
andK
K
min.Table 3. Parameter values in biharmonic function of each set of data and its error
Type of Mocorin (Proportion) Yellow corn: rice bran
Biharmonic parameters
Tc c c c c
c 1 2 3 4 5
function Error
(%)
0% -0.2724 0.4762 0.3118 1.7113 2 11.8218 12.5% -0.7571 0.8962 0.0454 6.4448 2 4.9585 25% -0.7528 0.8845 0.0575 6.4954 2 5.8468 37.5% -0.5355 0.7127 0.2671 4.0530 2 4.1528 50% -0.4049 0.5908 0.2061 3.1654 2 4.6074
Without these bounds, negative values may occur which are not realistic in practical application. The fmincon.m function is implemented to obtain minimum value of protein. Since the maximum value of protein of each set is 1, then the maximum will be 1 minus the obtained minimum and the result shown in Table 4. Table 4 shows the maximum protein with optimal carbohydrate and mass of each proportion. Mathematically, each surface has its own local maximum and local optimizer. Of course, we may consider 37.5 % addition of rice bran is the best proportion to produce maximum protein. Its harmonic surface is shown in Figure 7. Each item of data and its approximation is depicted in Figure 8. Though 0% has no significant different result compared to 37.5% of rice bran, we cannot rely on 0% result since it means no rice bran is added. Statistical result (Silvia, 2012) has shown that the proportion of 50% of rice bran give the maximal protein where protein here was not considered as a function of mass and carbohydrate.
As we expected, that the optimal carbohydrate and mass satisfy the given constraints. Additionally, the forth data set have shown the maximum protein and the biharmonic function is concave. Therefore this result satisfies the underline theory shown in Section 2.
Table 4. Optimizers (Carbohydrate and Mass) and the corresponding maximal protein (P*)
Proportion (K*, M*) protein (Maximal P*) Minimal K Minimal M
0% (0.1855; 0.7420) 0.8187 0.1855 0.6882
12.5% (0.5610 , 0.7188) 0.5380
0.5610 0.6822 25% (0.5454 , 0.9714) 0.7702 0.5454 0.6742 37.5% (0.5066 , 1) 0.8215 0.5066 0.6636 50% (0.4663, 0.7487) 0.6439 0.4663 0.6755
Analysis of optimality of parameters
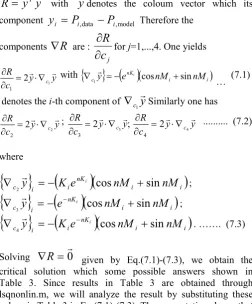
Note that two optimization problems appear in this research, i.e. optimization due to parameter determination of biharmonic function and optimization due to maximization of protein. In the first case, one needs to solve the critical condition to determine best parameters of biharmonic function. Thus,
0
[image:5.595.299.566.567.653.2]y
y
R
T
withy
denotes the coloum vector which its componenty
i
P
i,data
P
i,model Therefore thecomponents
R
are :j
c
R
for j=1,...,4. One yields
y y c R c 1 2 1
with
i i
nK
cy e nM nM
i cos sin
1
… (7.1)
denotes the i-th component of c
y
1
Similarly one hasy y c R c 2 2 2 ; ; 2 3 3 y y c R c y y c R c 4 2 4
... (7.2)
where
i i
nK i i
c
y
K
e
nM
nM
i
cos
sin
2
;
i i
nK
i
c3
y
e
icos
nM
sin
nM
;
i i
nK i i
c
y
K
e
nM
nM
i
cos
sin
4
. ……. (7.3)Solving
R
0
given by Eq.(7.1)-(7.3), we obtain thecritical solution which some possible answers shown in Table 3. Since results in Table 3 are obtained through lsqnonlin.m, we will analyze the result by substituting these values in Table 3 in Eq.(7.1)-(7.3). The computation shows that
the condition
0
R
is violated though the given error lessthan 20% for each data set. We leave this situation for further study.
Hessian matrix
The properties of symmetrical Hessian matrix of objective function can also be used as identifiers of optimality. This idea has been applied to select data before presenting further optimization based on the underline theory (Parhusip, 2009). We know that
y
y
c
R
c
12
1
with
i i
nK
c
y
e
nM
nM
i
cos
sin
1
……….. …(8)The first component of Hessian matrix is
.
2
1 1 1 12 1 2
y
y
y
y
c
R
c c c c
Notice that
c1
c1y
0
, therefore 2
2
1 1.
1 2
y
y
c
R
c c
The other components are derived similarly, we get
y y y y
y yc c R c c c c c c 1 2 1 2 1 2 2 2 2 1 2
y
y
y
y
y
y
c
c
R
c c c c c c
1 3 1 3 1 32
2
3 1 2
2
.
[image:6.595.37.290.60.365.2]2
1 4 1 4 1 4 4 1 2y
y
y
y
y
y
c
c
R
c c c c c c
Figure 7. Biharmonic surface of protein from 37.5 % of rice bran into MOCORIN
[image:6.595.175.425.425.570.2] [image:6.595.175.422.605.752.2]One yields the general form of the component of Hessian of
R in the form
y
y
c
R
j
j c
c j
2
2 2y
y
c
c
R
j
k c
c k
j
2
;
2
,i,j=1,...,4.
The eigen values of Hessian matrix of R have been computed and all eigen values have nonnegative values which indicate that R has been minimized for the obtained parameters. Thus,
though
R
0
is violated for each data set, one still has asufficient condition for existence of the obtained optimal parameters. The computation result shown in Table 5 (third coloum).
Analysis of optimal values of the objective function
As stated above, we have used fmincon.m function in MATLAB to solve the optimization problem. However the convexity of the harmonic function has not been yet validated. Therefore Eq.(6) is used and implemented into MATLAB program. Obviously, the objective function is infinitely continuous differentiable function in the given domain D
(where has been transformed into (0,1] X (0,1]) since its form is a combination of exponential and sinus,cosinus functions.
Therefore it is guaranteed the existent of
f
, i.e.T
M
f
K
f
f
where
)
sin(
)
(
)
cos(
)
(
nM
K
K
X
nM
K
K
X
K
f
and
)
cos(
)
(
)
sin(
)
(
K
nM
nX
K
nM
nX
K
f
.
Separation variables of f leads to simpler derivation of
f
. According to the given data, we have 5 sets of data and hence we will analyze of each data set. The obtained parameters are substituted and we expect
f
is zero in the sense of norm. One may observe that only the third type set of data does. Future observation is suggested to improve the algorithm for better achievement of optimality.Conclusion
Biharmonic function has been constructed for the given data of protein, carbohydrate and mass of MOCORIN (Modification Of Bisi 2 Variety Yellow Corn (Zea Mays L.) - Rice Bran Flour). Each variable is an interpolation of absorbance. There are 5 types of proportion of yellow corn and rice bran. This research determines the best proportion of yellow corn and rice bran. i.e. the proportion with maximum protein. One yields that 37.5% of rice bran is the best proportion for maximing the obtained protein.
Acknowledgement
This paper has been presented on International Conference on Applied Technology, Science, and Arts, ITS, Surabaya, Indonesia, 10 December 2013. The research was supported by Research Center of SWCU under the grant number SK 014/Penel./Rek./5/I/2013.
REFERENCES
Parhusip, H. A. 2009. Data Selection with Hessian Matrix,
Proceeding of Indo MS International Conference on Mathematics and Its Applications, (IICMA) 2009, Oct 12-13 2009, ISBN: 978-602-96426-0-5,pp. 0341-0352. Parhusip, H. A., Merryana S. 2005. Interpolasi Spline Kubik
pada Spektrum Cahaya yang melalui
Caroten dalam Aceton, Prosiding Seminar Nasional Efisiensi dan Konservasi Energi FISERGI, UNDIP, hal. B203-B209, ISSN.1907-0063.Peressini, A.L, Sullivan, F.E, Uhl, J. 1987. The Mathematics of Nonlinear Programming, Springer Verlag, New York, Inc. Press, W.H, Teukolsky, S.A, Vetterling,W.A, Flannery,B.P. 2002. Numerical Recipes in C, The Art of Scientific Computing, Second Edition, Cambridge University Press, Cambridge.
Ruffin, C King, R.L., The Analysis of Hyperspectral Data Using Savitzky-Golay Filtering – Theoretical Basis (Part 1) http://www.Ece.Msstate.Edu/~Rking/ Downloads/ Savitzky%20golay%201.Pdf available in 12 July 2013. Sandwell, D. T. 1987. Harmonic Spline Interpolation of Geos-3
and Seasat Altimeter Data, Geophysical Research Letters, Vol.14, No.2, page 139-143, Center for Space Research,
University of Texas at Austin.
Savitzky A., and Golay, M.J.E. 1964. Analytical Chemistry, vol. 36, pp. 1627–1639. Luoing, K., He, P. and Bai, J. 2005. Properties of Savitzky–Golay digital differentiators,
Digital Signal Processing, 15, pp. 422–136,Elsevier. Silvia, L. 2012. Mocorin ( Modifikasi Tepung Jagung Kuning
(Zea Mays L.) Varietas Bisi 2 – Bekatul) Ditelaah dari Nilai Gizi dan Uji Organoleptik, undergraduate thesis, Chemistry Department, Science and Mathematics Faculty, UKSW, Salatiga.
Ugail, H. 2006. "3D Facial Data Fitting using the Biharmonic Equation", Visualization, Imaging and Image Processing, J.J. Villanueva (ed.), ACTA Press ISBN: 0-88986-598-1, pp. 302-307.
Yang, W.Y., Cao, W., Chung, T.S., Morris, J. 2005. Applied
Numerical Methods Using Matlab, John Wiley and Sons, Inc.