An Improved Kernel K-Mean Cluster Method and Its
Application in Fault Diagnosis of Roller Bearing
Ling-Li Jiang1,2, Yu-Xiang Cao2, Hua-Kui Yin2, Kong-Shu Deng1
1Engineering Research Center of Advanced Mining Equipment, Ministry of Education,
Hunan University of Science and Technology, Xiangtan, China
2Hunan Provincial Key Laboratory of Health Maintenance for Mechanical Equipment,
Hunan University of Science and Technology, Xiangtan, China Email: [email protected], [email protected], [email protected]
Received November 12, 2012; revised December 11, 2012; accepted December 20,2012
ABSTRACT
For the kernel K-mean cluster method is run in an implicit feature space, the initial and iterative cluster centers cannot be defined explicitly. Against the deficiency of the initial cluster centers selected in the original space discretionarily in the existing methods, this paper proposes a new method for ensuring the clustering center that virtual clustering centers are defined in the feature space by the original classification as the initial cluster centers and the iteration clustering centers are ensured by the further virtual classification. The improved method is used for fault diagnosis of roller bear- ing that achieves a good cluster and diagnosis result, which demonstrates the effectiveness of the proposed method.
Keywords: Improved Kernel K-Mean Cluster; Fault Diagnosis; Roller Bearing
1. Introduction
The kernel K-mean cluster method is a combination of kernel method and K-mean method that the original items are embedded into a vector space called the feature space fist, and then K-mean cluster is performed in the feature space [1-2]. The initial cluster centers have an important influence on the cluster result. For example, the cluster result would be different by choosing different initial clusters, and there would obtain a local optimum rather than global optimal cluster result if choosing im-proper initial cluster center [3,4]. For the kernel K-mean cluster method is run in an implicit feature space, the initial and iterative cluster centers cannot be defined ex-plicitly. To address this issue, L. Zhang [5] proposed the kernel clustering algorithm, in which the initial cluster centers are given freely in the original space and the iteration clustering centers are changed through trans-forming the kernel matrix to realize the algorithm itera-tive. This process is complicated and difficult to under-stand. R. Kong [6] adopted the kernel K-mean clustering, in which the initial cluster centers are arbitrarily given in the original space, and the iteration clustering centers are obtained according to the previous classification results, which choose every sample of every category as a clus-tering center respectively, to calculate the intra-class dis-tance between the other sample points and the clustering center, the iteration cluster centers are the point with the mini- mum sum of distances. The paper combines the
two perspectives and puts forward a new kernel K-mean clustering algorithm execution method, which uses vir-tual initial classification to determine the initial kernel clustering centers, and the iterative classification to de-termine the new virtual kernel clustering centers to ulti- mately achieve accurate clustering. The proposed method is applied in the diagnosis of rolling bearing clustering to verify the effectiveness of the method.
2. Kernel K-Mean Clustering Method
The K-mean clustering is an unsupervised learning algo-rithm proposed by J. MacQueen in 1967 and its core idea is divided the sample set of X
x x1, , ,2 xn
into Kclustering, where the samples belong to the same calss have the higher similarity and samples belong to differ-ent class have lower similarity [7]. Detailed processing algorithm process is listed below:
1) The initial clustering center is to select k sample of
(1) (1) (1) 1 , 2 , , k
m m m kn discretionarily from n samples; 2) Calculate the distance from each sample to the clus-tering center in turn and then assign the sample to the class of the minimum distance value, which represents the most similar with the clustering center. According to the approximation degree between the clustering center and the other sample, a certain sample x can be classified by the follow way:
1 min
1 , 1, 2, ,
j i
The samplexbelongs to the clustering 1 j
S which cor- responds with the center 1
j
m ;
3) After initial classification, calculate the k iteration clustering center . It is different from the previous clustering center but will meet error sum of squares criterion:
2 2
1 , 2 , , k
m m m2
1
2 2
1
1, 2, ,
j k
j j x S
J x m j k
(2)make J minimum can get:
2
1 1 Nj
j j
i j m
N
x (3)where Nj is the sample number of the class 1 j S ; 4) Make a comparison with the previous iteration clustering center, if switch to (2), other- wise switch to (5);
h h1
j j
m m
5) Output clustering results.
Girolam first puts forward the ideas that make kernel method combine with clustering method. He believes that the nonlinear mapping is smooth and continuous. In the high dimensional space, sample in topology will re- main the same struck with the original space, and when the categorical distribution was not suprasphere or ellip- soid, the clustering algorithm based on kernel is still valid.
Assume that nonlinear mapping :RnF x,
x , mapping the samplexof original space to the high dimensional feature space F, then in the feature space, the sample for classification will become:n R
x1 , x2 , , xn
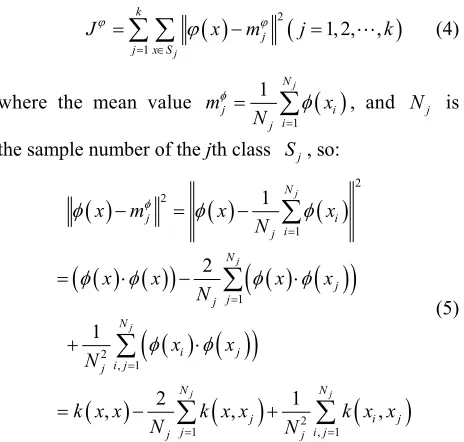
. The formula (2) which repre- sents error sum of squares criterion function change into [8]:
2
1
1, 2, ,
j k
j j x S
J x m j k
(4)where the mean value
1 1 Njj i i j m x N
, and Nj isthe sample number of the jth class Sj, so:
2 2 1 1 2 , 1 21 , 1
1 2 1 2 1 , , j j j j j N j i i j N j j j N i j i j j N N ,
j i j
j i j
j j
x m x x
N
x x x x
N
x x
N
k x x k x x k x x
N N
(5)where k(x,x) was kernel function.
The distance between any two points and feature space:
2 2, 2 , ,
i j
i i i j
j j
i i i j j j
x x
x x x
x x
k x x k x x k x x
x (6)
3. The Improved Kernel K-Mean Clustering
Method
It can be found from formula (5) that, to calculate the distance between arbitrary point in feature space and kernel clustering center, it just need to know the original space coordinates of all samples which represented by kernel clustering center. The clustering center coordi- nates are always recessive in the original space or feature space which is just an intermediate variable. If determine the initial clustering center is equivalent to determine the initial classification and the next clustering center is equivalent to the new classification, so it can realize the kernel clustering according to the process as follows:
1) Determining the clustering categories k
kn
;2) Separating the sample set into k kind randomly; 3) Calculating the distance between each sample in feature space and clustering center according to the for- mula (5), then it can get a new sorting while assign the sample to the classes of the minimum distance;
4) Calculating the error sum of squares criterion func- tion according to the formula (4), and judge whether cri- terion function is convergence or not, if it is not conver- gence, repeat the step 3), otherwise turn the step 5);
5) Outputting clustering results.
The process flow above is shown as in Figure 1.
4. Case Study
In order to verify the effectiveness of the improved ker-nel cluster method, the test of fault diagnosis of roller bearing is developed.
4.1. The Vibration Collecting Experiments
The vibration collecting experiments were performed on The Machinery Fault Simulator (MFS) from Spectra Quest, Inc. shown in Figure 2. It can simulate most of
[image:2.595.58.290.496.717.2]Is criterion function is convergence or not ? Divide into k classes
randomly
Choose kernel function and kernel parameter Determine the number
of clustering k
Calculate the distance between each sampleΦ(x) in feature space and clustering center , then assigned to the nearest class according to the formula (5)
Start
Output clustering results
End
N
[image:3.595.99.243.85.461.2]Y
[image:3.595.309.538.406.737.2]Figure 1. The process flow of the improved kernel K-mean cluster method.
Figure 2. Machinery fault simulator.
fault kit consisting of one inner race defect, one outer race defect, one with ball defect, and one combination of defects for performing experiments and studying bearing fault diagnosis.
The shaft rotating speed was obtained by a laser speed- ometer. Acceleration signals were measured using the Dewetron 16 channels data acquisition system and the IMI 603C01 accelerometers with 10 kHz acquisition fre- quency rate. The data were stored in .mat format for fur-
ther Matlab operation.
4.2. Feature Extraction
Feature database 1: Time-domain statistical features of rolling bearing.
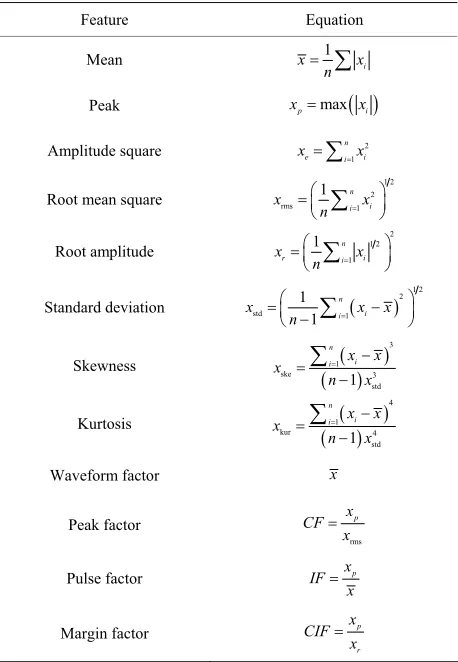
Vibration signals of rolling bearing with four fault models including normal, inner race defect, outer race defect and ball defect are taken for analysis. A total of 12 time-domain statistical features (shown in Table 1) are
extracted from each vibration signal to constitute a fault sample. One hundred and ten fault samples from each model, total four hundred and forty samples are used to constitute the feature library 1.
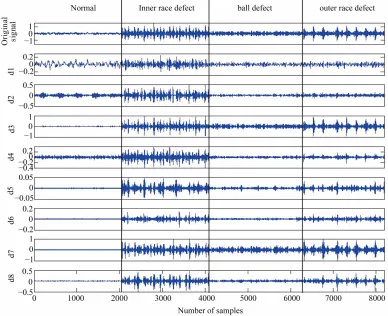
Feature database 2: Energy features of rolling bearing in different frequency band based on 3-layer wavelet packet decomposition.
The 3-layer wavelet packet decomposition is per- formed on the vibration signals of roller bearing with four fault models. The different frequency branches are in-cluded in different layer of wavelet packet reconstructed signal, and when decomposing different fault mode of roller bearing, the reconstruction signals are different with each other. The result of decomposition is shown in Figure 3. The energy eigenvalue in each frequency
Table 1. The time-domain statistical features.
Feature Equation
Mean x1n
xiPeak xpmax
xiAmplitude square 2
1
n e i i
x
xRoot mean square
1 2 2 rms 1 1 n i i x x n
Root amplitude 2 1 2 1 1 nr i i
x x
n
Standard deviation
1 2 2 std 1 1 1 n i i x x n
x Skewness
3 1 ske 3 std 1 n i i x x
x n x
Kurtosis
4 1 kur 4 std 1 n i i x x
x n x
Waveform factor x
Peak factor rms p x CF x
Pulse factor IF xp
x
Margin factor p
r
x CIF
[image:3.595.81.264.497.606.2]Figure 3. The 3-layer wavelet packet decomposition of roller bearing with deferent defects.
branch is calcul undred and ten fa
The improved kernel K-mean cluster analysis is con- istical
t IMFs energy D). Gaussian
method. The key of studying lies in luster center and the iteration kernel ated to constitute the fault sample. One
ult samples from each model, total
and the feature database 3 (The first eigh features of rolling bearing based on EM h
four hundred and forty samples are used to constitute the feature library 2.
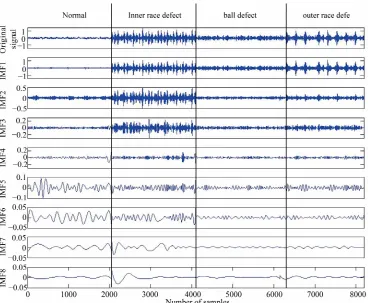
Feature database 3: The first eight intrinsic mode func- tions (IMFs) energy features of rolling bearing based on empirical mode decomposition (EMD).
The empirical mode decomposition is performed on the vibration signals of roller bearing with four fault models. The different frequency branch is included in different intrinsic mode functions. When decomposing different fault mode of roller bearing, the reconstruction signals are different with each other. The result of de- composition is shown in Figure 4. The energy eigen-
value in each frequency branch is calculated to constitute the fault sample. One hundred and ten fault samples from each model, total four hundred and forty samples are used to constitute the feature library 3.
4.3. State Recognition and Fault Diagnosis
ducted to the feature database 1 (time-domain stat features of rolling bearing), the feature database 2 (en- ergy features of rolling bearing in different frequency band based on 3-layer wavelet packet decomposition)
kernel function is chosen and the kernel parameter σ is 100. A total of 10 experiments are conducted and aver- age number is got. The results are shown in Table 2. It
can be seen from the table that the improved kernel K- mean clustering algorithm is better than kernel K-mean clustering algorithm both in iterations and accuracy rate.
5. Conclusion
This paper studies on the kernel clustering methods. Aiming at the present deficiency of kernel K-mean clus- tering methods, this paper presents an executing process at kernel clustering
the initial kernel c
clustering center. The case of roller bearing fault diagno- sis indicated that the improved kernel K-mean clustering algorithm is better than kernel K-mean clustering algo- rithm both in iterations and accuracy rate. This study has significant instruction and reference value for the domain of fault diagnosis.
6. Acknowledgements
Figure 4. The empirical mode decomposition of roller bearing with deferent defects.
Table 2. A compare of different K-mean cluster methods.
Feature database 1 Feature database 2 Feature database 3
Feature databas
accuracy rate (%) accuracy rate (%)
Diagnostic accuracy rate (%) e
Iterations Diagnostic Iterations Diagnostic Iterations
K-mean 38 92.56 42 93.87 38 91.43
Kernel K-mean 3 2 2 3 3
Improved kernel K-mean
2 94.1 8 95.9 0 92.38
28 95.38 24 96.12 28 94.23
foundation of China (51105138), the national high tech- nology developmen ogram item 12-
AA province ence and t ogy
lan projects (2011GK3161), the scientific research fund
s Clustering Algorithms,” Lecture Notes in Computer Science, Vol. 6408, 2010, pp. 116-128. doi:10.1007/97
Study,” Fuzzy S
.1016/j.fss. .10.021
research and t pr s (20 041805), the Hunan sci echnol p
of Hunan provincial education department (11C0530) and the aid program for science and technology innova- tive research team in higher educational institutions of Hunan province.
REFERENCES
[1] K. Yuchi, E. Yasunori and M. Sadaaki. “Indefinite Kernel Fuzzy c-Mean
8-3-642-16292-3_13
[2] G. Daniel, P. Witold, “Kernel-Based Fuzzy Clustering and Fuzzy Clustering: A Comparative Experimental
ets and Systems, Vol. 161, No. 4, 2010, pp. 522-543. doi:10 2009
[3] Gu, S. Z and Huang, “Fu ernel
K-Means Clustering Method Based on Immune Genetic
Cluster-luster
Algo-er, Vol. 30, No.
C. hang, K. Liu H. zzy K
Algorithm,” Journal of Computational Information Sys-tems, Vol. 7, No. 1, 2011, pp. 221-231.
[4] G. Wang, X. Li and K. He, “Kernel Local Fuzzy ing Margin Fisher Discriminant Method Faced on Fault Diagnosis,” Journal of Software, Vol. 6, No. 10, 2011, pp. 1993-2000.
[5] L. Zhang, W. Zhou and L. Jiao, “Kernel C
rithm,” Chinese Journal of Computers, Vol. 25, No. 6, 2002, pp. 587-590.
[6] R. Kong, G. Zhang, Z. Shi and G. Li, “Kernel-Based K-Mean Clustering,” Computer Engine
11, 2004, pp. 12-13,80.
[image:5.595.57.542.435.526.2]An Introduction to Cluster Analysis,” Wiley Blackwell, Hoboken, 2005.
[8] Z. Wu, W. Xie and J. Yu, “Fuzzy c-Means Clustering Algorithm Based on Kernel Method,” Proceedings of