Munich Personal RePEc Archive
Service quality in Indian telecom sector
-A regression model study
K, Keerthi and J, Swaminathan and R, Renukadevi and K,
Bharathipriya
A.V.C College of Engineering, A.V.C College of Engineering, A.V.C
College of Engineering, STET Women’s College
February 2017
SERVICE QUALITY IN INDIAN TELECOM SECTOR - A
REGRESSION MODEL STUDY
Dr. K.Keerthi1 Dr.J.Swaminathan2 Mrs.R.Renukadevi3 Mrs.K.Bharathipriya 4
1
Department of Management Studies. 2,3
A.V.C College of Engineering Mayiladuthurai, 4STET Women’s College, Man
narkudi *E-mail: [email protected]
Introduction
In India, as in many developing countries, low tele- density resulted in great emphasis being laid on rapid expansion often at the cost of quality of service. One of the benefits expected from the private sector's entry into telecom is an improvement in the quality of service to international standards. Quality of service was identified as an important reform agenda and TRAI has advised QOS (Quality of Service) norms that are applicable across the board to all operators (Singh et. al. 1999).
In services marketing literature, service quality has been concisely defined as the overall assessment of a service by the customers. Service quality is playing an increasingly important role in the present environment where there is no further scope for the companies to differentiate themselves other than the quality of the service provided by them. Delivering superior service quality than the competitors is the key for the success of any organization. But, the companies face difficulties in measuring the quality of services offered to the customers.
In order to attract new customers and to retain the existing customers, mobile telecommunication service providers in Indian market are employing a variety of ways such as providing customers with excellent services, modern looking equipments, courteous, skilful, well trained personnel, and supportive operative systems. Service providers expect that with excellent service, customers will be satisfied and if satisfied, they will become loyal customers for the organization.
The significant growth of service providers in the field of mobile telecommunication sector has
caused the appearance of buyer’s market. Buyer’s market is that type of market, where supply exceeds demand. In this situation of buyer’s market, the customers get more bargaining power.
Therefore in this situation, the service providers have to be very effective and efficient in their operations because customers now have choices in determining the service provider they want. In the context of customers, the need for excellent services always keeps on changing. With the passage of time, the level of service quality also varies.
The Indian mobile telecommunication services operators are facing a number of significant challenges, because of changing dynamics:
First, retaining existing customers mainly in a pre-paid and high churn market has become more difficult and costly.
Third, as mobile phone operators have had to incur additional cost in keeping existing customers and acquiring new ones, their Average Revenue Per User (ARPU) has declined, leading to worsening of their financial performance.
In light of above mentioned challenges, mobile telecommunication services providers need to make customer satisfaction a strategic priority. Moreover, satisfied customers have a higher propensity to stay with their existing service provider than the less satisfied ones (Cronin et al., 2000) and are more likely to recommend the service provider to others, leading to improved bottom line for the company. Thus, it is very important that Indian mobile telecommunication services operators gain a better understanding of the relationship between the performance of service quality attributes, customer value, satisfaction, and loyalty.
Service Quality of Mobile Phone Service Providers
Nowadays cellular mobile is an essential product for our daily communication. Customers mainly purchase this product for instant communication and various services provided by the companies (Paulrajan Rajkumar & Harish R, 2011). Services mainly depend on some factors and customers always try to buy the product which has many factors or attributes fulfilling their desire. Recently the concept of customer satisfaction has received much attention (Hafeez S & Hasnu S, 2010). In cellular mobile market customers have higher expectations for communication from its service providers (Gremier DD & Brown SW, 1996).
Numerous studies have investigated the perspective of mobile phone users with regard to the quality aspects. These have been discussed in succeeding paragraphs. These studies provide insight to the quality dimensions that mobile phone operators need to consider remaining competitive in changing environment (MA Khan, 2010).
In 2008, Telecom Regulatory Authority India carried out quality of service survey of mobile
operators based on users’ satisfaction. The sample consisted of 1318 mobile phone users. The
important dimensions of regulatory services benchmark dimensions of service quality included billing, customer care, availability of network, value-added services and pre-sales and sales dimensions. Out of 11 operators, only five operators achieved the 90% service quality benchmark (Survey, 2008).
A study by Sukumar (2007), using a sample of 104 mobile phone subscribers, measured the
mobile phone users’ preferences for selection of an operator. The result of the study found
important dimensions as brand image, customer care, services availability, credit facility for connection, deposit amount, and prices in that order of priority.
Proposed Conceptualized Research Model
There are 7 dimensions were framed for this study. Those are; i) Service Network Communication, ii) Technology Adoption, iii) Customer Care Services, iv) Service Quality, v) Brand Switching Attitude & MNP , vi) Fringe Benefit Services, and vii) Service Loyalty. Here Demographic variables, Service Network Communication, Technology Adoption, Customer Care Services, Service Quality, Brand Switching Attitude & MNP, are independent variables and Fringe Benefit Services and Service loyalty are the dependent variable. It is studied that how and what extent the independent variables make changes in the dependent variable. The proposed conceptual research model shows the process of research as follows:
Conceptual Model for studying Service loyalty in Mobile Service Providers
Construct Measures and Data Collection
Data were collected by means of a structured questionnaire comprising nine dimensions namely
(1) Service Network Communication (SNC 05 items), (2) Technology Adoption (TA 09 items), (3) Customer Care Services (CCS 11 items), (4) Fringe Benefit Services (FBS 07 items) (5)Service Quality (SQ 05 items), (6)Brand Switching Attitude & MNP (BSA 09 items) and (7)Service Loyalty (SL 04 items). 11 items were used to sketch the respondents’ demographic profile. All
the dimensions were presented as statements on the questionnaire, with the same seven point, Likert scale (varied from 1 highly dissatisfied to 7 highly satisfied and Strongly Disagree to Strongly Agree). For conducting an empirical study, data were collected from respondents in various Districts of Tamil Nadu. Assurance was given to the respondents that the information collected from them will be kept confidential and will be used only for academic research
purposes. Data had been collected using the “Personal-Contact” approach as suggested by Suresh
chandar et al. (2002) whereby “Contact Persons” (Patients) have been approached personally and
the survey was explained in detail. The final questionnaire together with a cover letter handed
A total of 750 nos. of questionnaire were circulated among respondents of districts selected by stratified random sampling method and a total of 714 valid questionnaires were used for the analysis (response rate of 95.2 %).
The Demographic Profile
S. No. Demographic Dimensions No. of
Respondents
% of
Respondents
1) Sex Male 472 62.50
Female 278 37.50
Total 750 100
2) Age 18.yrs. to 27 yrs. 156 20.80 28.yrsss. to 37 yrs. 216 28.80 38 yrs. to 48 yrs. 181 24.14 48 yrs. to 57 yrs. 102 13.60 58.yrs. to 67 yrs. 76 10.13 68 yrs and above. 19 02.53
Total 750 100
3) Religion Hindu 678 90.40
Muslim 27 03.60
Christian 45 06.00
Total 750 100
4) Community BC 202 26.93
MBC 85 11.33
SC 463 61.74
Total 750 100
5) Educational Qualifications
School Dropout 76 10.13
SSLC 124 16.53
HSC 80 10.67
Diploma 112 14.94
UG 177 23.60
PG 181 24.13
Total 750 100
6) Occupation Unemployed 124 16.53
Farmer 80 10.67
Private Employee 177 23.60 Government
Employee
112 14.94
Business 76 10.13
Professional 80 10.67
Total 750 100
7) Annual Income in (Rupees)
Total 750 100
8) Service Provider BSNL 112 14.93
Airtel 161 21.47
Aircel 137 18.27
Reliance 80 10.67
MTS 67 8.93
Vodafone 114 15.20
Idea 43 5.73
Tata Docomo 36 4.80
Total 750 100
9) Type of service Post Paid 273 36.40
Pre Paid 387 51.60
CDMA 56 7.47
GSM 34 4.53
Total 750 100
Source: Primary Data
Regression Model of the “Mobile QUAL” Mediated Structural Model
In hierarchical regression, the predictor variables are entered in sets of variables according to a pre-determined order that may infer some causal or potentially mediating relationships between the predictors and the dependent variable (Francis, 2003). Such situations are frequently of interest in the social sciences. The logic involved in hypothesizing mediating relationships is that
“The Independent Variable Influences the Mediator which, In Turn, Influences the Outcome”
(Holmbeck, 1997). However, an important pre-condition for examining mediated relationships is that the independent variable is significantly associated with the dependent variable prior to testing any model for mediating variables (Holmbeck, 1997). Of interest is the extent to which the introduction of the hypothesized mediating variable reduces the magnitude of any direct influence of the independent variable on the dependent variable. Hence the researcher empirically tested the hierarchical regression for the model conceptualized in the figure 4.19 within the AMOS 20.0 graphics environment.
The Regression analyses conducted, the parameter estimates are then viewed within AMOS graphics and it displays the standardized parameter estimates. The regression analysis revealed that the Fringe Benefit Services on the various dimensions of Mediated Model Mobile Service Provider, Fringe Benefit Services (FBS) influenced 0.11 of the Service Loyalty (SL), followed by Service Quality (SQ) which explains 0.40 of the Fringe Benefit Services (FBS) the R2 value of 0.11 is displayed above the box Service Loyalty (SL) in the AMOS graphics output. The visual representation of results suggest that the relationships between the dimensions of Mobile Service Provider, procedure and formalities (Service Quality (SQ) => Fringe Benefit Services (FBS) = 0.40) resulted significant impact on the mediated factor Fringe Benefit Services (FBS). Service Network Communication (SNC), Technology Adoption (TA), Customer Care Services (CCS), Service Quality (SQ), and Brand Switching Attitude & MNP (BSA) are resulted very limited influence on the Fringe Benefit Services (FBS). It shows that the Customer perception towards the Technology Adoption (TA) and Customer Care Services (CCS) towards outcome of Mobile Service Provider in insignificant whereas the impact of the same is very high on mediating variable.
Bayesian Estimation and Testing for Regression Model of “Mobile QUAL” Mediated Structural Equation Model
Bayesian Convergence Distribution for “Mobile QUAL” Regression Model
Regression weights
Mean S.E. S.D. C.S. Skewness Kurtosis Min Max Name
FBS<--SNC
0.004 0.001 0.05 1.000 0.025 0.03 -0.187 0.212 W1
FBS<--TA
0.296 0.001 0.039 1.000 -0.023 0.109 0.14 0.441 W2
FBS<--CCS
0.184 0.001 0.033 1.000 -0.042 0.047 0.029 0.303 W3
FBS<--SQ
0.402 0.001 0.065 1.000 0.034 0.068 0.15 0.659 W4
FBS<--BSA
0.013 0.001 0.032 1.000 -0.047 -0.06 -0.113 0.146 W5
SL<--BSA
0.051 0 0.017 1.000 -0.027 0.046 -0.021 0.12 W6
SL<--SQ
0.141 0.001 0.036 1.000 -0.049 0.074 -0.002 0.269 W7
SL<--CCS
0.054 0 0.018 1.000 0.021 0.004 -0.019 0.125 W8
SL<--TA
0.048 0.001 0.023 1.000 0.023 0.03 -0.048 0.135 W9
SL<--SNC
0.149 0.001 0.027 1.000 -0.017 0.031 0.039 0.281 W10
SL<--FBS
0.105 0 0.021 1.000 0.009 0.102 0.016 0.19 W11
Means
Mean S.E. S.D. C.S. Skewness Kurtosis Min Max Name SNC 22.365 0.007 0.251 1.000 0.052 0.059 21.378 23.432 M1
TA 40.37 0.006 0.33 1.000 0.016 0.044 39.079 41.765 M2
CCS 47.16 0.01 0.415 1.000 -0.065 -0.124 45.275 48.652 M3
SQ 22.809 0.006 0.212 1.000 -0.009 -0.005 22.018 23.665 M4
BSA 35.74 0.01 0.36 1.000 0.01 -0.024 34.14 37.015 M5
Intercepts
Mean S.E. S.D. C.S. Skewness Kurtosis Min Max Name FBS 1.995 0.048 1.637 1.000 0.021 0.056 -4.181 8.688 I1
SL 2.099 0.021 0.913 1.000 -0.027 0.013 -1.724 5.568 I2
Covariances
Mean S.E. S.D. C.S. Skewness Kurtosis Min Max Name
SNC<->BSA
3.724 0.048 2.348 1.000 0.045 0.055 -5.384 14.736 C1
BSA<->TA
BSA<->CCS
38.5 0.112 4.212 1.000 0.148 0.129 22.726 57.56 C3
BSA<->SQ
18.731 0.047 2.154 1.000 0.095 0.01 9.935 28.336 C4
SNC<->SQ
13.807 0.033 1.452 1.000 0.165 -0.047 8.396 19.898 C5
TA<->SQ
21.865 0.067 2.04 1.001 0.123 -0.098 14.578 29.848 C6
CCS<->SQ
30.662 0.067 2.627 1.000 0.225 0.188 20.732 43.424 C7
SNC<->CCS
24.947 0.069 2.926 1.000 0.193 0.012 14.512 38.295 C8
TA<->CCS
43.823 0.127 3.994 1.001 0.261 0.322 30.795 67.788 C9
SNC<->TA
25.102 0.06 2.327 1.000 0.163 0.07 16.372 35.334 C10
Variances
Mean S.E. S.D. C.S. Skewness Kurtosis Min Max Name SNC 42.433 0.055 2.232 1.000 0.232 0.111 35.077 52.231 V1
BSA 92.477 0.097 4.852 1.000 0.181 -0.076 75.772 115.103 V2
TA 74.473 0.128 4.01 1.001 0.225 0.134 60.545 91.118 V3
CCS 122.585 0.198 6.57 1.000 0.26 0.209 96.428 156.995 V4
SQ 31.028 0.05 1.689 1.000 0.177 -0.015 24.849 38.61 V5
e2 54.348 0.102 2.872 1.001 0.19 0.011 44.56 65.208 V6
e1 16.322 0.02 0.874 1.000 0.232 0.098 13.363 19.905 V7
Source: Amos 18 output
Posterior Diagnostic Plots of „Mobile QUAL‟ Mediated Regression Model
To check the convergence of the Bayesian MCMC method the posterior diagnostic plots are analysed. The following figure shows the posterior frequency polygon of the distribution of the parameters across the 99000 samples. The Bayesian MCMC diagnostic plots reveals that for all the
Posterior frequency polygon distribution of the Mediating Factor Service Loyalty (SL) and Fringe Benefit Services (FBS) regression weight (W11)
Posterior frequency histogram distribution of the Mediating Factor Service Loyalty (SL) and Fringe Benefit Services (FBS) regression weight (W11)
The trace plot also called as time-series plot shows the sampled values of a parameter over time. This plot helps to judge how quickly the MCMC procedure converges in distribution. The following figures show the trace plot of the mediated Mobile QUAL Model for the mediated factor Fringe Benefit Services (FBS) to Service Loyalty (SL) dimension across 99000 samples. If we mentally break up this plot into a few horizontal sections, the trace within any section would not look much different from the trace in any other section. This indicates that the convergence in distribution takes place rapidly. Hence the mediated Mobile QUAL MCMC procedure very quickly forgets its starting values.
To determine how long it takes for the correlations among the samples to die down, autocorrelation plot which is the estimated correlation between the sampled value at any iteration and the sampled value k iterations later for k = 1, 2, 3,…. is analysed for the Mobile QUAL regression model. The figure 4.23 shows the correlation plot of the Mobile QUAL model for the mediated factor Fringe Benefit Services (FBS) to Service Loyalty (SL)dimension across 99000 samples. The figure exhibits that at lag 100 and beyond, the correlation is effectively 0. This indicates that by 90 iterations, the MCMC procedure has essentially forgotten its starting position. Forgetting the starting position is equivalent to convergence in distribution. Hence it is ensured that convergence in distribution was attained and that the analysed samples are indeed samples from the true posterior distribution.
Posterior frequency autocorrelation plot of the Mediating Factor Service Loyalty (SL) and Fringe Benefit Services (FBS) regression weight (W11)
Even though marginal posterior distributions are very important, they do not reveal relationships that may exist among the two parameters. The summary table and the frequency polygons describe only the marginal posterior distributions of the parameters. Hence to visualize the relationships among pairs of Parameters in two-dimensional. The surface plots in the following figures provides vicariate marginal posterior plots of the Mobile QUAL model for the mediated factor Fringe Benefit Services (FBS) with other dimensions across 99000 samples. From the two figures it is revealed that the two dimensional surface plots also signifies the interrelationship between the mediating variable Fringe Benefit Services (FBS) with the other dimensions Service Loyalty (SL) and Service Network Communication (SNC).
Two-dimensional histogram plot of the marginal posterior distribution of the mediating factor Fringe Benefit Services (FBS) with SQ and SNC
The following figure displays the two-dimensional plot of the bivariate posterior density across 99000 samples. Ranging from dark to light, the three shades of gray represent 50%, 90% and 95% credible regions, respectively. From the figure, it is
revealed that the sample respondent’s responses are normally distributed.
The various diagnostic plots of the Bayesian estimation of convergence of MCMC algorithm confirms the fact that the convergence takes place and the normality is attained. Hence absolute fit of the Mobile QUAL regression model. From the Mobile QUAL regression model which is empirically tested with mediating factor with the dimensions Service Loyalty (SL) and Service Network Communication (SNC) it is evident that the Mobile service provider should concentrate on the Fringe Benefit Services (FBS) as the mandatory aspect of Mobile Service Provider in Tamil Nadu.
Managerial Implications for Mobile Service Provider
Mobile-QUAL is a valid instrument to measure service quality in cellular mobile telephone operators in Tamil Nadu. Inclusion of additional dimensions and items make it more comprehensive for application in telecommunication services. The dimensions of Service Network Communication (SNC), Technology Adoption (TA), Customer Care Services (CCS), Service Quality (SQ) and Brand Switching Attitude & MNP (BSA) and the mediating parameter Fringe Benefit Services (FBS) and the outcome of Service Loyalty (SL) are important aspects that need managerial attention to attract and retain customers. The regulators in telecommunication industry should take appropriate measure to include these dimensions in undertaking objective assessment of quality of service of cellular mobile telephone operators in Tamil Nadu in safeguarding customers’ interest.
The adapted Mobile-QUAL with additional dimensions was found to be a valid instrument to measure service quality in mobile phone services. The dimensions of tangible, assurance, responsiveness, empathy, convenience, and network quality found to have positive and statistically significant relationship with mobile phone
users’ perceived service quality. Convenience and network quality dimensions found
to be relatively most important dimensions affecting users’ perception. The dimension of reliability did not reflect significant effect on customers’ perception of quality.
The competitive environment in mobile phone industry in Tamil Nadu has become intense. Mobile operators are vigorously investing in network coverage, upgradation, and quality, competitive pricing, and diversified offering to attract new customers and retain the existing customers. The results of this study substantiate the response strategy of mobile phone operators to enhance quality of network, the tangible, responsiveness, and assurance, empathy, and convenience dimensions of services that are vital to affect the customers’ perception of quality of service.
The proactive role of Indian Telecom Sector, consumers’ awareness to higher quality of services, and the prospects of new entrants in the market will enhance the existing level of competition. The emerging competitive market environment will offer challenges to mobile phone operators to proactively pursue customer focused strategy for building and sustaining competitive advantage based on benchmark quality of service dimensions that the results of this research indicate.
Earlier researches indicate that reliability positively and significantly affects customers’ perception of service quality of mobile phone users.
An aggressive strategy is needed to enhance the trustworthiness of mobile phone operators by keeping customers’ best interest at heart, providing customized services and exemplary behaviour of contact personnel to make the interaction a memorable experience.
The dimensions of tangible; responsiveness, assurance, and empathy affect customers’ perception of service quality of mobile phone service provider.
The study established that Mobile-QUAL with additional dimensions is a reliable instrument for measurement of service quality dimensions in telecommunication industry in Tamil Nadu.
The competitive environment demand constant assessment of service quality to meet rapid changes in customers’ demand. It is essential that service quality of mobile phone users be evaluated on regular basis to identify weaknesses, and emerging trends in the service.
The regression model created in AMOS software shows that the fringe benefit service is the mediating factor for the loyal customers.
The results of the study reflect that the issue of provisioning of promised service, timely, accurately, and dependably will need highest priority. Earlier researches indicate that reliability positively and significantly affects customers’ perception of service quality of mobile phone users. Because the reliability has been established as the driver of mobile phone service quality, Mobile operators will need to pursue two pronged strategy with internal focus on improved processes, and external focus on customers’ needs. An aggressive strategy is needed to enhance the trustworthiness of mobile phone operators by keeping customers’ best interest at heart, providing customized services and exemplary behaviour of contact personnel to make the interaction a memorable experience. The mobile operators should also focus on other dimensions of tangible; responsiveness, assurance, and empathy because these aspects significantly affect customers’ perception of service quality of mobile phone service provider.
Employees play a leading role in telecommunication service. The role of frontline staff becomes extremely important in making the interaction with customer pleasing. The staffs need to know the importance of their role in service delivery. Management should ensure that human resources dimensions are addressed to optimize the service delivery by staff.
Because of the growing level of competition that can be observed in Indian telecommunication industry, mobile phone operators should make efforts to continuously improve the level of service quality offered to their subscribers. However, a basic principle of quality management is that to improve quality, it must first be measured. On the basis of the need to develop specific measurement tools for different services, this study aimed at developing and validating a model specifically for measuring mobile telecommunication service quality. A multidimensional model has been proposed (Mobile-QUAL) based on an extensive literature review and then tested and validated by the survey data collected through Indian mobile phone subscribers in Tamil Nadu. This model provides a very useful tool, for both researchers and practitioners, for measuring and managing service quality in mobile telecommunication sector.
Finding of this study showed that mobile phone subscribers form their service quality perceptions based on their evaluations of seven primary dimensions including: network quality, value-added service, pricing plans, employees’ competency, billing system, customer services and service convenience. According to developed Mobile – QUAL scale, mobile telecommunication service quality is a second-order factor underlying these seven dimensions. Each of the seven identified and v e r i f i e d d i m e n s io n s h a d s i g n i f i c a n t l o a d i n g o n se c o nd -order factor. For practitioners, the twenty one items across seven factors can serve as a useful diagnostic purpose. They can use the validated scale to measure and improve service quality.
The results of confirmatory factor analysis indicated that value- added services is the most important factor driving customers’ perceived service quality (Mobile-QUAL), followed by pricing plans and service convenience. These findings indicate that enhancing quality of value- added services can provide mobile phone operators with competitive advantages over their competitors. Indian mobile phone operators have been struggling over the past several years to improve their network quality through massive equipment investments. However, the results of this study show that network quality is the least important factor in customers’ perception of service quality. Thus, mobile service providers must concentrate their efforts on developing value-added services, diversifying pricing plans and increasing service convenience to improve service quality and achieve customer satisfaction.
based services, downloads and subscription services and internet access services (MoEA, 2007). Communicating services refer to services that subscribers use other than traditional voice calls to communicate through video, pictures or text such as SMS, MMS and video call. System based services refer to services provided through setup on the operators such as ring back tones and two phone ringing. Downloads and subscription services refer to services such as downloading ringtones, wallpaper and games or subscription to newsletter and weather forecasting information. Internet access services refer to mobile internet provided by operators through WAP, GPRS or 3G internet access. Through developing and improving quality of mentioned value-added services, a mobile phone operator will stand a much better chance of retention and acquisition of more subscribers.
Furthermore, findings of this study showed that customers’ evaluation of pricing plans and service convenience has important role in forming their overall perceived service quality. These results are similar to the findings of Santouridis and Trivellas (2010) which found pricing plans as a significant determinant in customer satisfaction and also similar to the findings of Negi (2009) which confirmed the importance of service convenience in driving customers perceived service quality. Thus, mobile phone operators must try to offer various pricing plans that meet customers’ need, provide easy procedures for changing plans and deliver required information about pricing plans to improve customers’ evaluation of pricing plans. Also, they must give great attention to issues such as sufficient number of retailers or kiosks, sufficient methods and locations for bill payment and ease of subscribing and changing services. The multinational firm should consider Indian socio-economic culture before fixing the price and other formation activities in telecom sector.
Conceptual Model
The conceptual research model has been empirically proved and the Fringe Benefit Services is the mediating factor for the Mobile Service Provider (Telecom) sector in the study area. Hence Mobile Service Provider (Telecom) Sector should concentrate on Fringe Benefit Services to improve the service loyalty for the growth of Mobile Service Provider (Telecom) Sector.
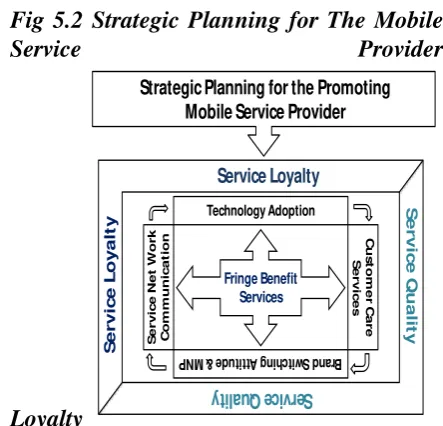
Strategic Planning For Improving Mobile Service Provider Loyalty
Fig 5.2 Strategic Planning for The Mobile
Service Provider
Loyalty
Strategic Planning for the Promoting Mobile Service Provider
Service Loyalty S er vic e Q ual ity S e r v ic e Q u a li t y S e r v ic e L o y a lt
y Technology Adoption
S e r v ic e N e t W o r k C o m m u n ic a t io n Bra nd Sw itc hin g A tti tude & MN P C u s t o m e r C a r e S e r v ic e s Fringe Benefit Services
Limitations and Directions for Further Research
This study being in a specific geographic area of Tamil Nadu, the results may be specific for this area. In order to generalize the proposed model, further researches should replicate this model in other populations and provinces. Second, the possibility to generalize the results to other countries with different characteristics (such as different cultural context, different level of economic development) needs to be verified, by re-testing the proposed model.
Further researchers could examine the relationship between Mobile- QUAL,
customers’ satisfaction and other relevant variables such as customer loyalty. Also,
future research could focus on the antecedents of mobile telecommunication service quality and how customers form their perceptions about each of the constructs in Mobile- QUAL in Indian context.
Conclusion
Quality is generally regarded as being a key factor in the creation of worth and in influencing customer satisfaction. Hence, the telecommunication industry in India has to be strategically positioned to provide quality services to satisfy customers. To provide improved quality service, telecommunication companies need to investigate
degree of customers’ sensitivity and expectations toward service quality. Armed with
[image:17.595.85.307.116.329.2]