Correlation between Aerodynamic Noise and Velocity
Fluctuation of Tip Leakage Flow of Axial Flow Fan
Hiromitsu Hamakawa, Masatomo Shiotsuki, Takaaki Adachi, Eru Kurihara
Department of Mechanical Engineering, Oita University, Oita, Japan Email: [email protected]
Received September 11, 2012; revised October 25, 2012; accepted November 4, 2012
ABSTRACT
In the present paper the attention is focused on correlation between fan noise and velocity fluctuations of tip leakage vortex around rotor blade of a low pressure axial flow fan at the maximum pressure operating point. We measured time fluctuating velocity near the rotor tip around the rotor blades by using a hot-wire sensor from a relative flame of refer- ence fixed to the rotor blades. As the results, it is clear that the velocity fluctuation due to tip leakage vortex has weak periodicity and the hump portion appeared in its spectrum. If the flow rate was lower than the design condition, the tip leakage flow became to attach to the following blade and the sound pressure level at frequency of velocity fluctuation of this flow was increased. The correlation measurements between the velocity fluctuation of tip leakage flow and the aerodynamic noise were made using a rotating hot-wire sensor near the rotor tip in the rotating frame. The correlation between the velocity fluctuation due to tip leakage flow and acoustic pressure were increased due to generation of weak acoustic resonance at the maximum pressure operating point.
Keywords: Fan; Noise; Tip Leakage Flow; Relative Flow Measurement; Correlation Measurement; Acoustic Resonance
1. Introduction
Low noise level is an important sales point of the various kinds of machines as well as high performance and miniaturization. This situation is also applied to axial flow fans used, for example, in air conditioners.
The controlling noise source generated from an axial flow fan is turbulent noise due to vortex shedding when the fan is operated near the design point [1,2]. Fukano et al. have investigated the discrete frequency noise gener- ated by Karman vortex shedding from a flat plate blade immersed in a uniform two-dimensional flow field, and theoretically introduced a formula to predict its sound pressure level [3].
On the other hand, aerodynamic noise increase by enlarging a tip clearance is studied by Longhouse [4], Fukano et al. [5], and Kameier and Neise [6]. Their stud- ies showed that the spectral peaks occurred in sound spectra although a tip clearance noise is broadband natu- rally. Fukano and Jang [7] also reported that the noise increase due to tip clearance flow at low flow rate condi- tion was analyzed with relation to the distribution of ve- locity fluctuation due to the interference between the tip leakage vortex and the adjacent pressure surface of the blade. However, the relation between the aerodynamic sound and the tip leakage vortex near the rotor tip in ax-
ial flow fan is unclear in detail.
The purpose of the present study is to clarify the rela- tion between fan noise and velocity fluctuations of tip leakage flow around rotor blade of a low pressure axial flow fan in the cases of the design and off design point. The correlation measurements between the velocity fluc- tuation of tip leakage flow and the aerodynamic noise are made using a rotating hot-wire sensor near the rotor tip in the rotating frame.
2. Experimental Apparatus and Procedure
The schematic view of the experimental apparatus is shown in Figure 1. It was an open-loop facility having the duct inner diameter of 579 mm. The facility consisted of a bellmouth inlet, a fan driving motor connected by the belt, a damper and a booster fan. The aerodynami- cally designed damper was used to adjust the flow rates.
The present study was performed on low speed axial flow fan of the tip clearance of 2 mm, the outer radius of 287.5 mm and the number of blades of 9. A flow coeffi- cient () and a total pressure rise coefficient (t) are defined as
2 2
4
π t h
Q
D D U
Figure 1. Experimental apparatus.
2
2 t
t t
P U
(2)
where Q is the volume flow rate, Dt the rotor tip diame- ter, Dh the rotor hub diameter, Ut the rotor tip speed, ΔPt the total pressure rise, and ρ the air density. The fan has a design flow coefficient of 0.41. Figure 2 shows the total pressure rise t plotted against flow coefficient of the test fan. The total pressure rise was measured by us- ing 5-hole pitot tube. The rotor blade has NACA 65 se- ries profile sections designed by free vortex operation. The blade stagger angle at the rotor tip is 63.9 deg. The experimental measurements were carried out at the de- sign operating condition of = 0.41 and off design con- ditions of = 0.31, 0.47 while rotational speed of the fan rotor was kept constant, 1000 rpm. The blade tip section of the rotor has the solidity of 0.65 and the chord length of 131 mm. Reynolds number based on the rotor tip speed and the rotor tip chord length is 2.5 × 10⁵. The
trailing edges of the rotor blades were semicircle shape which thickness δt were 2.0 mm over the whole span of the blades.
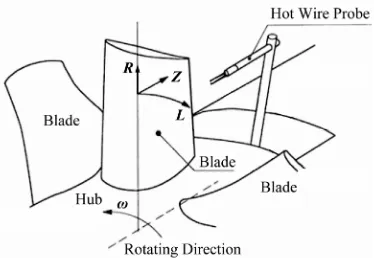
The velocity fluctuation near blade tip was measured from a relative frame of reference fixed to the rotating blade by using an I-type hot-wire sensor which rotated with the same speed of the blade. The hot-wire was a tungsten filament wire of 5-μm diameter. The schematic view of the experimental apparatus used in the present experiment is shown in Figure 3. The hot-wire sensor was traversed and fixed at pre-determined location by a computer controlled traversing system even when it was turning. The traversing probe was controlled by the three-dimensional traversing system, i.e., radial, axial and rotational directions, installed inside of the hub with traverse resolution of 0.3 mm.
The wire of the probe sensor was set parallel to the ra- dial direction of the rotor blade. The output from this sensor was automatically sampled by a computer and the statistical values were calculated. The spectrum analysis
0.1 0.2 0.3 0.4 0.5
0.2 0.3 0.4 0.5
Ψt
Φ Φ=0.31 Maximum
pressure Φ=0.41 Design
[image:2.595.129.468.88.240.2]Φ=0.47 Overflow
Figure 2. Total pressure rise of test fan.
Figure 3. Schematic of the test section.
of the velocity fluctuation was performed using FFT analyzer. The output from the hot-wire probe was carried from a rotating frame to a stationary frame through slip ring unit installed inside of the hub as shown in Figure 1.
Figure 4 shows a measuring area around rotor blade in the blade passage. The measuring area on the L-Z plane is 96 per cent span of blade and R-Z plane is from 0.90 to 0.97.
[image:2.595.330.517.421.550.2]Figure 4. Measuring area around rotor blade.
resolution was estimated to be 5.0 Hz.
The resonance curve was measured by the supply of sinusoidal tone from the speaker at the outlet of test duct as shown in Figure 1, and the damping ratio ζ was obtained by the half power method. This measurement of acoustic damping ratio was carried out in the condition without the flow.
3. Results and Discussion
3.1. Acoustic Resonance Frequency in the Duct
The resonant frequency in the Z-direction of the duct is given by
2
m
ma f
L
(1)
where a is the sound velocity, L the length of the duct, and m the number of standing waves in the duct. Natural resonance frequencies in the Z-direction of the duct are about 86.9Hz (m=3), 144.8 Hz (m = 5), 173.8 Hz (m = 6), 231.7 Hz (m = 8), 405.5 Hz (m = 14), 550.3 Hz (m = 19), etc., when the temperature of the flow t is 20˚C.
Figure 5 shows the typical result of measured fre- quency response characteristic in the test duct. The mul- tiple peaks were formed at the frequency response spec- trum. The peak frequencies of f5 = 140 Hz, f6 = 175 Hz, f8
= 235 Hz, f14 = 405 Hz and f19 = 550 Hzagree with the
resonance frequencies calculated by Equation (1) al- though there are the bellmouth, hub, honeycomb and chamber in the test duct. It is considered that the other peaks of 185 Hz, 210 Hz and 355 Hz etc. were formed by the acoustic resonance of the Z-direction coupled with the other direction.
Figure 6 shows the variation of acoustic damping ratio
ζ plotted against the resonance frequencies.The acoustic damping ratio became local minimum at about 175 Hz. It is considered that it is easy to generate the acoustic reso- nance of this mode in the test duct.
3.2. Aerodynamics Sound of Test Fan
Figure 7 shows the spectra of aerodynamic sound for the operating conditions: = 0.28 - 0.44. In the figure, n
indicate the harmonic frequencies of blade passing where the fundamental blade passing frequency BPF is 150 Hz.
0 0.2 0.4
0 200 400 600
p
2
fHz
f5=140Hz
185Hz 210Hz
f6=175Hz
f8=235Hz
f14=405Hz
355Hz
565Hz
f19=550Hz
Figure 5. Frequency response characteristic.
0 0.04 0.08 0.12
60 100 140 180
ζ
fHz
Figure 6. Acoustic damping ratio.
40 60 80
0 200 400 600 800
SP
L
d
B
f Hz
Φ=0.28 Φ=0.29
Φ=0.32 Φ=0.37
Φ=0.39 Φ=0.41
Φ=0.44
175Hz
n=2
BPF=150Hz(n=1)
n=3 n=4
90Hz
Figure 7. Sound pressure level of test fan.
The spectral peak at about 175 Hz excepting the har- monic of BPF is observed from = 0.28 to 0.32.
Figure 8 shows the variation of peak sound pressure level (SPL) at about 175 Hz. It should be noted that the peak level increase below the flow rate = 0.32 al- though the SPL over = 0.37 have almost same values irrespective of the flow rate .
3.3. Velocity Fluctuation near Bade Tip at Design Point
55 65 75
0.2 0.3 0.4 0.5
L B
SPL
d
B
Figure 8. Variation of peak SPL at 175 Hz.
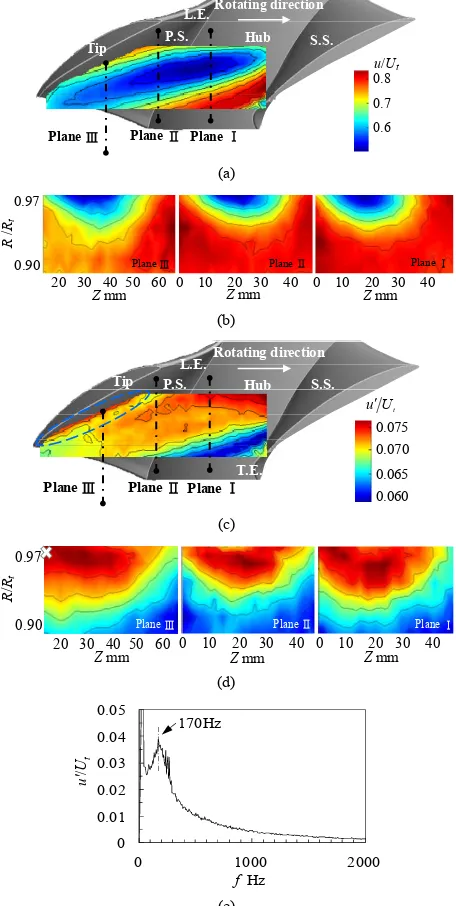
Figure 9(b) shows the distributions of u/Ut on the R-Z
plane. The low velocity region on the R-Z plane distrib- utes circular cross section near the casing in the blade passage and moves to the casing surface in the down- stream direction.
The distribution of turbulence intensity on the L-Z
plane of 96 per cent span is shown in Figure 9(c) as the contour maps of the coefficient of the velocity variation,
u'/Ut. This coefficient was defined as the ratio of the in- tensity u', i.e. the standard deviation of velocity fluctua- tion, to the circumferential velocity of the blade tip Ut. And Figure 9(d) shows the distributions of the turbu- lence intensity on the R-Z plane. Evidently, the intense velocity fluctuations on the each plane are observed near the corresponding low velocity region as shown in Fig- ures 9(a) and (b). It is considered that this region results from the tip leakage vortex [7]. The tip leakage vortex formed on suction side grows in the downstream direc- tion without interference with the pressure surface of adjacent blade in the design operating condition.
It is well known that the intense velocity fluctuation is closely related to the aerodynamic sound generation.
Figure 9(e) shows the typical spectrum of velocity fluc- tuations at the max point (×symbol) in Plane III of
Figure 9(d). The spectrum is obtained by a FFT analyzer, which averages each value 64 times at a measuring posi- tion. The spectrum was broad-band and the periodicity of velocity fluctuation became weak although single peak was formed at about 320 Hz in the spectrum.
u
3.4. Velocity Fluctuation near Blade Tip at off Design Point
In the present study, the peak level increased below the flow rate = 0.32 as described in Figure 8. Hereafter, the flow structure and the spectral characteristics of the fluctuating velocity in the blade passage are discussed in the axial flow fan at the maximum pressure rise condition of = 0.31, because the increase of SPL is predicted due to the stall below the flow rate = 0.29.
Figure 10 shows the contour of relative velocity and turbulence intensity for = 0.31. The low velocity and the intense velocity fluctuation region near the pressure
Hub
P.S. S.S.
Tip
T.E. Rotating direction L.E.
Plane Ⅲ Plane Ⅱ Plane Ⅰ
1.1
1.0
0.9 u/Ut
(a)
0 10 20 30 40 0.97
0.90
Zmm 20 30 40 50 60
Zmm 40 50 60 70 80 90
Zmm
Plane Ⅰ
Plane Ⅱ
Plane Ⅲ
R
/
Rt
(b)
Hub
P.S. S.S.
Tip
T.E. Rotating direction L.E.
Plane Ⅲ Plane Ⅱ Plane Ⅰ
0.09 0.07 0.05 u’/Ut
0.11 t u U
(c)
0.97
0.90
0 10 20 30 40 Zmm 20 30 40 50 60
Zmm 40 50 60 70 80 90
Zmm
Plane Ⅰ
Plane Ⅱ
Plane Ⅲ
R
/
Rt
(d)
0 0.01 0.02
0 1000 200
u'
/
Ut
f Hz 0
320Hz
Δf
(e)
Figure 9. Design operating point (Φ = 0.41, αt = 3.8˚). (a)
Contour map of relative velocity (L-Z plane); (b) Contour map of relative velocity (R-Z plane); (c) Contour map of turbulence intensity (L-Z plane); (d) Contour map of tur- bulence intensity(R-Z plane); (e) Spectrum of velocity fluc- tuation.
surface of the adjacent rotor blade is observed. These regions move closer to the pressure side as the flow rate decreases, and the tip leakage vortex interferes with the pressure surface of the adjacent blade. Especially, the intense velocity fluctuation presents near the pressure surface (dotted blue line in Figure 10(c)).
Figure 10(e) shows the typical spectrum of velocity fluctuations at the umax point (× symbol) in Plane III of
Hub P.S. S.S. Tip T.E. Rotating direction L.E.
Plane Ⅲ Plane Ⅱ Plane Ⅰ
0.7 0.6 u/Ut 0.8
(a)
0 10 20 30 40 0.97
0.90
Zmm 0 10 20 30 40
Zmm 20 30 40 50 60
Zmm
Plane Ⅰ
Plane Ⅱ
Plane Ⅲ
R / Rt (b) Hub P.S. S.S. Tip T.E. Rotating direction L.E.
Plane Ⅲ Plane ⅡPlane Ⅰ
0.070 0.065 0.060 u’/Ut 0.075 t u U
(c)
0.97
0.90
0 10 20 30 40 Zmm 0 10 20 30 40
Zmm 20 30 40 50 60
Zmm
Plane Ⅰ
Plane Ⅱ
Plane Ⅲ
R / Rt (d) 0 0.01 0.02 0.03 0.04 0.05
0 1000 200
[image:5.595.59.287.88.541.2]u' / Ut f Hz 0 170Hz (e)
Figure 10. Maximum pressure rise point (Φ = 0.31, αt =
8.9˚). (a) Contour map of relative velocity (L-Z plane); (b) Contour map of relative velocity (R-Z plane); (c) Contour map of turbulence intensity (L-Z plane); (d) Contour map of turbulence intensity (R-Z plane); (e) Spectrum of velocity fluctuation.
[image:5.595.308.538.183.669.2]in the spectrum, which was same frequency of the peak of SPL excepting the harmonic of BPF as described in
Figure 7.
Figure 11 shows the contour of relative velocity and turbulence intensity for = 0.47. The low velocity and the intense velocity fluctuation region due to tip leakage vortex distributes in the blade passage without interfere- ence with the adjacent blade surface, which are similar to the results at design condition ( = 0.41). However, the
velocity fluctuation increased at the adjacent blade sur-face because the flow separated from the sursur-face of pressure side of blade.
The spectrum of velocity fluctuation of tip leakage vortex was broad-band and the periodicity of velocity fluctuation became weak as described in Figures 9(e),
10(e) and 11(e). In the present study, the peak frequency
Hub P.S. S.S. Tip T.E. Rotating direction L.E. Plane Ⅱ
Plane Ⅰ 1.1
1.0 0.9 u/Ut 1.2
Plane Ⅲ
(a)
0 10 20 30 40 0.97
0.90
Zmm 20 30 40 50 60
Zmm 40 50 60 70 80 90
Zmm
Plane Ⅰ
Plane Ⅱ
Plane Ⅲ
R / Rt (b) Hub P.S. S.S. Tip T.E. Rotating direction L.E.
Plane Ⅲ Plane Ⅱ Plane Ⅰ
0.13
0.09
0.05 u’/Utt u U
(c)
0.97
0.90
0 10 20 30 40 Zmm 20 30 40 50 60
Zmm 40 50 60 70 80 90
Zmm
Plane Ⅰ
Plane Ⅱ
Plane Ⅲ
R / Rt (d) 0 0.01 0.02 0 1000 u' / Ut fHz 2000 420Hz (e)
Figure 11. Over discharge range (Φ = 0.47, αt = 0.9˚). (a)
band Δf as shown in Figure 9(e) was focused at the op- erating condition from = 0.31 to 0.47. Figure 12
shows the variation of frequency band of velocity fluc- tuation due to tip leakage vortex against the flow coeffi- cient . This frequency band increases with at the constant rotational speed of the fan rotor.
3.5. Correlation between Aerodynamic Sound and Velocity Fluctuation Due to Tip Leakage Vortex
We measured the correlation between the aerodynamic sound and the velocity fluctuations due to tip leakage vortex to clarify the mechanism of increase of the peak level of 175 Hz components for flow coefficient .
Figure 13 shows the typical coherence coefficient Cxy for = 0.31 to 0.47. The hot-wire sensor was set at umax
ts around the blade tip, as shown in Figures 9(d),
10(d) and 11(d). umax po ts of = 0.41 and 0.47 were
locations in the blade passage as shown in Figures 9(c)
and 11(c) and that of = 0.31 was near the pressure sur-face of the adjacent rotor blade as shown in Figure 10(c).
Figure 13(a) shows the result of = 0.31. Two peaks were observed at 90 Hz and 175 Hz in the coherence coefficient Cxy. The values of coherence at 90 Hz and 175 Hz were about 0.19 and 0.32 respectively. These low values were caused by the coherence between the signal of microphone which included all of sound radiated from 9 blades of test rotor and that of the velocity fluctuation from single hot-wire near one blade. It should be noted that these peak frequencies agreed well with the acoustic resonance frequencies of 87.4 Hz and 174.8 Hz which were 3rd and 6th mode of acoustic resonance of duct at 23˚C respectively. The peak levels increased at 90 Hz and 175 Hz in the SPL spectrum as shown in Figure 7, and these frequencies were included in the hump portion of spectrum as described in Figure 10(e). On the other hand, no peak was observed in the frequency response spectrum at 90 Hz as shown in Figure 5 and the acoustic damping ratio increased as shown in Figure 6 although that was local minimum at 175 Hz. This is caused by the effect of excitation position on the generation of acoustic resonance and damping ratio in the duct. Therefore, it is poin
in
0 200 400 600
0.3 0.4 0.5
f
Hz
Φ
Figure 12. Variation of frequency band of spectr m.
con ed
(c) show the results of = 0.41 and 0.
at the aero- dy
u
sidered that the weak acoustic resonance were excit from the sound due to interaction between the tip leakage vortex and the surface of pressure side of the adjacent blade at = 0.31.
Figures 13(b) and
47 respectively. The coherence coefficient become below about 0.06 for all frequencies although the signals of velocity fluctuation and that of SPL included for all frequencies components as described in Figures 7, 9(e)
and 11(e). Therefore, the low values of coherence of 0.32 at 175 Hz and 0.19 at 90 Hz for = 0.31 are sufficiently larger than those of 0.06 for = 0.41 and 0.47. It is con- sidered that the aerodynamic sound at 90 Hz and 175 Hz for = 0.31 correlate the velocity fluctuation near the pressure surface of the adjacent rotor blade.
From above discussion, it is concluded th
namic sound at about 90 Hz and 175 Hz were caused by the weak acoustic resonance excited from the sound due to interaction between the tip leakage vortex and the surface of pressure side of the adjacent blade at = 0.31.
0 0.2 0.4
60 260 460 660 Cxy
f Hz
175Hz
90Hz Φ=0.31 (Plane Ⅲ)
(a)
0 0.2 0.4
60 560 1060 1560 Cxy
f Hz
Φ=0.41 (Plane Ⅲ)
(b)
0 0.2 0.4
60 560 1060 1560 Cxy
f Hz
Φ=0.47 (Plane Ⅲ)
(c)
n fan noise and velocity fluctuations ound rotor blade of a low pressure
d from the maximum pressure operating co
the aerodynamic so
gion due to le
du
5. Acknowledgements
orted by a research grant
REFERENCES
[1] I. J. Sharland, “Sources of Noise in Axial Flow Fans,”
4. Conclusions
The relation betwee of tip leakage flow ar
axial flow fan is investigated experimentally by using rotating a hot-wire sensor at a design and off design op- erating conditions. As a result, the following conclusions were obtained:
1) The spectral peak of SPL excepting the harmonic of BPF is observe
ndition to stall region. This frequency agrees well with the frequencies of velocity fluctuation due to tip leakage vortex at the maximum pressure operating condition and the resonance frequency of the duct;
2) The correlation measurements between the velocity fluctuation of tip leakage flow and
und were made using a rotating hot-wire sensor near the rotor tip in the rotating frame. The correlation be- tween the velocity fluctuation due to tip leakage flow near the pressure surface of the adjacent rotor blade and the acoustic pressure were increased at the maximum pressure operating point. This sound was caused by the weak acoustic resonance excited from the sound due to interaction between the tip leakage vortex and the surface of pressure side of the adjacent blade;
3) At the design operating condition, the low velocity and the intense velocity fluctuation re tip
akage vortex distributed in the blade passage without interference with the adjacent blade surface. This region distributed circular cross section in the blade passage and moved to the casing surface in the downstream direction;
4) At the maximum pressure operating condition, the low velocity and the intense velocity fluctuation region e to tip leakage vortex near the pressure surface of the adjacent rotor blade was observed. This region moved closer to the pressure side as the flow rate decreased, and interfered with the pressure surface of the adjacent blade. This frequency of velocity fluctuation increased with the
flow rate at the constant rotational speed of the fan rotor.
This investigation was supp
from Harada commemorative foundation.
Journal of Sound and Vibration, Vol. 1, No. 3, 1964, pp. 303-322. doi:10.1016/0022-460X(64)90068-9
[2] T. Fukano, Y. Kodama and Y. Senoo, “Noise Generated
0551-X
by Low Pressure Axial Flow Fans, I: Modeling of the Turbulent Noise,” Journal of Sound and Vibration, Vol. 50, No. 1, 1977, pp. 63-74.
doi:10.1016/0022-460X(77)9
and Y. Takamatsu,
“Control of Tip-vortex Noise of Axial [3] T. Fukano, A. A. Talukuder, T. Kozu
“Discrete Frequency Noise Generated from a Flat Plate in Parallel with a Uniform Oncoming Flow,” Memoirs of the Faculty of Engineering Kyushu University, Vol. 44, No. 1, 1984, pp. 19-39.
[4] R. E. Longhouse,
Flow Fans by Rotating Shrouds,” Journal of Sound and Vibration, Vol. 58, No. 2, 1978, pp. 201-214.
doi:10.1016/S0022-460X(78)80075-3
[5] T. Fukano, Y. Takamatsu and Y. Kodama, “The Effects of Tip Clearance on the Noise of Low Pressure Axial and Mixed Flow Fans,” Journal of Sound and Vibration, Vol. 105, No. 2, 1986, pp. 291-308.
doi:10.1016/0022-460X(86)90158-6
[6] F. Kameier and W. Neise, “Experimental Study of Tip Clearance Losses and Noise in Axial Turbomachines and Their Reduction, American Society of Mechanical Engi-neers,” Journal of Turbomachinery, Vol. 119, No. 3, 1997, pp. 460-471. doi:10.1115/1.2841145