The influence of obesity duration on left ventricular
mass, volume and function: A pilot study
Juan Ybarra1, June H. Romeo2*, Sandra Férnandez1, Joan Sanchez-Hernandez3 1Centro Médico Teknon, Barcelona, Spain
2Center for Health Disparities, Baldwin Wallace University, Berea, USA; *Corresponding Author: [email protected] 3CIBER de Diabetes y Enfermedades Metabólicas Asociadas (CIBERDEM), Barcelona, Spain
Received 4 November 2012; revised 9 December 2012; accepted 21 December 2012
ABSTRACT
Introduction: Despite the bulk of evidence be- tween obesity and cardiovascular complications, the effect of the duration of obesity (DOO) on cardiac function has so far received limited at- tention. The aim of the study is to study the re- lationship between a new, American Heart As- sociation (AHA) and World Health Organization (WHO)-adapted formula for reporting DOO with echocardiographic findings and co-morbidities in a large cohort of individuals whose BMI ranged from normal (<25 Kg·m−2) to morbid obesity (>40 Kg·m−2) and had been obese for
varying lengths of time. Methods: 198 (M60/F138) asymptomatic patients were recruited. Patients were classified according to their reported DOO. The normal weight group (N = 92 (40/F52) was formed by those patients who did not recall maintaining a BMI > 30 Kg·m−2 from age 18 while those recalling maintenance of a BMI > 30 Kg·m−2 since age 18 and thereafter formed the obese group (N = 106 (M20/F86)). A detailed clinical, echo-cardiographic and analytical study was performed. Results: DOO in our series dis- closed a significant correlation with left ven- tricular architecture and hemodynamics, left ventricular mass, cardiac output as well as the prevalence of diabetes mellitus, hypertension and insulin resistance. Stepwise multiple re- gression analysis revealed that almost 54% of the inter-ventricular septum thickness’s vari- ance can be independently predicted by a model including DOO, gender, hypertension and log- transformed HOMA. Conclusions: Our formula for estimating the duration of obesity provides a simple, user-friendly tool whose utilization in bariatric preoperative assessments and in ad- vanced nursing practice deserves prospective studies.
Keywords:Duration of Obesity; Echocardiography; Co-Morbidities
1. BACKGROUND
Obesity is a worldwide epidemic; 66% of United States adults are overweight or obese [1], and a preva- lence of obesity up to 31% has been reported in Europe [2]. If current trends continue, the number of obese indi- viduals is expected to rise to over 1 billion worldwide by 2030 [3].
Obesity is associatedwith an increased risk of morbid- ity and mortality and is associatedwith reduced life ex- pectancy [4,5]. There is a considerable body of data con- firming obesity as a risk factor for severe cardiovascular complications, such as coronary heart disease, heart fail- ure, stroke and venous thromboembolic disease [6-10]. Despite the bulk of evidence between obesity and car- diovascular complications [6-10], the permanent effects of obesity on cardiac function have so far received lim- ited attention. Indeed, one publication reports longer du- ration of morbid obesity (estimated by subtracting the current age from the age at which the individual’s body weight equalled or exceeded twice their ideal body weight, the latter being derived from 1993 Metropolitan Life Insurance Tables) being associated with higher left ventricular (LV) mass, poorer LV systolic function, and greater impairment of LV diastolic filling [11].
definitions [13,14] and co-morbidities and echocardio- graphic findings has not, to the best of our knowledge, been correlated in large series of patients. Hence, we sought to study the relationship between this new American Heart Association (AHA) and World Health Organization (WHO)-adapted formula for reporting du- ration of obesity with echo-cardiographic findings (LV mass, internal dimensions in systole and diastole and diastolic dysfunction), co-morbidities and metabolic pa- rameters (adiponectin and the HOMA-IR index) in a large cohort of individuals whose BMI ranged from normal (<25 Kg·m−2) to morbid obesity (>40 Kg·m−2) and who had been obese for varying lengths of time.
2. MATERIALS AND METHODS
2.1. Patient PopulationOne hundred and ninety eight (N = 198; M/F = 60/138) asymptomatic patients without underlying cardiac dis- ease were included in the study. They were consecutively recruited from 1) the pool of individuals attending Centro Laparoscópico Ballesta (CLB) at Centro Médico Teknon and 2) from the pool of apparently healthy pa- tients undergoing routine medical check-ups during that same time-period at the same medical facility (Medical Check-up Unit, Centro Médico Teknon) in Barcelona, Spain from January 1st until December 31st 2010.
Exclusion criteria were: current coronary artery dis- ease, current/prior angina, or myocardial infarction, cur- rent/prior history of arrhythmia, cardiovascular co-mor- bidity (prior cerebrovascular accidents and/or peripheral vascular disease), current therapy with vasoactive drugs, statins or fibrates, current/prior alcohol consumption averaging > 60 g/day, active smoking, creatinine > 2 mg/dl, presence of neoplasia and/or systemic disease, suboptimal echocardiographic window.
From age 18 on, the time period (years) in which pa- tients had sustained a body weight corresponding to a BMI ≥ 30 Kg·m−2 was defined as duration of obesity (DOO years). Briefly, the body weight (Kg) correspond- ing to a BMI of 30 Kg·m−2 was calculated as the squared height times 30, according to the AHA and WHO defini- tion of obesity [13,14]. Thus, asking the patient how many years since age 18 had she/he maintained that body weight defined the duration of obesity. The duration of obesity information was obtained by the same trained observer (JY), using a systematic mode of in-person in- terview during the initial visit. Patients were further sub-classified into two groups, according to the reported DOO. Those patients who did not recall maintaining a body weight corresponding to a BMI ≥ 30 Kg·m−2 from age 18 and thereafter formed the normal weight group (NW group) while those recalling maintaining a body weight corresponding to a BMI ≥ 30 Kg·m−2 since age 18
and thereafter formed the obese group (Obese group). Anthropometrical measurements were performed by the same trained observer (JY) after participants had re- moved their shoes and heavy clothing. Weight (digital scales: Seca, Germany) and height (portable stadiometers: Holtain, Crymych, UK) were obtained and body mass index (BMI), defined as weight (Kg) divided by the height squared (in meters) was calculated. Excessive body weight (EBW) is reported according to Deitel et al.
[15].
All patients underwent a detailed clinical, biochemical and echocardiography study. Patients were considered to be hypertensive according to Mancia’s criteria [16].
Written informed consent was obtained from each pa- tient according to the standards established by the hospi- tal’s ethics committee.
2.2. Echocardiography
A Standard two-dimensional M-mode color Doppler echocardiography was performed on all patients using a 2.5 MHz transducer (ALOKA ProSound SSD-4000) by the same experienced echocardiographist according to an established protocol.
Telediastolic and telesystolic left ventricular (LV) di- ameters were measured whereas volume and cardiac output were calculated according to Teicholz’s formula [17]. LV mass was calculated by means of Devereux’s formula [18]. LV hypertrophy was defined according to Framingham’s criteria (LV mass/BSA > 110 g/m2 in fe- males and LV mass/BSA > 134 g/m2 in males) [19]. LV, left atrium (LA) and inter-ventricle septum (IVS) meas- urements were determined according to the American Society of Echocardiography [20]. LA enlargement was defined as LA size > 40 mm.
Intra-observer variability was estimated to be 0.0 - 1.0 mm and 5% for wall thickness assessment and LV di- ameters, respectively.
2.3. Biochemical Measurements
Blood samples were drawn from each subject after an overnightfast (10 - 12 hours). Serum was spun at 4000 g for 10 min,immediately divided into aliquots, and frozen at –80˚C until analysis. Serum glucose concentrations were measured in duplicate by the glucose oxidase method with the use of a BeckmanGlucose Analyser II (Beckman Instruments, Brea, CA). The coefficient of variation was 1.9%.
index [21].
Plasma adiponectin concentrations were measured us- ing a commercial human adiponectin RIA kit (Linco, Labodia SA, Yens, Switzerland) whose detection limit and intra- and inter-assay coefficient of variation were 2.0 ng/ml, 5.0 and 5.0%, respectively. Normal adi- ponectin results were considered above 10.0 µg/ml [22]. Cholesterol and triglycerides were measured by enzy- matic methods; LDL-cholesterol was calculated by Friedwald’s formula and HDL-cholesterol after precipi- tation of apoB containing lipoproteins.
2.4. Statistical Analysis
The sample size was calculated as follows: assuming an α riskof 0.05, a β risk of 0.10, and a unilateral test,50 subjects were needed in each group to detect a statistic- cally significantcorrelation, with r = 0.30. A greater number of patients wereincluded to further decrease the α and βrisks. Before statistical analysis, normal distribu- tion and homogeneity of the variances were tested. Qualitative variables are expressed as sample size (num- ber of cases) and percentage (%), and quantitative vari- ables are expressed as mean and standard error of the mean (SEM). The relationship between two qualitative variables was assessed using Chi-squared test with a continuity correction whenever necessary. The relation- ship between two quantitative variables was assessed using Pearson’s correlation coefficient. Level of statistic- calsignificance was set at P < 0.05. Data were analysed and figures constructed using the SPSS 15.0 statistical package (SPSS Inc., Chicago, IL, USA).
3. RESULTS
Demographic and biochemical characteristics of the participants are illustrated in Table 1. The study popula- tion (including both groups) was 70% female, and in- cluded a wide spectrum of BMI ranging from 22 to 70 kg/m2. Age ranged from 20 to 65 in women and to 55 in men. There were no age differences between both groups.
[image:3.595.310.537.145.526.2]As shown, BMI, body weight and obesity duration were higher in the obese group (P < 0.0005; for all three). Moreover, both heart rate, systolic and diastolic blood pressure values were also higher in the obese group (P < 0.0005). Hypertension and diabetes were more prevalent in the obese group while basal glucose, insulin and HOMA-IR were higher (P < 0.0005) and adiponectin lower in the obese group (P < 0.001). Lipid profiles were similar between both groups. The TG/HDL-C ratio was significantly higher in the obese group (P < 0.0005). Heart rate was lower while systolic and diastolic blood pressures were lower in the NW group (P < 0.005 for all). All patients displayed a regular sinus rhythm on twelve lead surface electrocardiograms (data not shown).
Table 1. Demographic and biochemical characteristics of the participants. NW: normal weight, BMI: Body Mass Index, SBP: systolic blood pressure, DLP: dyslipidemia, DBP: diastolic blood pressure, HR: heart rate, HOMA-IR: homeostasis model assessment. ***P < 0.0005, **P < 0.001, *P < 0.05.
NW (N = 92) OBESE (N = 106)
Age (years old) 37.8 ± 0.9 38.9 ± 1.0
Gender (M/F) M40/F52 M60/F138
Duration of Obesity (years) 0 10.9 ± 0.7*
Weight (Kg) 70.6 ± 1.4 126.3 ± 2.4*
BMI (Kg·m−2) 24.0 ± 0.3 46.4 ± 0.7*
SBP (mm Hg) 116 ± 1.3 128 ± 1.5*
DBP (mm Hg) 75 ± 0.9 78 ± 1.2*
HR (bpm) 70 ± 1.3 83 ± 1.0*
DM prevalence (%) 1.0 9.0*
HTN prevalence (%) 1.0 32.0*
DLP prevalence (%) 3.5 4.4
Glucose (mg/dl) 80.0 ± 1.0 88.8 ± 2.7*
Insulin (µUI/L) 10.7 ± 0.5 19.9 ± 1.3*
HOMA-IR 2.1 ± 0.1 4.3 ± 0.4*
Adiponectin (ng/dl) 22.8 ± 1.1 6.8 ± 0.7*
TG/HDL-C 1.7 ± 0.2 2.6 ± 0.2*
Total cholesterol (mg/dl) 210 ± 33 197 ± 3.0
LDL-cholesterol (mg/dl) 96.5 ± 28.5 115 ± 2.2
HDL-cholesterol (mg/dl) 54 ± 9.5 54 ± 0.9
Triglycerides (mg/dl) 100 ± 31 132 ± 4.8
Echocardiographic characteristics of the participants appear illustrated in Table 1. As depicted, ejection frac- tion (EF) was similar between both groups. On the con- trary, left ventricle mass (LVM), inter-ventricular septum (IVS), Teicholz’s cardiac output (CO-Tei), left atrium size (LA) and diastolic and systolic cardiac volumes (DV, SV) and diameters (DD, SD) were significantly higher in the obese group (P < 0.0005).
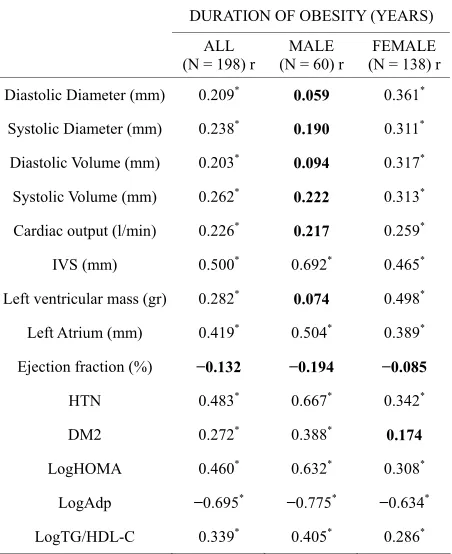
Univariate correlation analysis of obesity duration vs. demographic, biochemical and echocardiographic pa- rameters are depicted in Table 2. The first column stands for the entire population while the second and third col- umns show the results of male and female participants, respectively.
Table 2. Univariate correlation analysis of duration of obesity vs demographic, biochemical and echocardiographic parame- ters. r: Univariate (Pearson’s) correlation coefficients; EF: ejec- tion fraction, LVM: left ventricle mass, IVS: interventricle septum, CO-Teicholz: cardiac output by Teicholz method, DV: diastolic volume, SV: systolic volume, DD: diastolic diameter, SD: systolic diameter, HTN: hypertension prevalence, DM2: diabetes mellitus prevalence, LogHOMA: log-transformed homeostasis model assessment, LogAdp: log-transformed adi- ponectin, LogTG_HDL-C: log transformed [TG/HDL_C] ratio. ***: P < 0.001, **: P < 0.01, *: P < 0.05.
DURATION OF OBESITY (YEARS)
ALL
(N = 198) r (N = 60) r MALE (N = 138) rFEMALE
Diastolic Diameter (mm) 0.209* 0.059 0.361*
Systolic Diameter (mm) 0.238* 0.190 0.311*
Diastolic Volume (mm) 0.203* 0.094 0.317*
Systolic Volume (mm) 0.262* 0.222 0.313*
Cardiac output (l/min) 0.226* 0.217 0.259*
IVS (mm) 0.500* 0.692* 0.465*
Left ventricular mass (gr) 0.282* 0.074 0.498*
Left Atrium (mm) 0.419* 0.504* 0.389*
Ejection fraction (%) −0.132 −0.194 −0.085
HTN 0.483* 0.667* 0.342*
DM2 0.272* 0.388* 0.174
LogHOMA 0.460* 0.632* 0.308*
LogAdp −0.695* −0.775* −0.634*
LogTG/HDL-C 0.339* 0.405* 0.286*
umes and diameters as well as cardiac output in the whole population and in the female group. Conversely, these correlations did not reach statistical significance in the male participants. The inter-ventricular septum and left atrium showed a more robust correlation with the DOO in the male group while the left ventricular mass correlation only reached significance in the female group. Conversely, ejection fraction indexes showed no correla- tion with the duration of obesity in either group.
Similar statistically significant correlations were found between BMI and/or excess body weight (EBW) with all the echocardiographic parameters described previously, gender bias included (data not shown). Noteworthy, all the echocardiography results provided by our apparel take into account height and weight.
Regarding co-morbidities and metabolic parameters for the whole group, the self-reported DOO disclosed direct significant correlations with hypertension and dia- betes prevalence, log-transformed HOMA and log-trans- formed TG/HDL-C ratio. An inverse significant correla-
tion appeared with log-transformed adiponectin. Male participants disclosed more robust correlations than their female counterparts. The correlation between diabetes mellitus and the duration of obesity did not reach statis- tical significance in female participants.
Table 3 illustrates a stepwise multiple regression analysis including variables related to inter-ventricular septum thickness (IVS; dependent variable). As shown, 53.9% of its variance can be independently predicted by the DOO, gender, hypertension and log-transformed HOMA. Excluded variables were age, systolic and dia- stolic blood pressure values, heart rate, diabetes and log- transformed adiponectin. Self-reported DOO accounts for as much as 30.0% of IVS’s variance by itself in this model whereas gender, hypertension and log transformed HOMA add (11%, 2.8% and 3.0%, respectively) of the variance (data not shown).
4. DISCUSSION
The most novel finding in our study is the significant influence of a new definition of the self-reported dura- tion of obesity (DOO) on echocardiographic findings (diastolic and systolic cardiac volumes and diameters, cardiac output, inter-ventricular septum, left ventricular mass and left atrium diameters), co-morbidities and metabolic parameters in a large cohort of individuals whose BMI ranged from normal to morbid obesity.
[image:4.595.312.536.597.714.2]The study population (including both obese and con- trols) was 70% female, in agreement with the vast major- ity of literature in this field where female participants largely outnumber their male counterparts [23,24]. The obese participants had sustained a BMI equal or above 30 Kg·m−2 for an average of 11 years whereas the control group did not recall sustaining a BMI above 30 Kg·m−2 at anytime in their lives (P < 0.0005). Body weight and BMI were significantly higher in the obese group (P <
Table 3. Stepwise multiple regression analysis including vari- ables related to inter-ventricular septum thickness (IVS; de- pendent variable). IVS: inter-ventricular septum thickness, log- HOMA: log transformed HOMA, log-adiponectin: log trans- formed adiponectin.
Dependent variable
Independent
variables Coefficients (β) P
Constant <0.0005
Obesity duration (DOO) 0.280 0.007
Gender −0.359 <0.0005
Hypertension 0.216 0.020
IVS [r2 = 0.539; P = 0.0004]
Log-HOMA 0.205 0.033
0.0005, respectively) (Table 1).
The prevalence of the most commonly encountered co-morbidities (diabetes mellitus and hypertension) was significantly higher in the obese group, in agreement with previous reports [23,24]. Dyslipidemia prevalence (according to the ATP III guidelines) was low and similar in both groups [25] (Table 1). Glucose, insulin and HOMA-IR were significantly higher and adiponectin concentrations significantly lower in the morbidly obese group (P < 0.0005) in agreement with previous reports [23,24,26] (Table 1). The triglycerides/HDL-cholesterol ratio, a surrogate marker of insulin resistance [27], was higher in the obese group, as reported previously [24]. Lipid profiles (see Table 1) only showed mild abnor- malities (increased triglycerides concentrations and/or decreased HDL-cholesterol concentrations) which did not resemble the atherogenic lipoprotein profile associ- ated with obesity and insulin resistance [28]. As a whole, they represent metabolically fit obese individuals [29].
The obese group displays increased systolic and dia- stolic blood pressure as well as heart rate compared with the NW group (P < 0.0005 for all) in agreement with previous reports [23,24,26] (Table 1).
The echocardiography differences in structure and function between normal-weight and obese participants (Table 2) lie in agreement with previous reports [10,13, 23,30] and are attributable to the hemodynamic reper- cussion of obesity. As depicted, obese individuals dis- close significantly higher diastolic and systolic volumes and diameters as well as left atrium size and left ven- tricular mass. Noteworthy, systolic fraction (represented by ejection fraction parameter) appears unaffected.
These findings can be explained by the increment in total blood volume and cardiacoutput that is caused in part by the increased metabolic demandinduced by ex- cess body weight [31,32]. At any given levelof activity, the cardiac workload is greater for obese subjects [33,34] who have a higher cardiac output and a lower totalpe- ripheral resistance than do lean individuals. The in- creasedcardiac output is attributable mostly to increased stroke volumebecause heart rate increases little if at all [35,36]. Hence, the obese group in our series displayed significantly higher left ventricular mass, cardiac output, left atrium diameter, diastolic and systolic volumes and diameters (Table 2), in agreement with previous reports [10,13,23,31-33]. Furthermore, left ventricular mass stands as independent cardio-vascular risk factor accord- ing to previous reports [6-9].
When DOO is compared with echocardiographic findings in our series there appears a clear gender di- morphism with male obese participants not disclosing statistical significance in the correlation between their DOO and diastolic and systolic diameters and volumes, cardiac output and left ventricular mass (Table 2). Fur-
thermore, there were no significant differences in habit- ual exercise between genders (data not shown) that could account for these differences. Our data fall in partial dis- agreement with previous reports where duration of mor- bid obesity was significantly associated with larger left ventricular mass in both genders; nevertheless, duration of obesity was calculated by a different formula (1993 Metropolitan Life Insurance Tables derived ideal body weight) [11].
Regarding the issue of a gender dimorphism in the correlation between DOO and left ventricular mass, dia- meters and volumes as well as cardiac output, with women being affected and men protected, we are puzzled since one would expect the contrary, taken into account that: 1) cardiac enlargement is an important predictor of adverse cardiovascular events among healthy middle- aged and elderly people [37] and 2) cardiovascular dis- ease seems to affect men earlier than women [6]. In the Bogalusa Study obesity was the strongest and most con- sistent determinant of left ventricular diastolic diameter among both men and women, emphasizing the impor- tance of obesity as a risk factor for left ventricular end- diastolic dilatation and potentially subsequent cardio- vascular events, specifically heart failure [38]. Unfortu- nately, no information is provided regarding the duration of obesity and its correlation with left ventricular end- diastolic dilatation in that particular study. Regarding speculation on gender differences between DOO and cardiac systolic and diastolic volumes and diameters, the particular issue of technical difficulties was raised and the cardiologist was asked whether that might account for the observed results. No differences in technical dif- ficulty (suboptimal echocardiographic windows, lack of compliance, etc.) between genders were reported by the single cardiologist performing the entire set of echocar- diograms. Additionally, the intra-observer variability re- ported in the methods section could not account for the observed gender differences.
The correlation between DOO and cardiac output in our series (Table 2) have not been reported using the same methodology but fall in agreement with the patho- physiology and hemodynamics of obesity per se [32-35].
A likely explanation for the inter-ventricular septum and left atrium showing a more robust correlation with the DOO in the male group while the left ventricular mass correlation only reaches significance in the female group is at present lacking in the literature; nevertheless, correlations between the duration of morbid obesity and left ventricular mass without gender bias, have been re- ported previously [11].
Finally, the correlation between the duration of obesity and hypertension and diabetes found in our series (Table 2) has been described previously using different formulas for estimating the duration of obesity [6-9]. Noteworthy, the correlations between duration of obesity and insulin resistance, sensitivity and atherogenic dyslipidemia found in our series have also been reported previously [29], using different formulas for estimating the duration of obesity.
The self-reported DOO in conjunction with gender, hypertension and log-HOMA in our series accounts for as much as almost 54.0% of the inter-ventricular sep- tum’s variance. Noteworthy, DOO by itself explains as much as 30% of the variance in this model whereas gen- der, hypertension and log transformed HOMA add (11%, 2.8% and 3.0%) of the variance, respectively (Table 3). This has not, to the best of our knowledge, been reported before and stands as a novelty, stressing out the impor- tance of the duration of obesity on both hemodynamics and heart structure.
One of the main drawbacks of our study concerns the concept of duration of obesity (DOO) by itself. It is well known that self-reported weight and height data are sub- ject to random error and systematic reporting bias [39]. Hence, self-reported assessment of obesity is notoriously inaccurate; nevertheless, self-report of weight and height and the duration of obesity data employed in our study show significant differences when compared to those in the literature [39,40]. As already described in the Meth- ods section, the DOO data in our study was obtained by the same trained observer (JY), using an identical mode of in-person interview during the initial visit. There was not a time issue when performing the questions leading to a historical reconstruction of weight evolution. Addi- tionally, taking into account the demographic character- istics of our study population, height was assumed to not have changed significantly since age 18. We are not aware of other studies using our very same methodology for reporting DOO. Thus we are unaware of the reliabil- ity of DOO and/or random errors and systematic report- ing biases.
In summary, our AHA and WHO-adapted formula for estimating the duration of obesity provides a user- friendly tool for predicting co-morbidities such as left ventricular diameters and volumes, left ventricular mass, cardiac output as well as the prevalence of diabetes mel- litus, hypertension and atherogenic dyslipidemia. Hence, its utilization in bariatric preoperative assessments in advanced practice nursing shows promise.
A gender bias appears regarding male obese partici- pants not disclosing statistical significance in the correla- tion between their DOO and diastolic and systolic di- ameters and volumes, cardiac output and left ventricular mass. This latter issue remains to be elucidated and war-
rants prospective studies.
REFERENCES
[1] Ogden, C.L., Carroll, M.D., Curtin, L.R., et al. (2006) Prevalence of overweight and obesity in the United States, 1999-2004. JAMA, 295, 1549-1555.
doi:10.1001/jama.295.13.1549
[2] Elmadfa, I. and Freisling, H. (2009) Nutritional status in Europe: Methods and results. Nutrition Reviews, 67, S130-S134. doi:10.1111/j.1753-4887.2009.00175.x [3] Kelly, T., Yang, W., Chen, C.S., Reynolds, K. and He, J.
(2008) Global burden of obesity in 2005 and projections to 2030. International Journal of Obesity, 32, 1431-1437. doi:10.1038/ijo.2008.102
[4] Fontaine, K.R., Redden, D.T., Wang, C., Westfall, A.O. and Allison, D.B. (2003) Years of life lost due to obesity.
JAMA, 289, 187-193. doi:10.1001/jama.289.2.187 [5] Olshansky, S.J., Passaro, D.J., Hershow, R.C., Layden, J.,
Carnes, B.A., Brody, J., Hayflick, L., Butler, R.N., Alli- son, D.B. and Ludwig, D.S. (2005) A potential decline in life expectancy in the United States in the 21st century.
New England Journal of Medicine, 352, 1138-1145. doi:10.1056/NEJMsr043743
[6] Hubert, H.B., Feinleib, M., McNamara, P.M., et al. (1983) Obesity as an independent risk factor for cardiovascular disease: A 26-year follow-up of participants in the Fram- ingham Heart Study. Circulation, 67, 968-977.
doi:10.1161/01.CIR.67.5.968
[7] Kenchaiah, S., Evans, J.C., Levy, D., et al. (2002) Obe- sity and the risk of heart failure. New England Journal of Medicine, 347, 305-313. doi:10.1056/NEJMoa020245 [8] Murphy, N.F., MacIntyre, K., Stewart, S., et al. (2006)
Long-term cardiovascular consequences of obesity: 20- year follow-up of more than 15.000 middle-aged men and women (the Renfrew-Paisley study). European Heart Journal, 27, 96-106. doi:10.1093/eurheartj/ehi506
[9] Ounpuu, S., Negassa, A. and Yusuf, S. (2001) INTER- HEART: A global study of risk factors for acute myocar- dial infarction. American Heart Journal, 141, 711-721. doi:10.1067/mhj.2001.114974
[10] Poirier, P., Alpert, M.A., Fleisher, L.A., Thompson, P.D., Sugerman, H.J., Burke, L.E., Marceau, P. and Franklin, B.A.; American Heart Association Obesity Committee of Council on Nutrition, Physical Activity and Metabolism, Council on Cardiopulmonary Perioperative and Critical Care, Council on Cardiovascular Surgery and Anesthesia, Council on Cardiovas (2009) Cardiovascular evaluation and management of severely obese patients undergoing surgery: A science advisory from the American Heart Association. Circulation, 120, 86-95.
doi:10.1161/CIRCULATIONAHA.109.192575
[12] Himes, J.H. and Bouchard, C. (1985) Do the new Metro- politan Life Insurance weight-height tables correctly as- sess body frame and body fat relationships? American Journal of Public Health, 75, 1076-1107.
doi:10.2105/AJPH.75.9.1076
[13] Poirier, P., Giles, T.D., Bray, G.A., Hong, Y., Stern, J.S., Pi-Sunyer, F.X. and Eckel, R.H. (2006) Obesity and car- diovascular disease: Pathophysiology, evaluation, and ef- fect of weight loss: An update of the 1997 American Heart Association scientific statement on obesity and heart disease from the Obesity Committee of the Council on Nutrition, Physical Activity, and Metabolism. Circula- tion, 113, 898-901.
doi:10.1161/CIRCULATIONAHA.106.171016
[14] World Health Organization (2000) Obesity: Preventing and managing the global epidemic. WHO Technical Re- Port Series No. 894. World Health Organization, Geneva. [15] Deitel, M. and Greenstein, R.J. (2003) Recommendations
for reporting weight loss. Obesity Surgery, 13, 159-160. doi:10.1381/096089203764467117
[16] Mancia, G., de Backer, G., Dominiczak, A., et al. (2007) Guidelines for the management of arterial hypertension: The task force for the management of arterial hyperten- sion of the European Society of Hypertension (ESH) and of the European Society of Cardiology (ESC). Journal of Hypertension, 25, 1105-1187.
doi:10.1097/HJH.0b013e3281fc975a
[17] Teichholz, L.E., Kreulen, T.H., Herman, M.V., et al. (1976) Problems in echocardiographic volume determina- tions: Echocardiographic-angiographic correlation in the presence of absence of asynergy. American Journal of Cardiology, 37, 7-11. doi:10.1016/0002-9149(76)90491-4 [18] Devereux, R.B. and Reiche, N. (1987) Echocardiographic
determination of left ventricular mass in man. Anatomic evaluation of the method. Circulation, 59, 956-960. [19] Levy, D., Savage, D.D., Garrison, R.J., et al. (1987)
Echocardiographic criteria for left ventricular hypertro- phy: The Framingham Heart Study. American Journal of Cardiology, 59, 956-960.
doi:10.1016/0002-9149(87)91133-7
[20] Quinones, M.A., Otto, C.M., Stoddard, M., et al. (2002) Recommendations for quantification of Doppler echocar- diogaphy. A report from the Doppler quantification task force of the nomenclature and standards committee of the American Society of Echocardiogaphy. Journal of the American Society of Echocardiography, 15, 167-184. doi:10.1067/mje.2002.120202
[21] Matthews, D.R., Hosker, J.P., Rudenski, A.S., et al. (1985) Homeostasis model assessment: Insulin resistance and -cell function from fasting plasma glucose and insulin concentration in man. Diabetologia, 28, 412-419. doi:10.1007/BF00280883
[22] Steffes, M.W., Goss, M.D., Lee, D.H., et al. (2006) Adi- ponectin, visceral fat, oxidative stress, and early macro- vascular disease: The Coronary Artery Risk Development in Young Adults Study. Obesity, 14, 319-326.
doi:10.1038/oby.2006.41
[23] Ybarra, J., Resmini, E., Planas, F., Navarro-López, F., Webb, S., Pou, J.M., Santos, A. and Ballesta-López, C.
(2009) Relationship between adiponectin and left atrium size in uncomplicated obese patients: Adiponectin, a link between fat and heart. Obesity Surgery, 19, 1324-1332. doi:10.1007/s11695-009-9924-5
[24] Ybarra, J., Pou, J., Planas, F., et al. (2007) Correlation between insulin resistance surrogates and echocardio- graphic findings in asymptomatic patients with morbid obesity: A cross-sectional study. Endocrine Practice, 13, 590-600.
[25] Bertoni, A.G., Bonds, D.E., Steffes, S., Jackson, E., Crago, L., Balasubramanyam, A., Chen, H. and Goff Jr., D.C. (2006) Quality of cholesterol screening and management with respect to the National Cholesterol Education’s Third Adult Treatment Panel (ATPIII) guideline in pri- mary care practices in North Carolina. American Heart Journal, 152, 785-792. doi:10.1016/j.ahj.2006.04.017 [26] Ybarra, J., Planas, F., Navarro-López, F., Pujadas, S.,
Pujadas, J., Jurado, J. and Pou, J.M. (2009) Association between sleep-disordered breathing, aminoterminal pro- brain natriuretic peptide (NT-proBNP) levels and insulin resistance in morbidly obese young women. European Journal of Internal Medicine, 20, 174-81.
doi:10.1016/j.ejim.2008.01.019
[27] McLaughlin, T., Reaven, G., Abbasi, F., et al. (2005) Is there a simple way to identify insulin-resistant individuals at increased risk of cardiovascular disease? American Journal of Cardiology, 96, 399-404.
doi:10.1016/j.amjcard.2005.03.085
[28] Nieves, D.J., Cnop, M., Retzlaff, B., Walden, C.E., Brun- zell, J.D., Knopp, R.H. and Kahn, S.E. (2003) The atherogenic lipoprotein profile associated with obesity and insulin resistance is largely attributable to intra-ab- dominal fat. Diabetes, 52, 172-179.
doi:10.2337/diabetes.52.1.172
[29] Pataky, Z., Bobbioni-Harsch, E. and Golay, A. (2010) Open questions about metabolically normal obesity. In- ternational Journal of Obesity, 34, S18-S23.
doi:10.1038/ijo.2010.235
[30] Poirier, P., Martin, J., Marceau, P., Biron, S. and Marceau, S. (2004) Impact of bariatric surgery on cardiac structure, function and clinical manifestations in morbid obesity.
Expert Review of Cardiovascular Therapy, 2, 193-201. doi:10.1586/14779072.2.2.193
[31] Alpert, M.A. (2001) Obesity cardiomyopathy; patho- physiology and evolution of the clinical syndrome. Ame- rican Journal of the Medical Sciences, 321, 225-236. doi:10.1097/00000441-200104000-00003
[32] Kasper, E.K., Hruban, R.H. and Baughman, K.L. (1992) Cardiomyopathy of obesity: A clinicopathologic evalua- tion of 43 obese patients with heart failure. American Journal of Cardiology, 70, 921-924.
doi:10.1016/0002-9149(92)90739-L
[33] Mattsson, E., Larsson, U.E. and Rossner, S. (1997) Is walking for exercise too exhausting for obese women?
International Journal of Obesity and Related Metabolic Disorders, 21, 380-386. doi:10.1038/sj.ijo.0800417 [34] Poirier, P. and Despres, J.P. (2001) Exercise in weight
[35] Kaltman, A.J. and Goldring, R.M. (1976) Role of circu- latory congestion in the cardiorespiratory failure of obe-sity. American Journal of Medicine, 60, 645-653. doi:10.1016/0002-9343(76)90499-X
[36] Messerli, F.H., Nunez, B.D., Ventura, H.O. and Snyder, D.W. (1987) Overweight and sudden death: Increased ventricular ectopy in cardiopathy of obesity. Archives of Internal Medicine, 147, 1725-1728.
doi:10.1001/archinte.1987.00370100039008
[37] Yusuf, S., Nestico, P.F., Hakki, A.H. and Iskandrian, A.S. (1985) Left ventricular dilatation: Prognostic value in sever left ventricular dysfunction secondary to coronary artery disease. Chest, 88, 215-220.
doi:10.1378/chest.88.2.215
[38] Bazzano, L.A., Belame, S.N., Patel, D.A., Chen, W., Srinivasan, S., McIlwain, E. and Berenson, G.S. (2011) Obesity and left ventricular dilatation in young adulthood: The bogalusa heart study. Clinical Cardiology, 34, 153- 159. doi:10.1002/clc.20896
[39] Ezzati, M., Martin, H., Skjold, S., Vander Hoorn, S. and Murray, C.J. (2006) Trends in national and state-level obesity in the USA after correction for self-report bias: Analysis of health surveys. Journal of the Royal Society of Medicine, 99, 250-257. doi:10.1258/jrsm.99.5.250 [40] Zhang, J., Feldblum, P.J. and Fortney, J.A. (1993) The