May 17, 2019
MASTER THESIS
MITIGATING BASEL IV IMPACT WITH NEW
SECURITISATION METHODOLOGIES
SUPPORTED BY A BLOCKCHAIN
ENVIRONMENT
Maarten Roland Takken
Industrial Engineering and Management (IEM)
Specialisation Financial Engineering and Management (FEM)
Department Industrial Engineering and Business Information Systems (IEBIS) Faculty Behavioural Management and Social Sciences (BMS)
Exam committee: Dr. B. Roorda (IEBIS)
Prof.dr.ir. A. Bruggink ( IEBIS)
Abstract
Acknowledgements
With this thesis I will finalise my academic career at the University of Twente and obtain my master degree in Financial Engineering and Management. My time at the University of Twente and in Enschede has always been exciting and I am saddened to see it come to an end, though I look forward to the next chapter in my life. For their roles in my student life, I would like to extend my appreciation to my rowing association Euros and its members, my fraternity Boght, and my student house the BBT.
For his major role in helping me with my thesis, I would like to thank my supervisor at Deloitte, Stijn Roersch. Thank you for being willing to sit down with me for coffee a year ago when I first started looking for a company to do my thesis at and most of all thank you for your brilliant guidance and advice over the past months.
The same gratitude goes to my first supervisor at the university, Berend Roorda. While I already had the pleasure of having you as a lecturer for various courses and as an advisor in my academic career, I’m grateful that you were also willing to take me on as a thesis student. Your continued work within Financial Engineering at the University of Twente is greatly appreciated by me and my fellow students.
A thank you as well to my second university supervisor Bert Bruggink. Per chance, it was your name and your lecture at Management Control for Financial Institutions that I mentioned in my motivation letter as a reason for wanting to do my thesis at the Financial Risk department of Deloitte. Thank you for your inspirational lecture and thank you for taking the time to act as my second supervisor.
As I always will be, I am grateful to my parents, Roland and Dorien Takken. Your unwavering support and your wise advice has been and always will be my greatest asset. Whether that be advice on study choices, career paths, or on what shoes look best with my suit, it has been very valuable to me.
Contents
1. Introduction 1
1.1. Background . . . 2
1.1.1. Basel IV . . . 2
1.1.2. Advanced Internal Ratings-Based Approach . . . 3
1.1.3. Basel IV impact . . . 4
1.1.4. Securitisation and the Blockchain . . . 5
1.2. Research Objective and Questions . . . 5
1.3. Research Methodology . . . 6
1.4. Research Relevance . . . 7
1.5. Thesis Outline. . . 8
2. Securitisation in the Blockchain 9 2.1. The Securitisation Environment and Developments . . . 10
2.2. The New Environment . . . 11
2.3. Topics . . . 14
2.3.1. Data Sharing, Transparency and Reliability . . . 14
2.3.2. Smart Contracts . . . 15
2.3.3. Tokenisation . . . 15
2.4. Criteria . . . 16
2.5. New Methodologies . . . 17
2.5.1. Securitisation Dashboard and API. . . 17
2.5.2. Mortgage Splitting . . . 18
2.5.3. Mortgage Swapping . . . 18
3. Standard Securitisation and its Financial Benefits 19 3.1. Balance Sheet and Income Statement . . . 19
3.2. Securitisation Retainment . . . 21
3.3. Present Value of a Mortgage and Securitisation Costs . . . 22
3.4. Interest Rates . . . 23
3.4.1. Relevant Components . . . 23
3.4.2. Interest Rate Formulas . . . 25
3.5. Securitisation Scenarios. . . 26
3.5.1. Scenario Restrictions . . . 27
3.5.3. Second Debt-financed Mortgage . . . 28
3.5.4. Second Full-security Financed Mortgage . . . 29
3.6. ROE Comparison . . . 30
3.7. LTV Variation. . . 31
3.8. Sensitivity Analysis . . . 33
4. Mortgage Splitting and its Financial Benefits 35 4.1. The Loan-Splitting Approach . . . 35
4.2. Collateral in Mortgage Splitting . . . 38
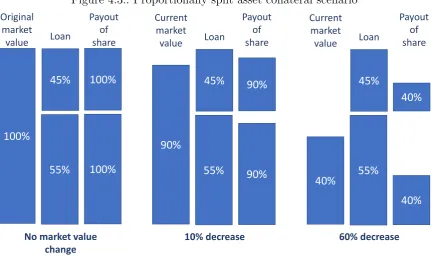
4.2.1. Proportionally Split Asset . . . 38
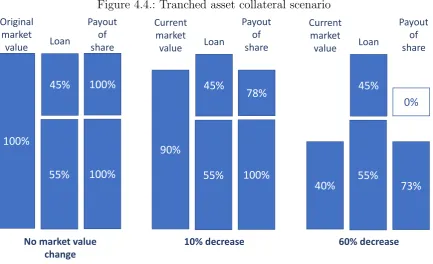
4.2.2. Tranched Asset . . . 39
4.2.3. Loss Given Default . . . 40
4.2.4. The LTV Equivalent . . . 41
4.2.5. The Correct Collateral Method . . . 43
4.2.6. Increased Risk Investor . . . 44
4.3. Securitisation Scenarios. . . 45
4.3.1. Securitisation Retainment . . . 45
4.3.2. Single Mortgage Bank . . . 46
4.3.3. Second Debt-financed Mortgage . . . 46
4.3.4. Second Standard Security Financed Mortgage . . . 47
4.3.5. Second Split-security Financed Mortgage . . . 48
4.4. ROE Comparison . . . 50
4.5. LTV Variation. . . 51
4.5.1. Loan-Splitting Approach . . . 51
4.5.2. Standard Approach versus Loan splitting Approach . . . 53
4.6. Sensitivity Analysis . . . 55
5. Mortgage swapping and its financial benefits 57 5.1. The Concept . . . 58
5.2. Numerical example . . . 60
5.3. LTV Variation. . . 62
5.4. Re-financing Limitations . . . 64
5.5. Sensitivity Analysis . . . 65
5.6. Modelling Increased Risk . . . 67
5.6.1. Changing house prices . . . 67
5.6.2. Effect of house prices on CLTCMV . . . 68
5.6.3. Effect of house prices on LGD . . . 70
5.7. Risk Effects in Practice . . . 71
5.7.1. Risk Premium . . . 71
5.7.2. Housing Price Changes and Mortgage Distribution . . . 72
6. The Effects of Different Methodologies on the RW of a Mortgage Portfolio 73 6.1. ABN AMRO Security. . . 74
6.3. Capital Floors of the different RW Approaches . . . 76
6.4. Mitigation . . . 77
6.5. The RWA effects . . . 80
7. Conclusion 83 7.1. Conclusions to the First Research Question. . . 83
7.2. Conclusions to the Second Research Question . . . 84
7.3. Conclusions to the Third Research Question . . . 85
7.4. Conclusion . . . 86
8. Discussion and Future Research 87 A. Basel 89 A.1. The Banking Book . . . 89
A.2. Basel I, II, III . . . 90
B. Securitisation 91 B.1. The Process . . . 92
B.2. Senior-Subordinated Structure . . . 93
C. Blockchain 95 C.1. Distributed Ledger Technology. . . 96
C.2. Chained Blocks . . . 98
C.3. Proof of Work and Proof of Stake . . . 99
C.4. Smart contracts . . . 100
C.5. Tokenisation . . . 101
D. Sensitivity Analyses 103
List of Tables
1.1. Risk Weights for different Loan to Values . . . 3
1.2. Effect of Basel IV on mortgage portfolio capital requirements . . . 4
3.1. Typical balance sheet . . . 20
3.2. Interest rate components . . . 24
3.3. Interest rates for the elements of a balance sheet . . . 26
3.4. Balance sheet - single mortgage bank - SA . . . 28
3.5. Income statement - single mortgage bank - SA . . . 28
3.6. Balance sheet - second debt-financed mortgage - SA . . . 29
3.7. Income statement - second debt-financed mortgage - SA . . . 29
3.8. Balance sheet - second full-security financed mortgage - SA . . . 29
3.9. Income statement - second full-security financed mortgage - SA . . . 30
3.10. ROE summary - SA . . . 30
4.1. Balance sheet - single mortgage bank - LSA . . . 46
4.2. Income statement - single mortgage bank - LSA . . . 46
4.3. Balance sheet - second debt-financed mortgage - LSA . . . 47
4.4. Income statement - second debt-financed mortgage - LSA . . . 47
4.5. Balance sheet - second standard security financed mortgage - LSA . . . . 47
4.6. Income statement - second standard security financed mortgage - LSA. . 48
4.7. Balance sheet - second mortgage-splitting security financed mortgage - SA 48 4.8. Income statement - second mortgage-splitting security financed mortgage - SA . . . 49
4.9. Balance sheet - second mortgage-splitting security financed mortgage - LSA 49 4.10. Income statement - second mortgage-splitting security financed mortgage - LSA . . . 49
4.11. ROE summary - SA and LSA . . . 50
5.1. Mortgage swapping portfolios . . . 60
5.2. Balance sheet - pre-swap . . . 61
5.3. Income statement - pre-swap . . . 61
5.4. Balance sheet - post-swap . . . 62
5.5. Income statement - post-swap . . . 62
5.7. Average weighted CLTCMV ratios for changing housing prices of a
Stan-dard and a Mortgage Swapping portfolio . . . 70
5.8. Loss Given Default in millions for changing housing prices of a Standard and a Mortgage Swapping portfolio . . . 71
6.1. A-IRB weights of Dutch banks . . . 75
6.2. Basel IV LSA formulas for different LTV buckets . . . 76
List of Figures
2.1. The securitisation process and the relevant parties . . . 12
2.2. Data sharing in the current scenario and in the Blockchain scenario . . . 14
3.1. The ROE of different standard approach securitisation scenarios for
var-ious LTV ratios . . . 32
4.1. RW for different LTVs using the Standardised and Loan-Splitting Approach 36
4.2. Mortgage Splitting . . . 37
4.3. Proportionally split asset collateral scenario . . . 39
4.4. Tranched asset collateral scenario . . . 40
4.5. Share payouts for different collateral scenarios at different market value
decreases . . . 41
4.6. CLTCMVs for different collateral scenarios at different market value
de-creases . . . 43
4.7. The ROE of different mortgage splitting securitisation scenarios for
vari-ous LTV ratios . . . 52
4.8. The ROE of different standard approach and mortgage splitting
securiti-sation scenarios for various LTV ratios . . . 54
5.1. Mortgage swapping . . . 59
5.2. The ROE of a pre-swap and post-swap portfolio for various LTV ratios . 63
5.3. The ROE of a pre-swap and post-swap portfolio for various mortgage interest rates where the post-swap portfolio has a 0,35% lower mortgage
interest rate . . . 66
5.4. ROE of a pre-swap and post-swap portfolio for various debt interest rates (with a proportionally adjusted deposit interest rate) where the post-swap
portfolio has a 0,35% lower mortgage interest rate . . . 66
5.5. Housing prices in the Netherlands from 1995 to 2018 . . . 68
5.6. Standard portfolio and Mortgage Swapping portfolio . . . 69
5.7. Effects of changing housing prices on CLTCMVs of a Standard portfolio. 69
5.8. Effects of changing housing prices on CLTCMVs of a Mortgage Swapping
portfolio . . . 70
6.1. ABN AMRO security mortgage size distribution . . . 74
6.3. Securitisation of 10% of Value - Mortgage Swapping . . . 79
6.4. Securitisation of 10% of Value - Mortgage Splitting (top) . . . 79
6.5. The value of RWA of a mortgage portfolio as measured by the A-IRB approach for various degrees of standard securitisation and the implied value of RWA floors of various securitisation methods as weighed by the
LSA and the SA. . . 81
B.1. Securitisation Structure and Tranches . . . 93
C.1. Structure of the Blockhain . . . 98
D.1. The ROE of different standard approach securitisation scenarios for
var-ious mortgage interest rates . . . 104
D.2. The ROE of different standard approach securitisation scenarios for var-ious debt interest rates (with a proportionally adjusted deposit interest
rate) . . . 105
D.3. The ROE of different mortgage splitting securitisation scenarios for
vari-ous mortgage interest rates. . . 106
D.4. The ROE of different mortgage splitting securitisation scenarios for var-ious debt interest rates (with a proportionally adjusted deposit interest
rate) . . . 107
D.5. The ROE of a pre-swap and post-swap portfolio for various mortgage
interest rates . . . 108
D.6. The ROE of a pre-swap and post-swap portfolio for various debt interest
List of Abbreviations
A-IRB Advanced Internal Ratings Based
API Application Programming Interface
CLTCMV Current Loan To Current Market Value
DLT Distributed Ledger Technology
IAA Internal Assessment Approach
LGD Loss Given Default
LS Loan-Splitting
LSA Loan-Splitting Approach
LTV Loan To Value
MFP Matched Funding Principle
NMa Nederlandse Mededingingsautoriteit
RCA Regulatory Capital Arbitrage
ROE Return On Equity
RW Risk Weight
RWA Risk Weighted Asset
SA Standard Approach
SEC-ERBA Securitisation-External Ratings Based Approach
SEC-IRBA Securitisation-Internal Ratings Based Approach
SEC-SA Securitisation-Standardised Approach
Introduction
1
The banking sector is often seen as a static environment, but it is in fact constantly evolving and at a pace that requires constant adaption. This thesis sits at the intersection of three topics within banking that have seen or caused great upheaval and development: Blockchain, securitisation, and the regulatory environment. The introduction of the new framework Basel IV1 has Dutch banks worried given the large effects it might have on the capital that they are required to hold and subsequently on their profits as banks will be able to invest less. The effects for Dutch banks are larger compared to those in other countries given the large mortgage portfolios of Dutch banks.
The severity of these effects has sparked a need for the reduction of the capital require-ments. Different possibilities exist, but the possible mitigation of these effects might be found in securitisation.
In recent years, multiple parties have performed research on securitisation in a Blockchain environment. One of these is Deloitte Netherlands, whose exploratory research into this topic sparked our interest given the current regulatory developments. While securitisa-tion in a Blockchain environment was primarily investigated by Deloitte Netherlands for various benefits native to the Blockchain, it might also open up new as of yet unexplored securitisation methodologies. These methodologies are presented and explored in this thesis.
Provided in the first section of this chapter is a introduction to the topic of Basel IV in which we showcase the large impact it will have. This will be followed by a brief introduction to Securitisation on the Blockchain. These will give the reader a context in which to place the sections that follow, amongst which are the research relevance, the research questions, and the outline of this thesis.
1Substantial upcoming changes to the current Basel framework are colloquially known as Basel IV,
1.1. Background
In this section we will provide the reader an introduction to the topic of Basel IV and the effect it will have on Dutch banks. Briefly introduced thereafter is the concept of Securitisation and Blockchain, though this will mainly be explored in Chapter 2.
A more extensive literature research has been performed on the topics of Basel I-III, Securitisation, and the Blockchain. For this, we kindly refer the reader to Appendix
A (Basel), Appendix B (Securitisation) and Appendix C (Blockchain). It is a
recom-mended read for anyone completely unfamiliar with any of these topics. However, a basic understanding should be sufficient.
1.1.1. Basel IV
It is in the interest of the economy for all banks to be stable entities. Banks sit in the middle of a financial web and their downfall could be of harm to other financial institutions and the financial system as a whole, possibly triggering a systemic crisis that negatively affects the monetary system as well as the rest of the economy (Moch, 2013). A bank going bankrupt is thus costly and should be avoided. For this, laws and requirements from governments and regulators are in place. The most important framework is that developed by the Basel committee, which is often adopted in to law by institutions and countries around the world.
The framework of Basel is in constant development, the latest iteration of which is Basel IV. One of the important changes that it introduces are those relating to the risk weights of residential mortgages. Risk weights are percentages by which the value of an asset is multiplied in order to determine the capital that a bank is required to hold for that asset. Changing risk weights are especially relevant for Dutch banks as they have atypically large mortgage portfolios with high Loan to Value (LTV) ratios. A total of 60% of Dutch mortgages are currently interest only meaning that these high LTV ratios are often maintained as loans aren’t paid off (Mastrogiacomo & van der Molen,2015).
In Basel IV, risk weights will depend on various factors. This as opposed to the previously universally applied 35% risk weight for a residential mortgage. Different splits will be made depending both on whether the mortgages are residential or commercial, whether the general requirements are met, whether the repayment is dependent on cash flows generated by the property, and what the Loan to Value ratios are. Most mortgages in the Netherlands are residential mortgages where repayment is not materially dependent on cash flows generated by the property and where general requirements are met. Table
1.1 shows the new risk weights for various LTV ratios for this category.
Table 1.1.: Risk Weights for different Loan to Values Loan to Value Risk Weight
LTV ≤ 50% 20%
50% < LTV ≤ 60% 25%
60% < LTV ≤ 80% 30%
80% < LTV ≤ 90% 40%
90% < LTV ≤ 100% 50% LTV > 100% 70%
(Committee on Banking Supervision, 2017)
1.1.2. Advanced Internal Ratings-Based Approach
Table 1.1 of the previous subsection would be used if a bank were to apply the Stan-dardised Approach (SA). It is Basel’s pre-described method used to determine the Risk Weights of assets on a banking book.
However, it is also possible for a bank to make use of the Advanced Internal Ratings-Based Approach (A-IRB). This is a different approach to determine the Risk Weights of assets and makes use of a bank’s internal models for its expected loss on the asset.
All major Dutch banks make use of the A-IRB which gives them an average RW of 13% compared to a RW of 35% if they were to apply the SA (Koppen et al., 2018). If it was only the Risk Weights that changed in Basel IV the banks would be unaffected as they all make use of the A-IRB.
1.1.3. Basel IV impact
The impact of Basel IV on the level of capital a Dutch bank is required to hold will be significant. For this reason it has been widely discussed in various Dutch newspapers. The ’Nieuw Rotterdamsche Courant’ reports that according to the European Banking Authority the largest European banks will have to hold an additional 39,7 billion euros of capital (NRC, 2017). The ’Financieel Dagblad’ reports that Dutch banks specifically might have to expect a 14 billion euro increase (Keuning & de Horde, 2017). The ’Volkskrant’ comments on the possible effects of this increase, such as increased costs for consumers, loans with lower LTVs, or new players on the mortgage market such as insurances and pension funds replacing traditional banks (Haegens, 2017). A bank that has to hold more equity might see a drop in their Return on Equity (ROE), an important measure of financial performance.
Deloitte Netherlands has done preliminary calculations on the effect of Basel IV on a typical Dutch bank with 100 billion in assets and 33.62 billion in Residential Real Estate assets specifically. The Risk Weighted Assets (RWA) is the value of a banks assets multiplied by their respective RWs. This was done for both a SA bank and an A-IRB approach bank. The results are briefly summarised in Table 1.2.
Table 1.2.: Effect of Basel IV on mortgage portfolio capital requirements
Basel III Basel IV
Risk weight RWAs Risk weight RWAs Effect
SA 35% 11.77 45% 15.29 +30%
Risk weight RWAs Floor Output Floor Effect
A-IRB 13% 4.28 72,5% 11.10 +159%
(Koppen et al., 2018)
1.1.4. Securitisation and the Blockchain
A common method for reducing the portfolio size of a bank (and thus reducing the total capital requirements) is through securitisation. In securitisation financial products called securities are created from the cash flows of assets, which can amongst others include mortgages. These securities are then sold to a third party which removes the underlying assets from the banking book and thereby reduces the amount of capital that the bank has to hold.
In recent years research preliminary albeit limited research has been done on moving securitisation to a Blockchain environment. Amongst these are an article on the pos-sibility of securitisation in a Blockchain environment as published by members of law firm Hogan Lovells (Cohen, Samuelson, & Katz, 2017) and more elaborate conceptual research by Deloitte USA (Deloitte & Touche,2017). Deloitte Netherlands has also done similar research on the matter though this is confidential.
Benefits quoted are often increased reliability, data transparency, security, automation and decreased costs. However, the digitisation and tokenisation of the securitisation environment might also introduce new possibilities for securitisation. Instead of perma-nently and fully removing a mortgage from the banking book it might be an option to only temporarily remove it from the banking or to only remove part of it.
Combined with new regulations introduced in Basel IV new methodologies for secu-ritisation could be developed. As of yet these possible methodologies are completely unexplored. It is this that sparked the goal and research questions of this thesis.
1.2. Research Objective and Questions
The goal of this thesis is to investigate the mitigation of Basel IV’s effects on the mort-gage portfolios of Dutch banks through the use of innovative securitisation methodologies as supported by a Blockchain environment.
The main research question to guide this thesis is the following:
To what degree do innovative securitisation methodologies as supported by a Blockchain environment allow for the mitigation of Basel IV’s effects
To properly answer this question in a structured manner the following subquestions were developed:
1. What are the benefits and possibilities of securitisation in a Blockchain environ-ment?
2. What effect do different new securitisation methodologies have on the return on equity of a bank looking to fund additional mortgages?
3. What effect do different new securitisation methodologies have on the risk weighted assets of a bank’s mortgage portfolio?
1.3. Research Methodology
We will seek to answer our main research question by first answering our three subques-tions. Together, they should give an encompassing answer that reflects all the facets of the main research question.
The first subquestion will be answered through a literature research. At first we will look at the current securitisation environment and any recent regulatory development. This is done based on various reports published by the European Central Bank, the European Commission, and Basel. By doing so, we seek to make clear the need for a new securitisation environment.
We will then outline the benefits of a Blockchain environment and its possible functioning using reports on securitisation in a Blockchain environment (such as that of Deloitte USA) but also general literature on Blockchain and Blockchain in financial systems. These reports will be supplemented by our own ideas on the matter, especially as it pertains to the new securitisation methodologies.
With this model we will first analyse standard securitisation. Following this, we will also analyse the mortgage splitting methodology and finally also the mortgage swapping methodology. The ROEs of these methodologies in different scenarios will be determined but we will also explain how these methodologies might function and any risks that they might introduce. We deem the qualitative assessment of these methodologies necessary as to justify whether or not they’re attainable and thus whether or not the ROEs might be realistic.
To answer the third subquestion we make use of an existing security of ABN AMRO which reports monthly on the various features of the many mortgages it contains. Using this description, we will model the effects that Basel IV will have on the RWA of a bank owning such a mortgage portfolio. In part, this is done using data from the EU-wide transparency exercises.
After having modelled these effects we will turn to their mitigation through securitisa-tion. We model all the different securitisation methodologies and determine the degree to which they reduce the impact of Basel IV.
1.4. Research Relevance
It is within this context of a changing regulatory landscape and ever-increasing capital requirements that this thesis is set, as banks are looking for different options for the mitigation of these requirements. Holding capital is very costly for banks and will put pressure on their profit margins or force them to transfer the costs to consumers. This is not something which banks can always afford to do given the emergence of other players in the mortgage market which are not bound by the same regulatory requirements. Solutions are therefore required.
1.5. Thesis Outline
In Chapter 2 we will answer the first subquestion. We give an overview of the necessity of a new securitisation environment, describe the benefits that Blockchain could provide, and finally introduce the new securitisation methodologies that this technology could introduce.
In Chapters 3 - 5 we will answer the second subquestion. For clarity and ease of reading this subquestion is answered in three different chapters.
In Chapter 3 we look at the ROE benefits of standard securitisation. In this chapter the concepts and methods are introduced that we will also be used in Chapters 4 and 5 to determine the financial attractiveness of the new securitisation methodologies.
In Chapter 4 the concept of mortgage splitting is analysed.
In Chapter 5 the concept of mortgage swapping is analysed.
In Chapter 6 we will answer the third subquestion. We will do so by determining the effect of the different securitisation methodologies on the risk weight of a realistic mortgage portfolio.
In Chapter 7 we provide a conclusion to this thesis by answering our main research question and provide our recommendations for further research as well as to the possible future of Blockchain and these novel securitisation methodologies.
In Chapter 8 we reflect on the work done in this thesis and ponder upon new research possibilities and opportunities.
Securitisation in the Blockchain
2
Blockchain technology could aid in creating a new and better securitisation environment. This concept will be explored in this chapter in an effort to answer research subquestion 1:
What are the benefits and possibilities of securitisation in a Blockchain environment?
In the first section we will introduce the current status of securitisation in Europe and the developing regulatory environment in which the criteria for “Simple, Transparent and Standardised” securitisation are introduced. This will point out the evolving need for a new securitisation environment.
In the second section we will in short translate the current securitisation environment to that supported by Blockchain technology.
In the third section we will further expand upon some of the main topics touched upon in the second section. These are data transparency, tokenisation, and smart contracts.
In the fourth section we will give some descriptions as to how these topics will aid in meeting some of the “Simple, Transparent and Standardised” criteria for securitisa-tion.
2.1. The Securitisation Environment and Developments
Before the 2008 credit crisis securtisations were becoming increasingly popular. Growth occurred until the start of the financial crisis with total values of securitisation out-standing in Europe and the USA at e2 trillion and US$11 trillion respectively (ECB & BoE, 2014). Often, banks were no longer the holders of loans as in the “old” bank-ing model, but were the originators and distributors. This led to a model dubbed the “originate-to-distribute” (O&D) model.
Unfortunately, the fact that bankers were no longer the primary holders of these assets meant that there was a bigger incentive to take larger risks on loans and less of an incentive to monitor borrowers. This was an important instigator of the financial crisis (Affinito & Tagliaferri, 2010). Since then, issuance rates of securitisations decreased greatly in both regions following the crisis, but have largely recovered in the USA in later years. For Europe this has not been the case for various reasons, amongst which are a “post-crisis stigma”, regulatory capital charges, risk aversion, limited infrastructure and historically low trading volumes (ECB & BoE, 2014). This despite the fact that securitisations in Europe weathered the Credit crisis far better with far lower default rates and negligible losses.
Widely recognised however amongst various European institutions is the value that securitisation might provide for the economy. The ECB names various motivations such as its value as an investment instrument for non-banks and banks, as a funding tool to support real economy lending and reduce funding costs, and as a means of risk transferal by originating banks (ECB & BoE,2014).
Finally, these different papers and publications were combined by the European Com-mission in two legislative proposals, of which the first one focused on “laying down common rules on securitisation and creating a European framework for simple, trans-parent and standardised securitisation...” which we will expand upon later (European Commission,2015b). The other focused on the amendment of the Capital Requirements Regulation for proper capital requirements as relating to securitisation (European Com-mission, 2015a).
2.2. The New Environment
As shown by the European institutions the current securitisation is lackluster. Amongst others low trading volume, high costs, high operational costs and high risk perception hinder the growth of the securitisation market.
Placing the securitisation environment into a Blockchain system would perhaps alleviate these problems. Similar financial infrastructure solutions in the Blockchain are currently being worked on, such as commodity trading, international remittance, share trading, securities settlement, etc.
In a report on “distributed ledger technology in payments, clearing and settlement” by the USA Federal Reserve Board and in a report on “Distributed Ledger Technology (DLT) and Blockchain” by the World Bank Group lists are given of the possible ad-vantages of the Blockchain. Drawing from these lists the following list of benefits was created as pertaining to securitisation and which we believe would be applicable:
1. Decentralisation and disintermediation leading to reduced complexity and lower costs
2. Greater transparency and easier auditability
3. Automation and programmability
4. Reduced operational and financial risks and costs
5. Lower end-to-end processing speed and higher liquidity
6. Enhanced cybersecurity and improved network resilience
The second is that assets (in this case mortgages) are represented in the form of asset-backed tokens. The third is that the securitisation ecosystem in now in a programmable environment.
Shown in Figure2.1are the broad steps currently undertaken in a Securitisation process. As stated before in Section1.1.4, this is loosely based on research by Deloitte and Hogan Lovells as well as my own input (Cohen et al., 2017; Deloitte & Touche, 2017)).
Figure 2.1.: The securitisation process and the relevant parties
1. Loan origination B R
2. Transferal to SPV B R
S
3. Structuring the security S R
4. Rating C R
S
5. Investment I R
S
I R
I2 6. Secondary market
B 7. Loan servicing
Action Parties
Where B = Banks, R = Regulators, S = SVP, C = Credit Agency, I = Investor, I2 = Other investors
We assume these steps are known to the reader. We will now re-assess these steps as if they were placed in a Blockchain environment:
1. Loan origination
2. Transferal to SPV
If the bank wishes to securitise it pools a large amount of tokens. These can be picked for their characteristics such as their high LTV. Double-pledging (the use of a mortgage twice for two different security products) is made impossible. This collection of tokens are then transferred to the SPV who is also a participant on the Blockchain. The transferal is seen as a legal sale and with the proper SPV structure in place it is seen as placing the tokens at arm’s length.
3. Structuring the security
The SPV structures the security as it sees fit, such as setting interest rates and determining tranche sizes. This can include the use of Smart Contracts to provide a clear structure as well to automatise any payments involved. This is further commented upon in Section 2.3.2.
4. Rating
The tokens and the security structure could be rated by a credit agency, just as securities are currently rated. This process is made simple by all data being available on the tokens themselves, thus providing the third party full insight. Smart contracts can be put in place to notify the ratings agency of any substantial changes.
5. Investment
Thanks to the Blockchain system possible investors have complete access to all data involved in the Securitisation. Past default and current default rates can be clearly seen. The structure -as described by smart contracts- adds to the comprehensibility of the product for the investor.
6. Secondary market
The Blockchain allows for easier, faster, and cheaper trading of the securities on a secondary market. Any possible investors will again have full access to all required data and the entire process can be overseen by the regulator.
7. Loan Servicing
During this entire process the loan is serviced by the Bank, though steps might have to be taken that the bank while servicing does not know which mortgage is in a security and which is not to prevent bias. Any changes for mortgages are adjusted in their specific tokens. At all time, the current situation is known to all parties on the Blockchain.
2.3. Topics
We find three different topics as relating to securitisation most important. These are examined in this section.
2.3.1. Data Sharing, Transparency and Reliability
As stated in the introduction to Blockchain in the previous chapter, Blockchain is a form of distributed ledger technology: a decentralised database (Lai & LEE Kuo Chuen, 2018). In a classical securitisation scenario each entity has its own data. The originator, the servicer, the SVP, the investor: all have their own database or are reliant on the partial and potentially outdated or unreliable data provided to them by other parties.
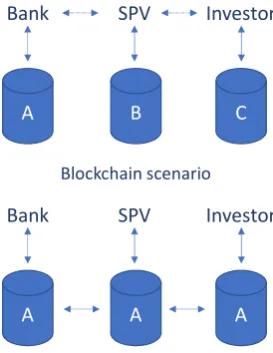
[image:30.595.255.392.418.595.2]This would be altered drastically in a Blockchain scenario. There would be one database containing all non-sensitive information to which the different parties would send updates or make alterations. As a consequence of an alteration, the data that each party has is updated and data is current at all times. This idea is illustrated in Figure 2.2.
Figure 2.2.: Data sharing in the current scenario and in the Blockchain scenario
A
Bank SPV Investor
B C
A
Bank SPV Investor
A A
Current scenario
Blockchain scenario
The Blockchain would keep an immutable ledger of ownership and also provide a trans-action history which would be available to all participants in real time.
recorded and complete. In investment banking, Accenture expects Blockchain to reduce compliance costs by 30-50% (Accenture, 2017). Similar results could be expected here as well.
Its use would lift a veil so to speak: what product you are buying would be clear and precisely defined. This might lead to a higher valuation of securities as there is less uncertainty. The uncertainty associated with and the opaqueness of securities have diminished the popularity of securities in the past and especially now in the wakes of the Credit crisis.
Cryptography is employed for several purposes in the Blockchain, both as a private key to verify the authenticity of a token owner and their intention of making a transaction as well as when encrypting the information on tokens when privacy is required.
2.3.2. Smart Contracts
The use of smart contracts within a Blockchain are a mechanism by which automatic actions can run depending pre-set parameters. Smart contracts created by the bank or SPV are self-executing and would thus not necessarily need human intervention. The securitisation environment could now be deemed “programmable” and act upon information either from the ledger or from other sources. This opens up entirely new possibilities, but will also allow for easier fulfilment of regulatory requirements as well as any other required actions.
Whilst in the past the different actors were reliant on (already outdated) reports, data is now instantaneous and current. The use of this current data can be used to build in triggers to various responses. A delinquency rate above a certain pre-determined rate could set off an alarm for a regulator or an investor.
The use of smart contracts might be of great value in the structure of a security as it relates to tranches and payment fulfillment. The order in which various investors are paid could be made complete automatic depending on pre-defined rules. Not only is the automatisation important, but also the fact that there is once central clearly defined model. It would make impossible any variations between the model of a rating agency, an investor or the SPV.
2.3.3. Tokenisation
The clarity that a tokenised securitisation environment would provide would be a stark difference compared to the previously available data. Currently, an investor would be reliant on summaries or reports as provided by a SVP or bank. In the Blockchain system, every mortgage is accounted for. This too will prevent an issue previously seen in the USA where a single mortgage was included in multiple securities (double pledging). Given that a mortgage is now a traceable digital asset, this will no longer be possible thus improving the quality as well as the reliability of securitisations.
Similarly, the use of tokens will remove a layer from the securitisation ecosystem through which information must flow. The mortgages become actual digital assets that are uniquely examinable and are no longer represented as summaries on reports.
The existence of mortgages as tokens makes them more easily and readily trade-able. It will increase liquidity in what is normally a slow market in which trading is expensive. By increasing the liquidity of this market the balance sheet of a bank is also made more liquid. Tokens are also easily divisible, which will allow for wholly different possibilities which will be commented on upon later.
2.4. Criteria
In this section a selection of the criteria from the European Commission’s Proposal for a European framework for Simple, Transparent and Standardised securitisations are listed and the benefits that Blockchain might provide in the easier or clearer attainment of these criteria are discussed. These benefits are the result of the three topics we have discussed in the previous section.
Criterium 7 of Article 8: “The underlying exposures, at the time of transfer to the SSPE, shall not include exposures in default”.
Criterium 8 of Article 8: “The debtors or the guarantors shall have, at the time of trans-fer of the exposures, made at least one payment”.
The use of a token system where information for each individual mortgage is maintained and current will allow for easy checks as to the current status of the exposure. This will allow for easy verification of these criteria. Built in security checks through the use of smart contracts can automatically prevent the selection of the wrong tokens (or mortgages) for use in a securitisation.
The determination of the total value of all underlying exposures and the comparison to a pre-determined threshold could (very simply put) boil down to a simple SUM and IF statement given the openness of data within the Blockchain and the Smart Contract capabilities.
The use of smart contracts can also be applied to other criteria as was touched upon briefly in the previous section. Any requirements such as loans not being in default upon securitisation can be automatically checked by smart contracts. This will reduce the need for reporting and ensure real-time compliance.
Criterium 3 of Article 10: “The originator or sponsor shall provide a liability cash flow model to investors, both before the pricing of the securitisation and on an ongoing ba-sis”.
This cash flow model can be programmed completely through the use of smart contracts, providing clarity to all parties as well as possibly automating the payment system. The existing code could even be used for investors or regulators as a ready-made simulation for different situations.
Criterium 4 of Article 8: “The securitisation shall be backed by a pool of underlying exposures that are homogeneous in terms of asset type”.
Criterium 1 of Article 9: “The originator, sponsor, or the original lender shall satisfy the risk retention requirement”.
Given that the securitisation will consist of tokens with easy verifiable properties and clear ownership status these criteria are easily verified.
2.5. New Methodologies
The efficiencies provided by securitisation in the Blockchain are meant to greatly reduce the costs and the time needed for a securitisation. We believe that this -combined with the digital possibilities of a Blockchain environment- might open up a few new methods of securitisation. A few of these are described below and mortgage splitting and mortgage swapping will be further discussed in subsequent chapters.
2.5.1. Securitisation Dashboard and API
might envision a dashboard or Application Programming Interface (API) where certain criteria could be selected by an investor. Mortgages from certain regions, with certain LTVs and tranches of a certain size. Whilst we will not explore this concept within this thesis it is clear that this might make securitisations more attractive to a wider range of investors. This same API would allow an investor to oversee their investment and any developments, such as current delinquency information, LTV ratios, geographic distribution or any other information that might be found in a normal monthly report by a security originator.
2.5.2. Mortgage Splitting
In normal securitisation mortgages are securitised as a whole. However, if allowed by the regulators, it can be envisioned that mortgages are not securitised as a whole but in parts. For example, a mortgage represented by a token could be split right down the middle and 50% of the mortgage could be sold. Each half could then be attributed to their own individual token. Half the cash flow would remain in the possession of the bank, and half could be sold to a SPV. The proper rights and cash flows can be incorporated into the tokens through the use of smart contracts.
Whilst this is financially not very interesting, it might become interesting if splits can be made in a different fashion. What if the risky top half of a loan could be sold? As we will see in Chapter 4 this might provide large benefits to a bank.
2.5.3. Mortgage Swapping
The existence of tokens greatly improves the traceability of the individual mortgages as well as the determination of their individual properties. In the old system mort-gages would in a way be “stuck” in the contracts that govern the securitisation process whilst we might envision that in a Blockchain environment the movement of individual mortgages might be much more fluid.
In this regard we expect the securitisation market to become much more dynamic in a Blockchain environment and that liquidity will greatly increase.
Standard Securitisation and its
Financial Benefits
3
In chapters 3 to 5 we will answer the second research subquestion:
What effect do different new securitisation methodologies have on the return on equity of a bank looking to fund additional mortgages?
In order to properly understand and visualise different novel securitisation methodologies and their effect on the theoretical ROE of a bank we must first consider the standard securitisation method as to provide a performance baseline. This will be done in this chapter.
To allow for this we will in the first sections of this chapter will introduce the various components and considerations necessary to properly model a securitisation. These dif-ferent components will be a typical Dutch bank balance sheet, securitisation retainment, the funding costs of a mortgage as well as some other considerations.
In the sections that follow we will model scenarios in which a second mortgage is funded with different types of funding. The effects of this are shown through the use of a balance sheet and an income statement from which we determine the ROE.
3.1. Balance Sheet and Income Statement
Presented below is as an example of a simplified balance sheet for a Dutch bank roughly based on the financial position of ABN AMRO1 (ABN AMRO,2018). A lot of elements,
including for example investments and derivatives, have been omitted so results might seem skewed.
Table 3.1.: Typical balance sheet
Assets Liabilities & Equity
Reserves e10,000 Deposits e70,000
Securities e5,000 Debt e25,000
Loans e85,000 Equity e5,000
TOTAL e100,000 TOTAL e100,000
Reserves are held by a bank for its day to day operations and to maintain liquidity in the case of deposits being withdrawn. Loans are for example mortgages, while securities are securitised loans held by the bank.
Deposits are moneys stored by customers at the bank, debt is funds borrowed by the bank from other institutions, and equity is a bank’s own funds.
In the rest of this thesis we will make use of an income statement as well. An income statement is very comparable to a balance sheet, though instead of it showing the size of the various components it shows their costs or revenues.
From an income statement the return on equity can be determined:
ROE = Net Income
Equity (3.1)
We use ROE as a measure of determining the comparative viability of securitisation or a securitisation method as it is a measure of how effective the bank’s assets are being used and is often used by banks themselves. It reflects simultaneously the importance of a bank’s profitability as well as the high theoretical cost of equity. Using the profitability of the bank or its equity requirements as a measure would result in misleading figures, as either efficiency could be sacrificed for higher profitability or profitability could be sacrificed for lower capital requirements. Though has been given to using the Return on Risk-Adjusted Capital (RORAC) or Risk-Adjusted Return on Capital (RAROC) but given that the risk is already properly reflected in the denominator of ROE by the regulator this was deemed unnecessary.
1ABN AMRO was chosen here as we will be working with an ABN AMRO security as a reference
3.2. Securitisation Retainment
In order to retain an alignment of interest when a bank securitises its mortgage portfolio, a bank is required to “retain a material net economic exposure and demonstrate a financial incentive in the performance of these assets following their securitisation” as stated in Basel’s ’Revisions to the Securitisation Framework’. Otherwise said: a bank must retain a share of the securitisation. It is common to retain 5% (Committee on Banking Supervision,2016). This will be reflected in our balance sheet in our models.
As this securitisation is an asset on a bank’s banking book, this too must adhere to the regulator’s capital requirements and this too is described in Basel’s ’Revisions to the Securitisation Framework’. As a reference securitisation the Class A securities issued by major Dutch bank ABN AMRO which have a S&P rating of AAA will be used 2 (ABN
AMRO,2017).
Different approaches exist for weighing a security which in order of hierarchy as given by Basel are the Internal Ratings Based Approach (SEC-IRBA), the External Ratings Based Approach (SEC-ERBA), the Internal Assessment Approach (IAA), and the Standardised Approach (SEC-SA) (Committee on Banking Supervision, 2016). We will make use of the SEC-ERBA as it is the method highest on the hierarchy for which we can easily determine the weights using publicly available data such as its S&P rating. Given the parameters the Risk Weight of the ABN AMRO securitisation is 20% (Committee on Banking Supervision, 2016). Given that Basel IV will set a capital floor for the use of SEC-IRBA, the SEC-ERBA will also be a good reflection of the likely effects that this will have on a bank’s balance sheet.
Normally a security is divided up into various tranches with different levels of risk as described in Section B.2. These levels of risk would be reflected in the interest rate levels of the various tranches. In our securitisation scenarios we will not take tranches into account. The securitisation will consist of one single tranche and no further distinction is made. The interest levels are thus constant for every part of the securitisation.
2The ABN AMRO security was chosen as ABN AMRO is in the Netherlands the bank with the most
3.3. Present Value of a Mortgage and Securitisation
Costs
There are two one-off costs or profits involved with securitisation which we must give some thought.
One is the possible profit occurred from the selling of the mortgages to the SPV. Mort-gages are a profitable asset and their valuation might also differ for an investor as com-pared to a bank. For this reason, we deem it possible that there might be a difference in the “sales value” and the balance sheet value when mortgage is sold. Unfortunately, we found no proper sources for this within literature. The difference will depend on the valuation of the mortgage, which will depend on a large number of factors of which some will be unknown to us. For this reason, we can not easily determine this with a Net Present Value formula. We must also recognise that the present value-balance sheet dif-ference might be exaggerated by new securitisation methodologies. We will reflect upon the omission of this in Chapter8 when we discuss the shortcomings of this thesis.
Similarly, securitisation costs are also incurred by a bank. A SPV has to be set up, accountants and notaries have to be paid, and operational costs are incurred. Literature on this matter was rather limited. The costs will also differ greatly depending on the experience of the bank in regards to securitisation and whether or not a structure already exists. A Blockchain environment will also alter these costs. Operational costs are expected to drop, leaving us guessing at eventual figures.
Importantly, both of these matters are “one-off”: they will be incurred by the bank once in the case of securitisation and will not be reflected yearly in the income statements. Also, we might imagine that -to some degree- they might cancel each other out.
3.4. Interest Rates
Each element of a balance sheet has its own interest rate which determines either the revenue obtained from it or its cost. These must be determined if we are to analyse the profitability and thus the ROE of a mortgage. This will be done through a method similar to that used by the ’Nederlandse Mededingingsautoriteit’ (NMa), the Dutch Competition Authority . In a report on Dutch mortgage margins that they published in 2010 they analysed the profit rate of a Dutch mortgage by breaking down the interest rates of each element into smaller components (NMA, 2010).
The method of the NMa is based on the Matched Funding Principle (MFP) which is commonly used in determining mortgage rates by Dutch banks. The MFP equates the costs of the mortgage to the costs of its funding. These costs are tailored to both the opportunities that banks have on the financial markets as well as to the lifetime of their mortgages (and thus the lifetime of their funding).
The interest rate of for example a mortgage or a deposit is computed based on different components. These different components will first be introduced below. After this the formulas for the rates of the balance sheet elements are given.
3.4.1. Relevant Components
The components relevant for the calculation of the various balance sheet element rates are:
• Mortgage rate, rm
The mortgage rate is what the customer pays for the mortgage.
• 7 year interest rate swap rate, rs
A swap rate is the rate paid for the fixed leg of a swap. In a swap, the buyer pays a fixed interest rate in exchange for a benchmark rate such as Euribor or LIBOR plus or minus a spread. A swap is bought in order to protect oneself from interest rate risk and is often seen as the benchmark for the risk-free rate of funding. It can thus be seen as the “base” rate of funding and we will use it as such. The 7 year swap is chosen as this is the time period which fits the payoff profile of a standard 10-year fixed interest rate mortgage. A mortgage with a fixed interest rate of 5-10 years is the most common type of mortgage (NMA, 2010).
• Credit swap spread, rc
• 3 month Euribor,rE
Euribor is a commonly used reference rate for various financial products. It is this rate at which Eurozone banks are willing to make unsecured loans to other banks in the Eurozone.
• Deposit rate,rd
The rate which a bank pays to a customer for depositing money with the bank.
• Mortgage specific costs,c
The costs that a bank incurs when creating a mortgage, which include both various risk premiums such as credit risk, pipeline risk, and the pre-payment risk of a mortgage as well as the operational costs of the bank for creating the mortgage. Unfortunately, it is rather impossible to find the objective rate for these costs as they are mostly classified by banks or hard to determine. Experts from the NMa have set these costs at 0,8%. They are deemed to be stable over time. Whilst not included in the method of the report, we add to these costs an additional 0,2% as to reflect the costs incurred by a bank when dealing with the liquidity requirements for the various components on a balance sheet. Whilst normally this would be reflected on the balance sheet in the ’Reserves’ a bank must hold, we believe that the calculation procedure required for the determination of the height of these reserves is too complex and does not add value to this paper. This simpler approach has thus been chosen.
The rates of the components are shown in table 3.2. The rates (where applicable) were determined based on ABN AMRO as a reference bank. Rates were based on the values on January 10, 2019.
Table 3.2.: Interest rate components
Variable Rate
Mortgage rate, rm 2,26% (ABN AMRO, 2019a)
7 years swap rate, rs 0,43% (SEB,2019)
Credit swap spread, rc 0,45% (DDV, 2019)
3 month Euribor, rE -0,31% (GlobalRates,2019)
Deposit rate, rd 0,03% (ABN AMRO, 2019b)
3.4.2. Interest Rate Formulas
These components can now be used to determine the costs of the various elements of a balance sheet. This is first explained below and subsequently given in formulaic form.
• Deposits
For depositing their money at a bank consumers are paid an interest rate. This interest rate is a premium over Euribor as to incentivise consumers to deposit their money. Consumers are thus paid Euribor plus this premium.
The costs for this are calculated as follows. If a bank has to pay a consumer Euribor they will hedge this interest rate. This is done through buying a 7 year swap, the “base rate of funding”. Added to this swap rate is the height of the deposit premium paid to depositors. This is the deposit rate minus the 3 month Euribor rate.
• Debt
As with a deposit the base rate of funding is the 7 year swap rate. Added to this is the credit swap spread, which quantifies the risk that an institution runs by borrowing to the bank.
• Securities & Loans
These are treated as equal as the rates obtained will be the same whether the bank holds the original mortgages or the subsequent securitisations. The rate is depen-dent on the height of the mortgage rate paid by customers minus the operational costs of a bank.
• Equity & Reserves
The costs of equity are set to 0%. While a bank such as ABN AMRO has a target ROE of 10-13%, we omit this as we will be calculating the ROE ourselves (ABN AMRO,2018). A cost of equity that is not set to 0% would not fit into this method. As explained in Section 3.5.1, we will have no reserves, though these would also have a rate of 0%.
This results in the component rates as shown in Table 3.3.3
3We acknowledge that the deposit rate seems rather high compared to the debt. This is a correct
Table 3.3.: Interest rates for the elements of a balance sheet
Elements Formula Rate
Deposits rs + rd -rE 0,77%
Debt rs + rc 0,88%
Securities rm - c 1,26%
Loans rm - c 1,26%
Equity - 0,00%
Reserves - 0,00%
3.5. Securitisation Scenarios
Using what we have shown in the previous sections we can model a bank in different securitisation scenarios, portraying the effects though a balance sheet as well as an income statement.
This will be done through a “micro-scenario”: a bank will first be modelled with only one mortgage on its books. The bank will then seek to add a second mortgage through different funding methods. By scaling down to just one or two mortgages we seek to give the reader a clearer insight into the effects of securitisation.
In the followings sections these three scenarios will be modelled in detail using both a balance sheet and an income statement:
1. Single mortgage bank - Standard approach
2. Second debt-financed mortgage - Standard approach
3. Second full-security financed mortgage - Standard approach
Weights for the standard approach are used as given in Table 1.1. Before finally mod-elling these scenarios we will first discuss some restrictions on the model in the next section.
3.5.1. Scenario Restrictions
Some general restrictions apply to all scenarios:
• The asset “Reserves” is set to e0. Normally, there would be a reserve for day to day liquidity as well as expected shortfalls. For our purpose the costs of holding a reserve which provides the proper liquidity has been reflected through the increase mortgage specific costs as explained before.
• The deposits are constant and set to a starting figure of 64,3% of the total of deposits + debt in the single mortgage bank scenario namelye61,728. This figure was determined by finding the average ratio of deposits to total liabilities4 from the annual reports of the three major Dutch banks: ABN AMRO, ING and Rabobank (ABN AMRO, 2018; ING, 2018; Rabobank, 2018). This figure of e61,728 is maintained for the other scenarios. Whilst funding new mortgages with deposits might be a possibility on the long-term, this is not a short-term option and thus left out of the scope of this paper. This leads us to:
• Any funds required for new mortgages that is not provided through securities will be provided through borrowing. Solely debt-financing will be used.
As a result, we will see that for the micro-scenarios the ratio of deposits to debt will vary greatly. While this will look rather odd, this is intentional. One of the effects we will see is that the ROE of a bank slightly decreases if it uses relatively more debt funding. An intended consequence, as research shows that securitisation is often used if a bank faces liquidity constrains or costlier alternatives of funding (Almazan, Mart´ın-Oliver, & Saurina Salas, 2015). Some exploratory calculations have shown that the overall effect is rather minor and won’t affect the overall conclusions we will draw of the different securitisation methodologies. However, it will be noticeable and thus show the effects of a bank having limited funding options. If the rate gap between debt and deposits were much larger the effect might have been more pronounced and we would have to keep the ratio of debt to deposits the same.
4Instead of using the average ratio of deposits to total liabilities, consideration was made to use the
• Equity is set equal to the bare minimum required by regulations, even though normally a bank will hold more than the bare minimum. This is done in order to simplify the balance sheet and to show the changing effect on the required equity with as much sensitivity as possible.
3.5.2. Single Mortgage Bank
Shown in this section is the starting situation of the bank where the bank has just one mortgage on its books. The balance sheet and income statement are given in Tables3.4
and 3.5.
Table 3.4.: Balance sheet - single mortgage bank - SA
Assets Liabilities & Equity
Reserves e0 Deposits e61,728
Securities e0 Debt e34,272
Loans e100,000 Equity e4,000
TOTAL e100,000 TOTAL e100,000
Table 3.5.: Income statement - single mortgage bank - SA
Assets Rate Income Liabilities & Equity Rate Cost
Reserves 0,00% e0 Deposits 0,77% e475
Securities 1,26% e0 Debt 0,88% e302
Loans 1,26% e1,260 Equity 0,00% e0
TOTAL e1,260 TOTAL e777
ROE 12,1%
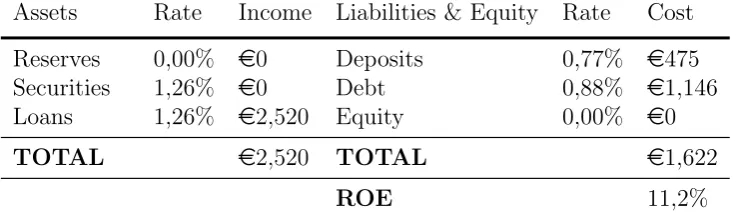
3.5.3. Second Debt-financed Mortgage
The second option we will look into is where the bank finances a second e100,000 mortgage using debt financing.
Table 3.6.: Balance sheet - second debt-financed mortgage - SA
Assets Liabilities & Equity
Reserves e0 Deposits e61,728
Securities e0 Debt e130,272
Loans e200,000 Equity e8,000
[image:45.595.88.455.272.380.2]TOTAL e200,000 TOTAL e200,000
Table 3.7.: Income statement - second debt-financed mortgage - SA
Assets Rate Income Liabilities & Equity Rate Cost
Reserves 0,00% e0 Deposits 0,77% e475
Securities 1,26% e0 Debt 0,88% e1,146
Loans 1,26% e2,520 Equity 0,00% e0
TOTAL e2,520 TOTAL e1,622
ROE 11,2%
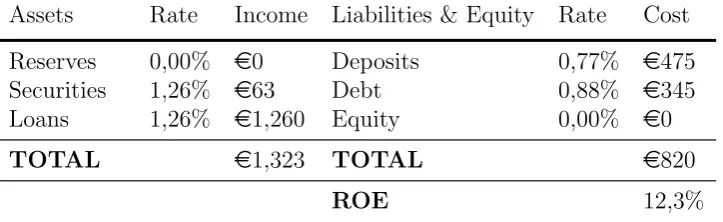
3.5.4. Second Full-security Financed Mortgage
We will now look to finance the second mortgage not solely through borrowing but through standard securitisation. The first mortgage here is securitised and 5% of the security is retained on the balance sheet.
This is shown in Tables 3.8 and 3.9.
Table 3.8.: Balance sheet - second full-security financed mortgage - SA
Assets Liabilities & Equity
Reserves e0 Deposits e61,728
Securities e5,000 Debt e39,192
Loans e100,000 Equity e4,080
Table 3.9.: Income statement - second full-security financed mortgage - SA
Assets Rate Income Liabilities & Equity Rate Cost
Reserves 0,00% e0 Deposits 0,77% e475
Securities 1,26% e63 Debt 0,88% e345
Loans 1,26% e1,260 Equity 0,00% e0
TOTAL e1,323 TOTAL e820
ROE 12,3%
3.6. ROE Comparison
[image:46.595.142.504.109.220.2]Summarised in Table3.10 are the ROEs for the different scenarios.
Table 3.10.: ROE summary - SA
Scenario ROE
Single mortgage 12,1%
Second debt-financed mortgage 11,2%
Second full-security financed mortgage 12,3%
The table shows a decrease in the ROE when adding a second debt-financed mortgage, which is due to the higher cost of funding as the bank turns to debt.
We see that financing it with a second full-security financed mortgage marginally in-creases the ROE as compared to a single mortgage, benefiting from the slightly lower RW of a security on the balance sheet as opposed to a mortgage.
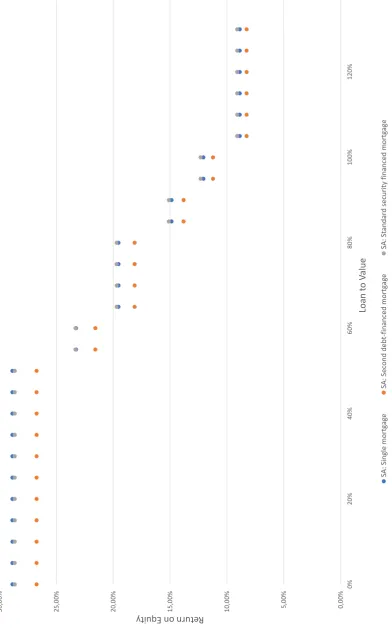
3.7. LTV Variation
A mortgage with a LTV of 100% is of course not the only mortgage that a bank has. For clarity we have used this when we looked at the three scenarios in depth, but we must also have a look at the effect of using different LTVs in these scenarios.
The ROEs of the different securitisation scenarios for different LTVs are modeled in Graph 3.1. The results for other LTVs are similar to that of a 100% LTV though there are a few noteworthy effects.
• The ROE decreases as the LTV increases. This is of course a reflection of the increased risk weight and thus the larger equity.
• The differences between a single mortgage and a second debt-funded mortgage become more pronounced at lower LTVs. This is due to the lower RW which makes any income differences more pronounced in the ROE.
3.8. Sensitivity Analysis
In order to increase the reliability of our results we have performed a sensitivity analysis on the interest rate of the mortgage and the interest rate of the funding. Risk weights and LTV were kept constant and as used in Section 3.5. The same scenarios modelled in that section were modelled here. The graphs (D.1 and D.2) can be found in the appendix.
Mortgage rate
When we vary the mortgage rate there are no interesting changes in the ROE. The differences between the ROEs of the different scenarios becomes fractionally more pro-nounced as the interest rate increases. At low interest rates (below the funding rate) the ROE turns negative.
Funding rate
Mortgage Splitting and its Financial
Benefits
4
In this chapter we will continue answering the second research subquestion:
What effect do different new securitisation methodologies have on the return on equity of a bank looking to fund additional mortgages?
In the last chapter we laid out the foundations for answering this question. We intro-duced the various elements of a balance sheet and their interest rates and analysed the ROE of a bank employing the standard securitisation methodology. Now, using this model and the ROEs we obtained, we will analyse the benefits of a novel securitisation methodology called ’mortgage splitting’.
We will do so by in the first section introducing the Loan-Splitting Approach, a new method for calculating risk weights as introduced by Basel IV. This is then directly followed by the introduction of the mortgage splitting methodology.
In the second section we will discuss collateral in the case of mortgage splitting, an important concept for mortgage backed securities.
In the sections that follow different mortgage scenarios relating to mortgage splitting and the LSA will be modelled.
4.1. The Loan-Splitting Approach
In the LSA a risk weight of 20% is applied to the part of the exposure up to 55% of the property value, while to the rest of the exposure a risk weight of 75% is applied (Committee on Banking Supervision, 2017).
It is unclear as to what Basel’s intentions are with this approach and why it was intro-duced. However, for most LTVs we find that the overall risk weight is decreased using this approach. This is for example the case for a mortgage with a 100% LTV, whose Risk weight is now 44,75% as shown by Formula4.1. This as opposed to 50% under the SA. We will further analyse these effects on a larger scale in subsequent chapters.
RW 100% LTV asset = 55%·20% + 45%·75% = 44,75% (4.1)
In Figure4.1a range of different LTVs ranging from 0,5% to 117,5% have been displayed accompanied by their risk weight as given by the SA and the LSA. We see that for most values the LSA has a lower weighted Risk Weight, except for a LTV between 67% and 80% and a small blip at around 90%. Overall, the LSA would thus be preferred by banks. It makes its introduction a rather odd one.
Figure 4.1.: RW for different LTVs using the Standardised and Loan-Splitting Approach
0% 10% 20% 30% 40% 50% 60% 70% 80%
0,
5%
5,
0%
9,
5%
14,0% 18,5% 23,
0%
27,
5%
32,0% 36,5% 41,
0%
45,5% 50,0% 54,
5%
59,
0%
63,5% 68,0% 72,
5%
77,0% 81,5% 86,
0%
90,
5%
95,0% 99,5% 104,
0%
108,5% 113,0% 117,
5%
Ris
k
w
eigh
t
Loan to Value ratio
A possible theory we would like to offer as to the introduction of the LSA is that perhaps the intention of Basel is to provide an incentive to banks to securitise only the top part of the mortgage. Depending on how the collateral would be divided up this could greatly reduce the risk for the bank now holding solely the “bottom part” of the exposure. The removal of the section weighed at 75% would greatly reduce a bank’s capital requirements and possibly improve a bank’s return on equity. We dub the splitting of a mortgage into multiple parts “mortgage splitting”. This is illustrated in Figure 4.2 for a 100% LTV mortgage.
Figure 4.2.: Mortgage Splitting
55%
45%
RW = 75%RW = 20%
For clarity, we give two definitions:
Loan-Splitting Approach: The approach described by the Basel Committee which pertains to the method in which the bottom part and top part of a loan are weighed 20% and 75% respectively.
Mortgage Splitting: A new securitisation methodology which splits a mortgage into multiple parts.