1
Explaining local citizen participation:
Interest, internet use, resources and urbanization as explaining
variables
Babette Aubri
S1741802
Supervisor 1: Pieter-Jan Klok
Supervisor 2: Shawn Donnelly
Date: 01-07-2019
Version: 1
2
Abstract
In this paper, the topic ‘’citizen participation’’ is studied. In this paper two types of citizen
participation are distinguished namely local political participation and local civic
participation. Local political participation relates to local voting behavior for instance, while
local civic participation relates to a citizen initiative for instance.
In this paper, several factors are tested on whether they have a relationship with citizen
participation or not. Therefore, the research question that is posed in this paper is: ‘’which
factors influence local political participation and local civic participation and what are the
differences between the two types of participation?’’
There are four influencing factors that are tested in this case. The first influencing factor
relates to the interest that people have in for instance local politics, local news and local
discussions. The second influencing factor is about the education and income people have, in
other words the resources. The third influencing factor is about to what extent people use the
internet in order to communicate with others about local issues. The final influencing factor
relates to the environment people live in, this can be rural or urban. In other words, it
describes the relation between the level of urbanization and local citizen participation.
In this paper it is expected that these four influencing factors both have an effect on local
political participation and on local civic participation.
This paper uses a large data set from 2018 that is about local engagements in the Netherlands.
The research design in this study is a cross-sectional research design. This paper seeks to
explain more about local engagements in The Netherlands and is therefore especially relevant
for (Dutch) policy-makers.
Keywords: Local citizen participation, local political participation, local civic participation,
3
Table of Contents
1.0 Introduction ... 4
1.1 Research question ... 6
2.0 Theory section ... 7
3.0 Methods ... 14
3.1 Research design ... 14
3.2 Case selection ... 15
3.3 Operationalization & data methods ... 16
3.4 data analysis ... 23
4.0 Analysis ... 27
4.1 Descriptive analysis ... 27
4.2 explanatory analysis ... 35
5.0 Conclusion ... 42
4
1.0
Introduction
In this chapter the current dialogue of the topic ‘’local citizen participation’’ is studied. Since
the topic of local citizen participation is studied, it is very important to first define that
concept. Local citizen participation can be defined into two different concepts namely, local
civic participation and local political participation. Bakker, Denters et al. (2012) explain a lot
on what local civic participation means. The clearest distinction between the two concepts is
that local political participation is related to the decision-making process and thus relates to
the political sphere while local civic participation is not. In the article, it is mentioned that
citizen initiatives are seen as a form of civic participation in which citizens themselves lead
the action instead of the government. This is often the case when citizens want to improve
their neighborhood or strengthen the social cohesion in their neighborhood. Thus, it could be
argued that local civic participation takes place when people themselves try to enhance their
own neighborhoods.
Local political participation on the other hand has another meaning. The term local political
participation can be explained in many different ways. Conge (1988) mentions that political
participation has different features. The features they mention are for instance that it can be
individual or collective, national or local, against current structures of authorities or in favor
of current structures of authorities. Besides this, the author emphasizes that political
participation can be expressed in a verbal and/or a non-verbal way, it can be illegal and
unconventional but it can also be nonviolent and finally the intensity can also differ.
Lowndes, Pratchett et al. (2006) explain under which circumstances political participation
takes place. The authors argue that the internal political efficacy and the external efficacy
matter regarding local political participation. In others words, citizens must have the feeling
that they can make a difference and that the government is responsive to their concerns.
Moreover, this paper tries to seek several factors that influence local citizen participation. In
some articles it is argued that in some cases, people’s interest in local issues is an important
factor whether someone is willing to participate or not. In the article by Davidson and Cotte
(1989) this concept is translated into ‘’the sense of community’’ in which it is explained that
people must somehow care for their community in order to be willing to do something for
their community and participate. Other factors that are extensively discussed in many articles
are: money, education and skills, in other words, the resources someone has. In the article by
5
participation. However, another very important factor nowadays is ‘’the internet’’. The
internet is used a lot and is perhaps also an important factor regarding local citizen
participation. In many articles it is discussed that the internet has an effect on citizen
participation. In for example the article by Tolbert and McNeal (2003), it is explained that the
internet is a vital element in explaining citizen participation. Finally, the last factor that is
discussed is the level of urbanization. James (2001) argued that people who live in rural
places, have less education compared to people who live in urban areas, thus, they have less
resources. However, it could be argued that people who live in rural areas have more ‘’sense
of community’’ compared to people who live in urban areas.
In short, many studies on local citizen participation have already been done. However,
there are still some elements that are missing and this will lead us to the next part of this
introduction in which the relevance of this research is being explained. In this study, the focus
will be specifically on the inhabitants of The Netherlands. In most research on local citizen
participation, a broader approach is taken. The study by Michels and De Graaf (2010) also
studied local citizen participation as a topic and already takes Dutch municipalities as a case
but only limits itself to Groningen and Eindhoven and does not make any general statements
about Dutch citizens.
Another element that is missing in the current literature is that the aspect of citizen
participation is often not separated into civic participation and political participation and then
being compared. Often, the term ‘’local citizen participation’’ is used. In this study, the
separation is already made clear from the beginning because they are seen as two different
concepts.
This makes, that this study is filling a scientific gap by 1) explaining more on Dutch citizens
in specific and 2) separating civic and political participation from each other and see if there
6
1.1
Research question
In 2018 a large survey has been held to gather information about local engagements in The
Netherlands. In this paper, a certain topic of this survey is being studied. The research
question that is being studied is: ‘’which factors influence local political participation and
local civic participation and what are the differences between the two types of
participation?’’
The sub questions that derive from this research questions are:
• To what extent are Dutch citizens politically active and civically active?
• To what extent are the factors: interest, resources, internet use and urbanization different
compared to each other?
• To what extent are the influencing factors different regarding local political and local civic
participation?
As already mentioned, it is very important to be clear about the differences regarding local
political participation and local civic participation. It should be mentioned that in this study,
different factors that might influence local citizen participation are measured both for local
political participation and for local civic participation. Then, the relations are tested,
somewhat compared and a conclusion can be made on which relation is significant and which
relation is not significant. Perhaps it might be possible to mention which relation is stronger.
Note that in this study, when ‘’local citizen participation‘’ is mentioned, it both includes local
civic participation and local political participation. In answering the research question a
contribution is made to the knowledge especially relevant for (Dutch) local policy-makers.
In this chapter the topic of this study was introduced. Besides this, in this chapter it was also
mentioned why this study is relevant and why it is fulfilling a scientific gap. In addition, in
this chapter the research question and the sub questions are set out. In chapter two, the
theoretical framework is set out and the expectations derived from the current theories are
mentioned. Besides this, chapter two also consists of the conceptualization of the key words.
In chapter three it is explained how the variables are constructed and how the data is analyzed.
To continue, chapter four consists of a descriptive analysis in which the descriptive data is
showed and an explanatory analysis in which the research question is answered. Finally,
7
2.0
Theory section
In this section, the existing theories about local citizen participation will be set out. First, the
main concepts used in the research question will be conceptualized. In the second part, the
existing literature will be used to set a theoretical framework. This theoretical framework is
necessary to set expectations.
There are several concepts that might need some explanation in order to understand them
better. The main concepts in the research question are: local political participation, local civic
participation. According to Lowndes, Pratchett et al. (2006), the concept local political
participation relates to facets such as voting in local elections, working on campaigns, getting
formal and informal engaged in local issues and attending protests. However, Conge (1988)
takes a broader perspective on what political participation entails. The author explains that
there are six issues in the discussion of the conceptualization of political participation. The
first issue is about the idea that political participation can be active or passive. With this, it
goes against the conceptualization made by Lowndes, Pratchett et al. (2006) because they
only highlight the active forms of political participation. Conge (1988) questions whether
awareness and feelings about politics also must be seen as a form of political participation.
Moreover, the second issue is that political participation can be violent and non-violent. With
this, it is meant that political participation can be expressed in a protest for instance as
mentioned in the article by Lowndes, Pratchett et al. (2006) but it can also be expressed in a
less conventional way such as in strikes for instance. The third issue mentioned in the article
is that political participation can be seen in forms where citizen try to maintain how the state
operates, or where citizens try to change how the state operates. The next issue in the
conceptualization is that political participation should not only be called political participation
when it is directed to the government but also when it is not directed directly to the
government, but more to the area where the government operates in. The fifth issue is whether
political participation should be called political participation when the action is sponsored and
mobilized by the government, or when citizens themselves should guide the action. The final
issue mentioned in the article is about the distinction between intended and unintended
actions. With that, it questions whether it should be called political participation when there is
an unintended action with an unintended outcome. Thus, the author of the article mentions
that the conceptualization of political participation is very comprehensive and it is therefore
8
The database by LKO2018 has several items that relate to some of these conceptualizations.
The items about ‘’local political participation’’ in de database mainly overlap with the
conceptualization made by Lowndes, Pratchett et al. (2006) which means that items that relate
to voting behavior and local political involvement are selected in this study.
The fifth issue mentioned in the article is important to keep in mind since it is about the
distinction between local political participation and local civic participation. This is the case
because Bakker, Denters et al. (2012) argue that this issue in specific, is important in defining
the two types of citizen participation. Bakker, Denters et al. (2012) argue that local civic
participation does not relate to the decision-making process and thus, is not guided or
mobilized by the government or any other authorities. It is mobilized and guided by the
people themselves. This can be an important feature for the outcome because when actions are
guided by the citizens themselves, they are often guided in the interest of the people.
Contrary, when actions are guided by the government, they are often guided in the interest of
the government (Conge 1988). Furthermore, Bakker, Denters et al. (2012) elaborate on the
conceptualization of local civic participation by mentioning that citizen initiatives are a facet
of local civic participation. However, critics argue that citizen initiatives are seen as a hybrid
form rather than a pure form of citizen activism. In the article it is also mentioned that citizen
initiatives are only involved with collaboration with local authorities when professionals take
over the initiative but this does not necessarily have to be the case. Usually, citizen initiatives
are seen as a collective action that stimulates self-governance. Bakker, Denters et al. (2012)
name several features of community initiatives, which could be seen as local civic
participation. The features mentioned in the article are for instance that citizen initiatives
usually are collective, self-organized and is independent from government or other
organizations. The LKO2018 database has one item that clearly fits this conceptualization
made by Bakker, Denters et al. (2012) which is about participation in citizen’s initiative.
Now that the conceptualization of the main concepts is made clear, the next part of the theory
section is about the factors that lead to local citizen participation. In the article by Bakker,
Denters et al. (2012) it is mentioned that citizen initiatives require a certain amount of interest
from the citizens. In other words, in order to have civic participation, a certain amount of interest
is required. In this article, a conceptualization of the concept ‘’ interest’’ is made. A distinction
is made between the interest in the process or in the results. Thus, in defining the concept, a
9
Bakker, Denters et al. (2012) argue that one of the features of citizen’s initiatives is, that it is a
collective action. Since this article defines ‘’interest’’ as an interest in the result rather than an
interest in the process, it might not be useful for determining the theoretical framework since
the ‘’interest’’ items in this study, relate to an interest in the process instead of an interest in the
result. Since there are many ways in which ‘’interest’’ can be defined according to the current
literature, the conceptualization must be made clear. As already mentioned, the items in the
LKO2018 database are more related to the interest and involvement in the process instead of
the results. This is the case because the items are for instance about involvement and discussions
about local concerns. However, this article by Bakker, Denters et al. (2012) might still be useful
to mention in order to indicate that there is a clear difference in the meaning of the concept
‘’interest’’.
Furthermore, Davidson and Cotte (1989) mention the term ‘’sense of community’’ a lot. The
study showed that the relation between sense of community and political participation is
significant. In this study, facets that fall under the concept of political participation are for
instance voting behavior, working on local issues and contacting officials. The sense of
community can somehow also count for the ‘’interest’’ factor because as the authors explain,
the sense of community consists of four different elements namely: feelings of membership,
feelings of influence, feelings of shared needs and feelings of a shared emotional connection. It
can be argued that when citizens have a feeling of shared needs and a shared emotional
connection, they care more for their community and thus have more interest in local
engagements. This article strongly emphasizes first of all the feeling of togetherness, in other
words, the collective interest. Besides this, the article also emphasizes the feeling of influence,
and with that, emphasizes interest in the process more than the interest in the results.
The authors thus argue that there is a significant relation between the sense of community and
political participation. However, it can also be argued that the sense of community might be
relevant in relation with local civic participation. This is the case because Bakker, Denters et
al. (2012) mention that local civic participation often relates to citizens enhancing their own
neighborhoods by for instance strengthen the social cohesion among neighbors. This argument
is in line with ‘’feelings of shared needs and feelings of an emotional connection’’ (Davidson
and Cotte 1989). Thus, the theoretical framework already assumes that there is a relationship
10
of ‘’interest’’ is studied for local civic participation and for local political participation. Then,
it is studied which relation is significant and which relation is perhaps stronger than the other if
there are any clear differences regarding the strengths of the relations.
Furthermore, Denters and governance (2016) argue that the term resources is a key element in
explaining local civic participation. In the article it is stated that in the Civic Voluntarism
Model, the question whether or not a person will become actively involved in a particular civic
activity is dependent on three key factors: motivations, resources and mobilization. However,
Fledderus and Honingh (2016) argue that resources is not a vital element in explaining non-
participation. Moreover, in the article by Lowndes, Pratchett et al. (2006) the authors set out
three main elements that explain why people politically participate on a local level. One of
these three elements refer to ‘’resources’’. On this concept a theoretical framework is set out.
Theorists argue that one of the most determining factors in explaining why people participate
is ‘’resources’’. The term resources in this case refers to money, education and civic skills.
With the socio-economic status model (SES) it can be explained that citizens with a higher
economic status, are more likely to involve themselves in local politics. This argument is also
in line with what the study by Wilkes (2004) showed. In this study, they have found that a
higher level of education and better language skills have positive relation on the participation
level in collective action. In this article, collective action is related to political participation
and not to civic participation. It is however questionable if collective action is also or maybe
even a more related concept to the term civic participation.
Thus, the concept ‘’resources’’ reflects money, skills and education. Lowndes, Pratchett et al.
(2006) argue that for local political participation, money is a very important factor. However,
in this study, the term ‘’local political participation’’ refers to voting behavior and the
involvement into local political activities. One could argue that for voting behavior, the
resource ‘’money’’ might not be an explaining factor. Contrary, the item that is related to local political activities might be more related to the resource ‘’money’’ because this item for
instance poses the question whether someone is active in a protest group. Wilkes (2004)
however, shows that language skills and the level of education are more important in relation
to local political participation. This might be more relevant when explaining local political
participation in terms of voting behavior and local political activities. This is the case because
one could argue that if someone is involved in a public hearing in the municipality, which is
11
money.
Denters and governance (2016) argue that ‘’resources’’ are vital with regard to civic
participation. It must however be made clear which type of ‘’resources’’ the author refers to.
In this article the author refers to time, human capital and financial capital to explain the
concept ‘’resources’’. In addition, Bakker, Denters et al. (2012) explain that local civic
participation relates to citizens improving their neighborhoods and strengthening the social
cohesion among neighbors. As the authors of the article also explain, the type of resources
necessary, differ among different types of local civic participation. When citizens for instance
want to organize a barbecue to strengthen the social cohesion, human capital might not be
such an important factor while time and financial capital are. The concept of local civic
participation is translated into the item that refers to the involvement in citizens’ initiatives. In
the article by Bakker, Denters et al. (2012) it is explained that time and skills are one of the
most important resources with regard to citizens initiatives. This is the case because studies
show that many citizens’ initiatives never take place because of a lack of time. Besides this,
skills are extremely important because when setting up a citizens initiative, one needs
operational, verbal and social skills in order to make the initiative work (Bakker, Denters et
al. 2012).
Thus, there is a bit of inconsistency regarding the term ‘’resources’’ in local civic
participation, while Lowndes, Pratchett et al. (2006) and Wilkes (2004) are both very strict
about the effect of ‘’resources’’ in local political participation. Besides this, the items that are
selected to measure ‘’resources’’ are related to money and education. Bakker, Denters et al.
(2012) emphasize the importance of skills and education but do not neglect the importance of
money with regard to civic participation. Contrary, as argued before, for local voting behavior
and being able to present yourself in a public hearing, money might not be such an important
factor while education is. Thus, when taking the current literature into account it does not
become very clear whether the term ‘’resources’’ is more relevant in explaining local political
participation or in local civic participation. For that reason it is decided that the aspect
‘’resources’’ is studied for both civic participation and political participation. Then, both
relations will be described on whether they are significant or not and if there are perhaps any
12
Moreover, when describing the ‘’factors influencing local citizen participation’’ in the 21st
century, one element that should not be neglected is the internet. In many studies it has
been found that the internet has an influence on the levels of participation. The article by
Tolbert and McNeal (2003) is specifically related to political participation. The authors of
the article show that because of the internet, people are more informed about politics, and
this has an influence on electoral behavior. The authors of the article mention that due to
the internet, people are more likely to vote and thus internet has a positive influence on
political participation. However, the authors also argue that on the long-term, the internet
could have a negative impact on political participation. This is the case because of unequal
access to the internet.
Furthermore, another article in the current literature about internet use and citizen
participation is the article by Shah, Cho et al. (2005). This article models the effect of
internet on civic participation. The argument made by the authors is in line with what
Tolbert and McNeal (2003) argue, namely, that the internet provides citizens with more
information about politics. In this way, more political discussions occur on the internet and
people can communicate more with each other about civic problems. Thus, political
discussions and civic communications are seen as facets of civic participation. The authors
of the article conclude that in this way, the internet has a positive influence on civic
participation. The items selected that relate to the internet factor are especially related to
making contact with local authorities or with neighbors while using the internet. This
means that the political information might not be as important as the communication
element in this case.
Thus, both of the authors of the two different articles mention that the internet has a
positive influence on civic participation and political participation. However, both authors
also really emphasize the importance of the internet on political information and with that,
emphasize the relation between the internet and political participation. Since the level of
providing political information is not measured in this study, but only the communication
between citizens and between citizens and local officials is measured, it might also be the
case that a relation between internet use and local civic participation is found. Thus, to be
clear, the internet factor is tested both for political and civic participation. Then, both
relations are checked on whether they are significant or not, and perhaps if there any clear
13
Finally, Kakumba (2010) mentions that they find a higher response rate in their surveys
regarding local engagements in rural areas then in urban areas. This means that the
geographical place people live in could also be a factor in explain local citizen participation
Besides this, it can also be argued that the ‘’sense of community’’, as mentioned in the
article by Davidson and Cotte (1989), is higher in rural areas because often in these places
people know each other personally and thus feel more connected compared to people who
live in urban areas. Thus, it could be argued that collective action is more likely to occur in
rural areas than in urban areas because people have more sense of community. As argued
before, the sense of community might be important in the explanation of whether people
participate or not because when citizens for instance want to enhance their neighborhood
without involving any local officials, they have to arrange something themselves, and for
that, a certain level of social cohesion is necessary. Following this argumentation, it could
be argued that there might be a relation between local civic participation and the level of
urbanization. However, in this study it is also checked whether there is a relation between
the level of urbanization and local political participation. For that reason, the factor ‘’level
of urbanization’’ is measured both in relation with local civic and local political
participation. When looking at the results, it is checked whether the relations are significant
or not and if there are perhaps any clear differences regarding the strengths of the relations.
Thus, in this chapter the conceptualization of the key words is made clear. Besides this, the
current literature about the topic ‘’citizen participation’’ is set out in order to set out a
theoretical framework. This theoretical framework results into setting different
14
3.0
Methods
3.1 Research design
The type of research in this study is a hypothesis testing type of research. However, the
expectations are formulated openly and this makes it that the study is more explorative. That
is the reason why the term ‘’hypothesis’’ is replaced with ‘’expectations’’. This means that
there are several assumptions and expectations derived from observations and knowledge.
These assumptions and expectations are translated into a set of expectations and afterwards it
is tested whether these expectations derived from the theories are in line with the theoretical
framework or not.
To be more specific, the research design in this study is related to a cross-sectional research
design. This means that there are a set of units and there are variables measured that one
moment in time.
In this specific case the units are Dutch citizens and the variables are ‘’factors influencing
local political participation’’, ‘’factors influencing local civic participation’’ and the ‘’level of
participation’’. When performing a cross-sectional research design there are several
limitations, namely, only the association can be tested. This is the case because only the effect
at one time only can be measured. Sometimes by logically thinking, a prediction can be made
on whether x precedes y but this is certainly one of the limitations when performing a
cross-sectional research design. Another limitation this type of research design is that the
non-spuriousness can also not be fully tested for. This is the case because for this, the effect with
the possible third variable needs to be measured and the effect without the possible third
variable needs to be measured in order the state a conclusion. However, the existing theory
and considering alternative explanations can help in order to give answers referring to
causality. This is done in the form of control variables. When the control variables are taken
into account in doing a regression analysis, the possible effect of a third variable is controlled
for. Thus, there are several limitations to this type of research design. However, these
limitations can be reduced by using control variables. The only thing that matters is that I
have to be very careful when making causal statements while doing cross-sectional research.
However, cross-sectional research is very suitable when you have a database with many cases.
In this study, the database that is used has more than 1000 cases so therefore, it can be
15
3.2 Case selection
In this study, several citizens of different Dutch cities are asked to give their opinion about local
engagements. The survey items derive from ‘’lokaal kiezersonderzoek 2018’’ (LKO2018)
(Denters & Jansen, 2018). The LKO2018 has derived its data collection method from LKO2016
in which a nationwide sampling method is used. So this is also the case in the LKO2018. This
is done with the aspect of efficiency in mind.
The LKO2018 uses an internet panel derived from CentERdata. The internet panel consists of
approximately 5000 households with different backgrounds. What is important to mention is
that the households that participate in the panel are selected by CentERdata & CBS. This, means
that participants cannot sign up themselves. This is also an important condition to maintain
diversity within the panel because in this case, there are no obstacles in participating in the
panel. In addition, the response rate, which is 80% is relatively high. However, it can be
questioned whether it is a representative sample even though there is a high response rate.
This is the case because not everyone that is invited actually participates. So even though the
people that are invited to participate are a representative sample, it does not necessarily have
to be the case that the response is also representative. However, CentERdata and CBS select
new participants when people that are invited do not participate. Thus, by monitoring whether
the data given from the panel is in line with the data that the population gives, CentERdata
checks for the representativeness of the sample. Besides this, another important element that
needs to be discussed is the validity. The internal validity relates to the time-order and
non-spuriousness. As already mentioned, we can only test the association so the internal validity
can partially be guaranteed. Moreover, the external validity is refers to whether the
conclusions that are drawn in this study can be generally stated. This is certainly the case
because the sample is representative for all Dutch citizens so they are a good representation of
the whole population.
To conclude, the people participating in the panel are a good representation of the Dutch society
and the outcomes that derive from the internet panel can be more generally stated and in this
dataset, it is explicitly mentioned that every data that is collected is strictly anonymized and
16
3.3 Operationalization & data methods
As already mentioned in the previous section, in this study I will not collect the data myself
but I use a database from LKO2018. In this part I will justify more why that database is
suitable in my research by selecting several items from the LKO2018 to measure my
variables. The survey items that are used in my research are found in table 1 and table 2.
The exact meaning of the items can be found in the appendix in table 1 and table 2. In this
section, first the theoretical part of the operationalization is set out and then the
operationalization continues with how the variables are measured.
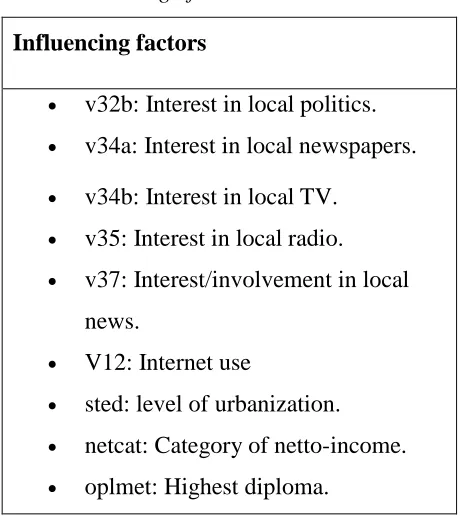
Table 1: meaning of the items
Influencing factors
• v32b: Interest in local politics.
• v34a: Interest in local newspapers.
• v34b: Interest in local TV.
• v35: Interest in local radio.
• v37: Interest/involvement in local
news.
• V12: Internet use
• sted: level of urbanization.
• netcat: Category of netto-income.
[image:16.596.76.306.278.536.2]• oplmet: Highest diploma.
Table 2: meaning of the items
Local political participation: Local civic participation:
• v1: Did you vote.
• v11: Local political involvement.
• v13_1: participation in
17 The independent variables: ‘’influencing factors’’
The factors influencing local political participation and the factors influencing civic
participation are the same (table 1). This is the case because they are tested for both political
participation and civic participation. Then, the results will show for which type of
participation the influencing factors are significant and perhaps are which relation are most
strong. However, this can only be stated if there are any clear differences.
Interest
The factors influencing local political participation relate to items that have been mentioned
as a possible influencing factor in the current literature. The first variable that is discussed is
the variable ‘’interest’’. As already mentioned in the theory section, this variable is related
to personal interest and interest in the process instead of the results. Davidson and Cotte
(1989) mention that the interest aspect often relates to people who have shared needs and an
emotional connection, thus, this fits with the interest in the involvement in the process
instead of the direct results. However, Davidson and Cotte (1989) emphasize the collective
interest instead of the individual interest. The LKO2018 does not have much data about the
collective interest so for that reason, in this study, the items that relate to the individual
interest are selected. For that reason, the items selected are about the interest in local politics,
local issues, local TV, local radio and the local news.
The ‘’interest’’ aspect is measured by the following items: v32b, v34a, v34b, v35 & v37.
V32b is about the interest in local politics. The answering categories range from 1-3 in which
1 means ‘’ not interested’’ and 3 means ‘’very interested’’. Since the interest variable consist
of 5 different items, an index must be made. V32b consist of 3 answering categories while the
other variables consist of 5 answering categories. For that reason, v32b is recoded and instead
of three answering categories, it now has five answering categories in order to even all the
items in weight. In addition, the variable is computed as an ordinal measure. V34a refers to
the question whether someone reads the local newspaper. The answering categories range
from 1-5 in which 1 means ‘’never’’ and 5 means ‘’almost always’’. The item is computed as
an ordinal variable. Moreover, the item 34b refers to the question whether someone watches
local television. Since it is part of the same question as the previous one, it also has a five
point Likert-scale and has an ordinal measure. Furthermore, the item v35 is about the whether
someone listens to the local radio in which again, the same 5 point Likert-scale is used and the
18
discussions about local news. The item has an answering category which ranges from 1-5 in
which 1 means ‘’I often participate in these discussions’’ and 5 means ‘’ this never happens’’.
The item is computed as an ordinal variable. Since the answering categories related to item
v37 are reversed compared to the other answering categories from other items, v37 is recoded
into v37_N in which 1 means ‘’this never happens’’ and 5 means ‘’I often participate in these discussions.’’
In addition, the ‘’interest’’ scale consist of five items. However, one of the items, item 34a,
has many missing cases namely 815. For that reason, this scale is constructed via a MEAN.4
option which means that for the missing cases in one item, the average of the other four items
is computed.
Internet
The next variable that is discussed is the variable ‘’internet use’’. Many articles mention the
importance of the internet on citizen participation. The authors of the article by Shah, Cho et
al. (2005) and the authors of the article by Tolbert and McNeal (2003) both argue that the
internet is an important influencing factor in citizen participation because it the internet
provides citizens with more information about politics for instance. In this way, the internet
could influence voting behavior of people. Besides this, another reason why the internet might
be important in explaining the relation with citizen participation, is because due to the
internet, people communicate more. The item v12 covers this aspect since it consist 5 sub
questions v12_1 until v12_5 in which it is asked of someone used the internet to contact the
mayor, civil servants, other inhabitants and organizations about local issues during the last
five years. Besides this, it also questioned if someone used the internet to sign an initiative or
a petition (v12_4). V12_5 means ‘’none of the above’’. V12 has two answering categories in which 0 means ‘’no’’ and 1 means ‘’yes’’.
Resources
Another variable that is discussed is the variable ‘’resources’’. In the article by Lowndes,
Pratchett et al. (2006) the concept ‘’resources’’ refers to money, education and skills. The
LKO2018 database has two items that overlap with this conceptualization made by Lowndes,
Pratchett et al. (2006) namely money and education.
For that reason, the two items selected out of the LKO2018 database are ‘’category of
netto-income’’ and ‘’highest diploma’’. These two variables are seen as background variables. The
19
as ‘’missing’’. The others options are the categories defined by the income in which 0 is the
lowest category and 12 is the highest category. This item is measured by an ordinal variable.
The item referring to ‘’highest diploma’’ ranges from 1-9 in which 1 is the lowest diploma possible and 6 is the highest diploma possible. The option 7 means ‘’other’’, the option 8 means ‘’not (yet) completed any education’’ and the option 9 means ‘’having no education at all’’’. There are no missing variables labelled and the item is computed as an ordinal variable.
Thus, the variable consists of two different items. However, it may also be possible that in this
case, income for instance, has a stronger relation with the dependent variable than education.
For that reason, they are also tested separately from each other.
Level of urbanization
The final influencing factor is ‘’level of urbanization’’. Several authors such as (Kakumba
2010) and (Davidson and Cotte 1989) may predict that this also has an influence on citizen
participation so that is why this item is also selected. The ‘’level of urbanization’’ is also a
background variable. The answer categories are based on a 5point Likert-scale in which 1
means ‘’very urban’’ and 5 means ‘’not urban’’. In addition, the item is computed as an
ordinal variable. Furthermore, this item is recoded in which 1 means ‘’not urban’’ and 5
means ‘’very urban’’ in order to put all the items into the same direction.
The dependent variables: ‘’local political participation’’ & ‘’local civic participation’’
Local political participation
The first dependent variable that is discussed is ‘’local political participation’’. As explained
in the theory section, the conceptualization of ‘’local political participation’’ is very broad.
The conceptualization made by Conge (1988) is very comprehensive. The conceptualization
made by Lowndes, Pratchett et al. (2006) is only one part of the conceptualization made by
Conge (1988) and it relates to for instance attending protests or whether someone votes or
not. Since I do not collect the data myself, I must fit my conceptualization of the concept
with the data I have. In the database there are many items about whether someone votes or
is politically active. Since those conceptualization fits with the conceptualization made by
Lowndes, Pratchett et al. (2006), these items will fit the conceptualization and I have decided
to select those items.
The items selected for measuring local political participation (table 2) cover questions on
whether someone has voted in the municipal elections or whether someone has been locally
20
relate to the decision-making process in the political sphere. Thus, local political
participation is measured by the following items: v1 & v11. The item v1 questions whether
someone has voted or not during the last municipal elections. V1 has five answering
categories ranging from 1-3 and -8 & -9 the negative numbers are labelled as ‘’missing’’.
Moreover, v1 is computed as a nominal variable. Besides this, in order to make v1
comparable with v11, a recode was necessary. A new variable v1_N2 is computed in which
0 means ‘’no’’ and 1 means ‘’yes’’, the third option which means ‘’was not permitted to vote’’ is now labelled under the option ‘’missing’’.
The item v11 questions whether someone has been politically active in a certain way during
the last five years. This item has 9 sub questions ranging from v11_1 until v11_9. The
answering categories range from 0-1 in which 0 means ‘’no’’ and 1 means ‘’yes’’. Besides
this. V11 is computed as a binary measure.
Local civic participation
With local civic participation, the idea of self-organization and not involving any local
authorities is more present as explained in the theory section in the article by Bakker, Denters
et al. (2012). The item selected for measuring local civic participation (table 2) covers the
question whether someone has participate in a citizen initiative. This relates to the idea of
self-government mentioned by Bakker, Denters et al. (2012) so that is way I think this item
will fit the conceptualization and is therefore useful. V13_1 has two answer categories
namely 1, which means ‘’yes’’ and 2, which means ‘’no’’ and is computed as a binary
variable. Besides this, in order to put this item in the same direction as all the other items, a
recode was necessary. Thus, v13_1 is recoded into v13_N1 in which 0 means ‘’no’’ and 1 means ‘’yes’’.
The next section of the operationalization is about how the variables are constructed. The
concepts use, sometimes exists of different dimensions, in this case for instance, the
different aspects of participation. In some cases, it is expected that these different aspects
measure the same thing. In other words, they measure one dimension. If this is the case, it
can be decided to make one variable out of it. However, it can also be the case that there are
for instance two or maybe three ‘’types’’ of participation. If this is the case, a variable that
exists of different dimensions can be made which result into making sub dimensions or
maybe delete certain items that do not contribute to the scale.
21
analysis and reliability analysis must be performed. The factor analysis also explains
whether the items used are coherent or not. The reliability analysis is being performed when
the items are measured on one dimension. If this is done, it must be checked whether all the
items used score high and are suitable for measuring the variable. However, this might not
be relevant for all the items because doing factor analysis and checking for reliability is only
necessary when you have a Likert-scale. Thus, that is why it is justified that in this case, the
factor analysis is only performed for some items because for the other items it does not have
any added value. After that, when the scales are set, the quality of the scales must be
assessed. This can be done via Cronbach’s Alpha. When there is a strong correlation
between the items, the alpha is high and when there is no strong correlation between the
times, the alpha is low. It can be assumed that an items with a Cronbach's Alpha higher than
0.7 are accepted in this case.
Thus, for the variable ‘’interest’’ which relate to the items: v32b, v34a, v34b, v35 and v37
factor analysis and a reliability check is performed.
A factor analysis is performed to first of all see whether the item is explained by one or more
factors. As shown in table 3 only the first component one has an eigenvalue greater than 1.
This means that all the items can be explained by one factor only. Besides this, the factor
analysis also showed that rotation is not possible and this also indicates that the items are
explained by one factor only. In other words, all the items measure the same dimension and
thus one variable can be made out. Besides this, the correlation matrix that is included in the
appendix as table 3 shows that the correlations between the items range between 0,197 and
0,500. This means that the correlations are not very high, but are also not very low. When
interpreting this, it could be argued that the scale is coherent.
22
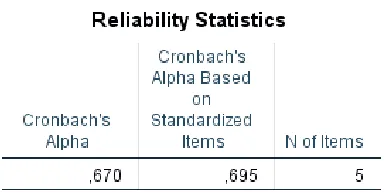
Table 4: Cronbach’s Alpha
Table 5: Item-Total Statistics
In table 4 the Cronbach’s alpha between the five items is computed. The alpha level is 0, 67
which is relatively high (table 4). In the previous section I argued that that an alpha level of
0, 7 should be acceptable. However, the right alpha level is still a matter of debate and since
0, 67 is very close to 0, 7, I accept 0, 67 to be a reliable alpha level. Moreover, the item total
correlation row (table 5) shows that the correlations between the items range from 0,355 and
0,555 which could be interpreted as relatively normal correlations. Besides that, table 5 also
shows that for all the items, the Cronbach alpha would be lower than it is now if one of the
items is deleted. To sum up, when the factor analysis and reliability check, it could be argued
[image:22.596.74.367.267.524.2]23
3.4 data analysis
In the first section of the analysis, the frequencies of all the variables are shown, starting with
the two dependent variables and continuing with all the independent variables. In addition, the
main point in chapter 4.1 is that the sub questions posed in chapter two are being answered.
Before doing regression analysis, several conditions have to be met. These assumptions are
checked before performing the regression analysis. Since the regression analysis is performed
in chapter 4.2, it is decided that the assumptions are checked in this chapter.
In this chapter, several assumptions have to be checked in order to perform a regression
analysis. These conditions are: checking whether the variables are continuous, the linearity
assumption, independence of errors, constant error variance (homoscedasticity), normally
distributed errors, no multicollinearity and no significant outliers.
With the linearity assumption, it must be checked whether the independent and dependent
variable are linear, in other words, whether there is a relation between the variables or not.
The independence of errors assumption checks whether the errors are independent from each
other. In addition, homoscedasticity refers to the idea that the variance of errors should not
change across the values of X. Furthermore, the normally distributed error assumption checks
whether the errors of the regression are normally distributed. The ‘’no multicollinearity’’ assumption is checked via the VIF option on SPSS and the ‘’no significant outliers’’ checks
whether there are any extreme cases.
After that, the regression analysis is set out in chapter 4.2. While using the constructed
scales, a regression analysis is being performed and the expectations derived from the
theoretical framework are tested. The data will be analyzed on the basis of a linear regression
analysis and via a logistic binary regression analysis. This means that several expectations
are set out and then it is tested whether these relations are significant or not and if there are
any differences regarding the strengths of the relations. In this paper, it is decided that the
relationship is significant when the significance level is smaller than 0, 05. When a
relationship is seen as significant, it can be assumed that there is a relationship between the
independent and dependent variable. Other key figures are the standardized b coefficient in
which it can be checked how strong the relationship is and the standard error which indicates
the length between the data points and the regression line. This of course, should be as small
as possible. Besides this, key figures in doing a logistic binary regression analysis are the
Exp (B) and the significance values. It should be mentioned that there is a somewhat
24
both for local political participation and local civic participation. Then, it is checked on
which type of participation the influencing factor has a significant relation with and if there
are any differences regarding the strength of the relations. Besides this, it is aimed to have
the highest R-square value possible so that the model is able to fit the data used. Moreover,
the goal is to have as many valid cases possible but this would probably not be a danger
since the database that is used consists of more than 1000 cases.
Assumptions regression analysis
The first assumption that needs to be checked is whether the variables are continuous. This
means that they have to be measured at an interval or ratio level. The dependent variables
need to be measured at an interval or ratio level while the independent variables need to be
measured at the interval, ratio, binary level or when dummy variables are created. All the
independent variables are treated as continuous. However, the dependent variable ‘’local political participation’’ is computed into a scale while the dependent variable ‘’local civic participation’’ is computed as nominal. This means that for the dependent variable ‘’local
civic participation’’ no linear regression analysis can be performed. Thus, for this reason, it
is decided to perform a logistic binary regression analysis for the dependent variable ‘’local
civic participation’’.
The second assumption that is checked is the linearity assumption. The linearity assumption
checks whether there is a relationship between X and Y. This is checked via SPSS by
computing scatterplots. The scatterplots can be found in the appendix. In order to interpret
the scatterplots it should be mentioned that the closer that the adjusted regression curve is to
the line, the more likely it is that the assumption is not violated. The different tables in the
appendix show a strange pattern. The reason why the dots in the different scatterplots are
overlapping might be a result of the variable construction because some of the variables are
not continuous. Thus, the reason why the dots are overlapping is a results of the fact that one
dependent variable is not continuous and some independent variables are not continuous.
The scatterplots separately follow a certain pattern but it is difficult to assess whether it is
linear or not.
Furthermore, the third assumption is the independence of errors assumption. This can be
checked via the Durbin Watson test via SPSS. The model summary (chapter 4.2, table 18)
shows that the Durbin Watson test has a score of 1,504. Overall, a score ranging from 1, 5
25
other.
In addition, the next assumption is about the homoscedasticity. This test argues that the
variance of errors should not change across X. This means that in the scatterplots, the data
should not follow a certain pattern. See the appendix for the separate scatterplots.
The next assumption is about the normal distributed errors, checked in chapter 4.1 where the
different histograms are displayed.
Besides this, another assumption that also needs to be met is the ‘’no multicollinearity’’
assumption which means that there must be no correlation between the independent
variables within a regression model. This is checked via the VIF option in SPSS. In the
appendix as table 16 it is shown that the VIF is 1 which means that there is no
multicollinearity in this model.
The final assumption is about having no significant outliers. An outlier indicates that there is
an observation that is extreme in relation to all the other data. This is important to take into
account as it might influence the interpretation of the data. However, since the data set that is
used is so large, a few outliers might not change the results so for that reason this assumption
is not checked.
Assumptions logistic binary regression analysis
The first assumption when performing a logistic binary regression analysis is that the
dependent variable must be measured at a dichotomous scale. In this case, the dependent
variable refers to ‘’local civic participation’’ which is measured via the question whether someone has been active in a citizen initiative in which people can either state ‘’yes’’ or ‘’no’’. This means that the first assumption is fulfilled.
The second assumption is that there must be at least one or more independent variables. This
assumption is also met since there are four independent variables that are tested in this study.
The third assumption states that the dependent variable must consist of mutually exclusive
answering categories. In this study the answering categories are ‘’yes’’ or ‘’no’’ which
means that this assumption is also fulfilled.
The final assumption is the linearity assumption, this assumption checks whether there is a
linear relationship between de dependent variable and the independent variables. This can be
tested via a box-Tidwell test. In the appendix as table 17 it is shown that three of the four
relations are significant. This means that there might be an issue regarding linearity.
However, the sample size also plays a role here and since the data set that is used is so large,
26
Thus, as already mentioned, only for the dependent variable ‘’local political participation’’ a multiple regression analysis is performed. For the other dependent variable ‘’local civic participation’’, a logistic binary regression analysis is performed.
In this chapter, first the type of research was discussed. Besides this, the limitations that
derive from this type of research was also mentioned. After that, it was explained where the
data derived from. It was mentioned that the data that is used derived from the LKO2018
database. Furthermore, in the operationalization section, first the operationalization of the
items were set out, and with that, it was justified why those items were selected. Then, the
operationalization of the data was set out and factor analysis and reliability analysis was
performed. Finally, in the last section of this chapter, the assumptions when doing a linear
regression analysis and when doing a logistic binary regression analysis were set out.
To give an overview of chapter 4, first the descriptive data is showed, then the regression
analysis is performed and then the test for the dependent variable ‘’local civic participation’’,
the logistic binary regression analysis is performed. On the basis of that, the results are being
27
4.0 Analysis
4.1 Descriptive analysis
The first sub question states ‘’to what extent are Dutch citizens politically active and
civically active? So the frequencies of the local political participation and local civic
[image:27.596.80.309.256.409.2]participation are first analyzed.
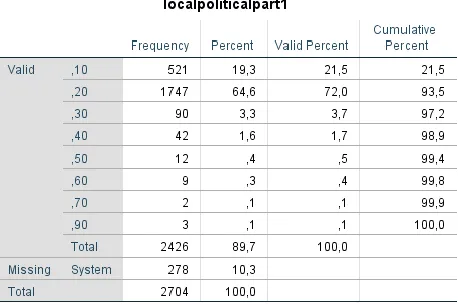
Table 6: dependent variable ‘’local political participation’’
Table 6 refers to the frequencies of local political participation. The variable local political
participation has a mean of 0, 19. The variable is normally distributed but it is skewed to
the right. Besides this, table 6 shows that the number of cases is 2426 which means that the
sample is large enough. In addition, table 6 shows that the percentages are higher in the first
columns of the table and become lower at the end of the columns. It can be concluded that
regarding local political participation, most people in the sample are not very active. Thus
table 6 shows that in this sample, people are not very active with regarding local political
participation.
Furthermore, this scale consist of ten items in which all the items are added up and then
divided by ten. The values range from 0-1 in which 0 means doing nothing, so not being
28
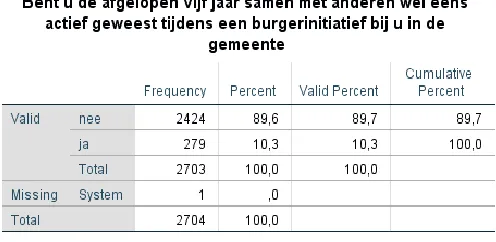
Table 7: the dependent variable ‘’local civic participation’’
To continue, table 7 displays the frequency table related to local civic participation. The
variable is measured by one item only. Table 7 also shows that the number of valid cases is
2703 which is a large sample. Besides this, the table shows that 89, 6 percent of the sample
has not been active regarding local civic participation and 10, 3 percent has been active
regarding local civic participation. Thus, table 7 shows that regarding local civic
participation, the people in this sample are not really active.
Thus, when only looking at the descriptive data of the two dependent variables, one could
argue that in this sample, people are not really active in both types of participation. This is
the case because as showed above, the data is highly skewed to the right and the frequencies
show that most people in this sample are not active. Thus, to give an answer to the first sub
question which states: states ‘’to what extent are Dutch citizens politically active and
civically active? It could be argued that Dutch citizens are politically and civically not really
29
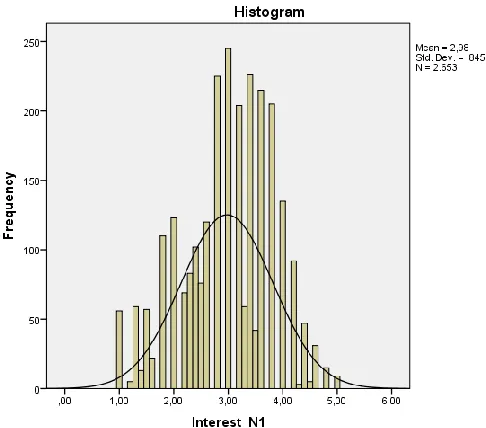
The second sub question states: ‘’To what extent are the factors: interest, resources,
internet use and urbanization different compared to each other?’’ So the frequencies of all
the influencing factors are analyzed. The first influencing factor that is analyzed is the
[image:29.596.84.327.201.415.2]variable ‘’interest’’
Figure 8: histogram ‘’interest’’
In table 18 in the appendix and figure 8 the frequencies of the ‘’interest’’ variables are
shown. Figure 8 shows that the data is normally distributed and has a mean of 2, 98.
Besides this, table 18 in the appendix shows that the sample has 51 missing cases but still
has a sample of 2653. The frequency table also shows that the data is normally distributed
since the frequencies are higher in the center of the table and lower at the edges of the table.
The fact that the data is normally distributed and peaks in the center of the table tells us that
in this sample, most people are quit interested in local politics, local newspapers, local
television, local radio and the local news.
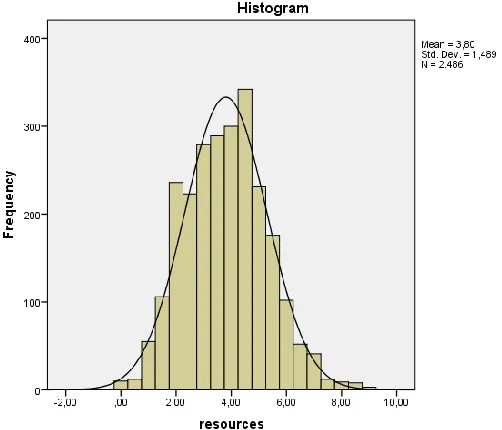
Furthermore, the next influencing factor that is analyzed is the variable ‘’resources’’. As
already mentioned, this variable consist of two different items. One of the items is about the
income and the other item indicates to the education someone has. The variable resources is
tested but the two items are also tested separately. For that reason, the frequencies of the
variable ‘’resources’’ is analyzed, but also the frequencies of the items ‘’income’’ and ‘’education’’ are analyzed. The resources scale thus consist of two items in which both
30
[image:30.596.84.335.384.599.2]Table 9: frequencies ‘’resources’’
Figure 10: histogram ‘’resources’’
Table 9 and figure 10 display the frequencies of the variable ‘’resources’’. The histogram
shows that the data is normally distributed but a little bit skewed to the right with a mean of
3, 80. Table 9 shows that there is a sample of 2486 and that there are 218 missing cases. To
interpret these frequencies, it could be argued that in this sample, people score quit average
on education and income which means that this sample does not represent for instance only
31
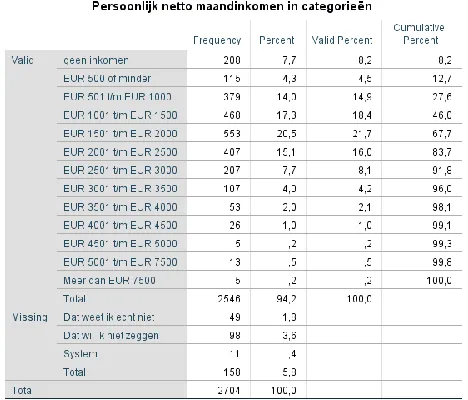
table 20 show the frequencies of education and income in The Netherlands as a whole. In
table 19 in the appendix it is shown that most people in the Netherlands in 2018 fall in the
category, HAVO/VWO/MBO. However, category HBO, which is the highest in the
LKO2018 sample (see table 11), also scores relatively high. Besides this, table 20 in the
appendix displays the incomes in the Netherlands. The last two columns represent the
monthly wages. The last column is the month wage without any extras. The wages range
from 1012-5437. As table 13 shows, in the LKO2018 sample, the categories 1001-2500
score highest. Taking table 19 and table 20 from the appendix into account, it could be
argued that the sample from the LKO2018 survey score quit well with regard to income and
[image:31.596.80.408.327.502.2]education when comparing it to the rest of the population of the Netherlands.
[image:31.596.86.328.540.754.2]Table 11: frequencies ‘’education’’
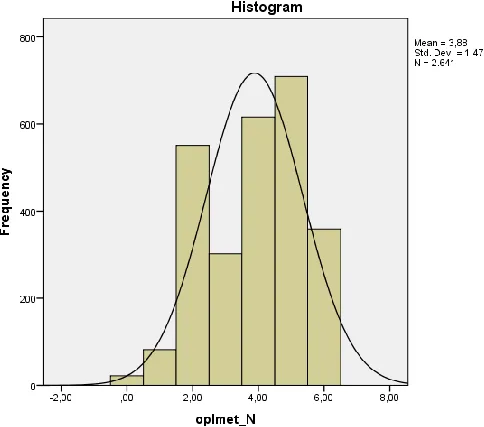
32
Table 11 and figure 12 show the frequencies related to the variable ‘’education’’. The two
tables show that the data is normally distributed with a mean of 3, 88. Table 11 shows that
people having a ‘’HBO’’ degree score highest and people having no education yet scores lowest. However, the people who have ‘’MBO’’ score as second highest. This means that
in this sample, there are people with a high education, but also people with a lower
[image:32.596.77.311.241.441.2]education which is good for the representativeness of the sample.
[image:32.596.84.334.498.715.2]Table 13: frequencies ‘’income’’
33
Table 13 and figure 14 show the frequencies of the variable ‘’income’’. As shown in table
13, the incomes are categorized into different categories. The data is normally distributed
but somewhat skewed to the right with a mean of 3, 7. As the frequency table shows, the
category with people having an income of 1501-2000 score highest. The table also shows
that the categories with people earning 4501 or more are poorly represented compared to
the Dutch population as a whole. This is also visible in table 20 in the appendix since only
one category has a monthly wage more than 4501. When interpreting these two tables, it
[image:33.596.79.258.304.398.2]could be argued that the big earners are not really represented in this sample.
Table 15: frequencies internet use
To continue, the next variable that is analyzed is the variable ‘’internet use’’. Table 15
displays the frequencies of this variable. The frequency table shows that most people score
on the value 0, 2 which means that most people do not use the internet that much in order to
contact public officials or other citizens. This scale consists of five items which are added up
and then divided by five in which 0 means minimum internet use and 1 means maximal
34
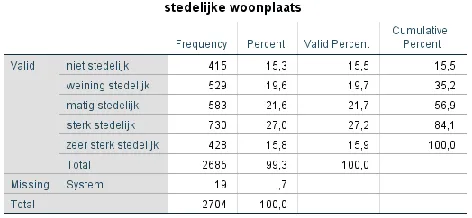
Finally, the last variable that needs to be discussed is the variable ‘’level of urbanization’’.
This variable consist of an item that ranges from the option ‘’not urban’’ to ‘’very urban’’.
[image:34.596.78.314.179.288.2]In table 16 and figure 17 the frequencies of this variable are computed.
Table 16: frequencies ‘’level of urbanization’’
Figure 17: histogram ‘’level of urbanization’’
The histogram shows that this variable has a mean score of 3, 08. Besides this, the
frequency table shows that people living in a ‘’strongly urban’’ environment are most represented in this sample and people living in a ‘’not urban’’ environment score the lowest
frequencies. However, since all the frequencies are very close to each other, it could be
[image:34.596.83.314.365.561.2]35
To conclude, the second sub question was about ‘’to what extent are the factors: interest,
resources, internet use and urbanization different compared to each other?’’
In providing an answer to this question a short summary of the descriptive data about the
influencing factors is set out. In this sample, people have quit some interest in for example
the local news and local discussions. Besides this, the frequencies of the tables related to
the resources also showed that in this sample, people with lower education are included, but
also people with higher education are present. In addition, the tables referring to the income
of people showed that people with an average income are represented most in this sample.
The big earners are not represented that much. Furthermore, the frequencies also showed
that the people in this sample do not really make use of the internet in order to contact other
people or public officials. Finally, regarding the level of urbanization, the sample consist of
both people who live in urban areas and people living in rural areas.
[image:35.596.77.376.409.485.2]4.2 explanatory analysis
Table 18: model summary regression analysis
The results of the regression analysis show that the explained variance of the model, the r
square value is not that high, namely 29, 6 percent. To interpret this 29, 6 percent, it means
the independent variables all together explain 29, 6 percent of the variance in the dependent
variable ‘’local political participation’’. However, a relatively low r square does not
necessarily mean that there is no relation or a weak relation as it might also be the case that
the relation is not linear. Moreover, table 18 also displays the standard error of the estimate
(SEE). A low SEE means that there is a good model fit. In this case the SEE has a value of