http://wrap.warwick.ac.uk
Original citation:
Bhalerao, Abhir, Zhang, Qiang, Helm, Emma and Hutchinson, Charles (2015) Active
shape model unleashed with multi-scale local appearance. In: IEEE International
Conference on Image Processing (ICIP), Quebec City, Canada, 27-30 Sep 2015.
Published in: Proceedings of IEEE International Conference on Image Processing (ICIP)
pp. 4664-4668.
Permanent WRAP url:
http://wrap.warwick.ac.uk/69861
Copyright and reuse:
The Warwick Research Archive Portal (WRAP) makes this work by researchers of the
University of Warwick available open access under the following conditions. Copyright ©
and all moral rights to the version of the paper presented here belong to the individual
author(s) and/or other copyright owners. To the extent reasonable and practicable the
material made available in WRAP has been checked for eligibility before being made
available.
Copies of full items can be used for personal research or study, educational, or not-for
profit purposes without prior permission or charge. Provided that the authors, title and
full bibliographic details are credited, a hyperlink and/or URL is given for the original
metadata page and the content is not changed in any way.
Publisher’s statement:
“© 2015 IEEE. Personal use of this material is permitted. Permission from IEEE must be
obtained for all other uses, in any current or future media, including reprinting
/republishing this material for advertising or promotional purposes, creating new
collective works, for resale or redistribution to servers or lists, or reuse of any
copyrighted component of this work in other works.”
A note on versions:
The version presented here may differ from the published version or, version of record, if
you wish to cite this item you are advised to consult the publisher’s version. Please see
the ‘permanent WRAP url’ above for details on accessing the published version and note
that access may require a subscription.
ACTIVE SHAPE MODEL UNLEASHED WITH MULTI-SCALE LOCAL APPEARANCE
Qiang Zhang
1, Abhir Bhalerao
1, Emma Helm
2, Charles Hutchinson
21
Department of Computer Science, University of Warwick, Coventry, CV4 7AL, UK
2
University Hospitals Coventry and Warwickshire, Coventry, CV2 2DX, UK
ABSTRACT
We focus on optimising the Active Shape Model (ASM) with several extensions. The modification is threefold. First, we tackle the over-constraint problem and obtain an opti-mal shape with minimum energy considering both the shape prior and the salience of local features, based on statisti-cal theory: a compact closed form solution to the optimal shape is deduced. Second, we enhance the ASM searching method by modelling and removing the variations of local appearance presented in the training data. Third, we speed up the convergence of shape fitting by integrating information from multi-scale local features simultaneously. Experiments show significant improvement brought by these modifica-tions, i.e., optimal shape against standard relaxation methods dealing with inadequate training samples; enhanced search-ing method against standard gradient descent methods in searching accuracy; multi-scale local features against popular coarse-to-fine strategies in convergence speed.
Index Terms— Active shape model, over constraint, in-verse gradient descent, multi-scale features
1. INTRODUCTION
Active Shape Models (ASMs) [1] have been successfully used as a robust tool for object segmentation. An ASM constrains the shape with a statistical shape prior learned from training examples, thus is robust to noise. The constraint is applied by abandoning the minor variation components and restricting the significant components within certain range. The argu-ment is that the the minor components in the training data are more likely to be noise, and only shape variations within cer-tain standard derivations (s.d.) covered in the training data are deemed plausible. However this is no longer true in the case of high dimensional training data sets with few training ex-amples, which causes over constraint. This problem becomes more critical in medical image analysis due to inadequate training samples and varied pathologies. There have been strategies to relieve the over constraint, including loosening up the shape constraints [2, 3], introducing additional flexibil-ity [4], synthesising additional training samples [5], and more recently, modifying shape prior using manifold learning [6] or sparse composition [7]. In these methods there is no
ob-vious a priori optimal parameters and it is time consuming to tune the parameters to specific applications. Another strategy is to optimise an objective function [8–10]. In [9,10] Matthias adopted the density estimation theory [11] to calculating the information loss caused by constraint and constructed a en-ergy function searching for a shape with minimum cost.
Another problem is that ASMs are prone to local mini-mum. A coarse-to-fine strategy is commonly employed in all recent publications [12], but the criterion of switching to next resolution has to be chosen appropriately to avoid trapped into local minima. Indeed, as shown below it is a trade-off be-tween the failure rate and iteration number per level. In prac-tice, the criterion is often chosen conservatively, and a seam-less coarse-to-fine method could speed up the fitting process significantly.
The first part of this paper is inspired by [9,11]. We tackle the over-constraint problem by penalising the two constraint terms and obtain an optimal shape in a statistical sense with respect to the shape priori as well as the salience of local fea-tures. We further derive a closed form solution of the optimal shape under the assumption of the Gaussian distribution of variations. In section 3, we adopt the inverse gradient descent (IGD) for local feature searching and enhance its robustness by learning and excluding the variation prior of local appear-ances. In section 4, we integrate multi-scale features into the energy function of unleashed ASMs, which leads to a seam-less, fast and robust coarse-to-fine fitting method. We evaluate the influence of these modifications by applying them sepa-rately. Experiment shows significant improvement of perfor-mance especially with very limited training data.
2. ACTIVE SHAPE MODEL UNLEASHED
A 2D point-distribution shape in an ASM is represented by s= (x1, ...,xN) = (x1, y1..., xN, yN)∈R2N. The statistical model is built by applying PCA to the aligned training shapes,
bs=PsT(s−¯s), (1)
withbsbeing the shape parameters andPs the eigenvectors
matrix. The dimensionality is reduced by retainingtmost sig-nificant eigenvectors associated with the eigenvaluesλ1, ...λt.
tcan be chosen ast = min{t0|Pti0=1λi/P
2N
Standard ASMs constrain the shape within either a hyperrect-angle [1] or a hyperellipsoid [13]. This can cause over con-straint with inadequate training data, which is often the case in medical data as no training set can cover all pathologies. The over constraint has two causes: first, it does not count the cost of truncating minor components, which might cap-ture shape details although is not statistically significant; sec-ond, shape variations outside 3s.d. might still be reasonable variation. Choosing a largert or more s.d. may relieve the problem [2], but an optimal solution is to find a shape with minimum information loss due to projection to the subspace and the constraint. This can be achieved by constructing an energy function accounting for these terms, i.e, penalising the cost of projection as well as the Mahalanobis deviations from the mean shape and from the local feature predictions:
E(s) =EshapeDIF S(s) +EshapeDF F S(s) + β
1−βEim(s). (2)
β∈(0,1)controls the extent of unleashing, which can be ad-justed accordingly. With the assumption that the shape vari-ations are multivariate Gaussian distributed, the shape energy terms [11] are as follow:
EshapeDIF S(s) = 1 2b
T sΛ
−1b
s, (3)
namely the distance in feature space (DIFS) is the Maha-lanobis distance from the mean shape,Λ = diag{λ1, λ2, ..., λt}
is the variance matrix, whereas
EshapeDF F S(s) = 1
2ρ(||s−¯s|| 2− ||b
s||2), (4)
is the distance from feature space (DFFS) penalising the costs of the projection to the feature space (i.e. the infor-mation loss due to cutting-off the minor eigen values),with ρ=P2N
i=t+1
λi
2N−t. The image energy can be written as,
Eim(s) =
1 2(s−ˆs)
TΣ−1(
s−ˆs), (5)
which is the Mahalanobis distance from the observed land-marksˆs= (ˆx1,xˆ2, ...,ˆxN)deduced from local features.Σ =
diag(σ2
1,σ22, ...,σ2N)is the variances, withσi2= (σx,i2 , σ2y,i)
representing the salience of thei-th landmark inˆs(the smaller the more salient). The optimal shapes∗with maximum like-lihood [11] is the one with minimum energy,
s∗= arg minE(s). (6)
Instead of using numerical searching methods [9], we deduce an closed form solution, which reduces the computation and guarantees the global minimum. Specifically, Eq. (6) is solved
by dEd(ss)
s∗ = 0.From (1) we havedbs/ds=P T
s . We first
calculate the differentiation of each term ofE. dEDIF S
shape(s) ds =PsΛ
−1
bs=PsΛ−1PsT(s−¯s),
dEDF F S shape (s)
ds = 1
ρ((s−¯s)−Psbs) =
1
ρ(I−PsP T s)(s−¯s),
dEim(s) ds =Σ
−1
(s−ˆs).
(7)
Substituting these into (6), the solution obtained is,
s∗=B−1C+ ¯s, (8)
whereB = (1−β)PsΛ−1PsT +
1
ρ(I−PsP T s)
+βΣ−1,
andC=βΣ−1(ˆs−¯s).
3. ACTIVE SHAPE MODEL SEARCHING
The shape model is driven by local features, appearance of which varies across the training samples. The performance can be improved by learning the appearance variations in the training set and excluding the differences by ‘projecting out’ these variations before matching features to their templates. We adopt inverse gradient descent (IGD) [14] previously used in active appearance model fitting [15] for this purpose.
Given a set of local 2D featuresAi,1, Ai,2, ..., Ai,N ∈R2 at thei-th landmark inNtraining samples, PCA is applied to obtain the meanA¯iand the eigenvectors matrixPA,ispanning
a linear subspace covering, say,98%of the variation. For the concise of notation, we omit the landmark subscriptiin this section. A new feature instanceAthus can be approximated as,
A≈A¯+PAbA. (9)
bAis the appearance parameters.
Given a new image and an appropriate initial locationx= (x, y)for a landmark, the searching task is to adjustxandbA
to minimise the difference between the appearance model and the image intensities it covers:
(∆x,bA) = arg min(A(x+ ∆x)−( ¯A+PAbA))2. (10)
The expression of the target function can be rewritten as,
kA(x+∆x)−( ¯A+PAbA)k2PA+kA(x+∆x)−( ¯A+PAbA)k2⊥.
(11) wherek · k2
PA andk · k
2
⊥ denote the square of the Euclidean
norm of the vector projected into the subspace spanned by PAand its orthogonal space respectively. Note the minimum
value of the first term is always zero. And in the second term, the projection ofPAin its orthogonal subspace is zero. As we
are only interested in∆x, it simplifies to:
∆x= arg minkA(x+ ∆x)−A¯k2
⊥, (12)
which is a typical gradient descent problem. Now the pre-diction ofx is no longer affected by the appearance varia-tions, which have been ‘projected out’. Applying the gradient descent directly is expensive as the numerical gradient ofA needs to be calculated iteratively. This can be tackled with IGD, i.e., reverse the roles ofAandA0,
∆x= arg minkA¯(−∆x)−A(x)k2
⊥. (13)
The closed form solution is,
∆x=
∂A¯ ⊥
∂x
+
Fig. 1. (a) Four scale features at a landmark. (b) One standard error bar of predictions from finest level (green) and coarsest level (red) features. Blue dash line indicates the actual po-sition. (c) Gaussian mixture model of four scale predictions with initial position at 2 (top) and 16 (bottom) pixels from the actual position.
where(·)+ denotes the Moore-Penrose pseudo-inverse. A¯
⊥
is the projection ofA¯onto the orthogonal space ofPA and
can be pre-calculated, see [14] for details.
Variance: The variance of prediction of∆xshould take two parts into account,
σ2=σ2f eature+σdif f2 . (15)
σ2
f eaturedepends on the inherent feature salience, which can
be obtained by testing the feature searching method on the training data and calculating the mean variance.σ2
dif f can be
estimated by calculating the difference between the observed feature and the template in the orthogonal space ofPA.
4. RAPID AND ROBUST FITTING STRATEGY USING MULTI-SCALE LOCAL APPEARANCE
In this section, we introduce a seamless approach to speed up the ASM convergence and increase the robustness. Specif-ically, we generate anL-level Gaussian pyramid of the im-ages. At each landmark, feature patches with same size in pixel are extracted from the pyramid, generating a set of pro-files at multiple scales, see Fig. 1(a) as an example. Then at thei-th landmark, features at each levell ∈ {1, ..., L}gives an prediction of the correction∆xi,lwith varianceσi,l2 , using
the method described in section 3.
To evaluate the prediction of the multi-level features, an experiment on the feature example in Fig 1(a) is shown in Fig 1(b). The experiment is conducted by extracting the fea-ture patches at each level with known displacements from the actual position and evaluating the precision of predictions. We can see that the prediction from smaller scale features has smaller variance and better linear approximation around zero, while larger scale features have larger linear range. This ex-plains the feasibility of coarse-to-fine methods as larger scale features drag the shape rapidly to the object during initial iter-ations, while the features at smaller scales begin to converge
Fig. 2. (a) Multi-scale local features. Fewer patches are pre-served at higher level. (b) The corresponding shape nodes.
and give a more precise prediction when near enough to the true position. However, it is difficult to decide whether it is close enough to change to the next level of detail during fit-ting as it is a trade-off between the efficiency and the risk of been trapped in a local minimum.
We propose therefore to incorporate multi-level predic-tions, in a form of a Gaussian mixture, together with the prior knowledge of shape to choose the best candidate pre-diction. The rationale is that the shape energy Eshape is
more likely to be lower when for each landmark the best prediction is chosen. If we assume the errors of the pre-diction is Gaussian distributed, then the prepre-diction of a fea-ture location from all levels are actually a Gaussian mixfea-ture with expectation{∆xi,1,∆xi,2, ...,∆xi,L} and variances of {σ2
i,1,σ2i,2, ...,σi,L2 }, as shown in Fig 1(c). Modifying the
image energy term (5) taking all level predictions into account gives,
Eim(s) =
1 2
L X
l=1
(s−ˆsl)TΣl−1(s−ˆsl), (16)
whereΣl= diag(σ12,l,σ
2 2,l, ...,σ
2
N,l),ˆsl= (ˆx1,l,ˆx2,l...,ˆxN,l).
The optimal shapes∗still has the same form as (8), with the two coefficients replaced by B = (1 − β)(PsΛ−1PsT+
(ρ1∗−PsPsT)) +β PL
l=1Σ
−1
l andC=β
PL l=1Σ
−1
l (ˆsl−¯s).
In practice, larger scale feature patches at adjacent land-marks are more overlapping thus return similar prediction. Also lower precision at coarser levels is acceptable. So we can keep fewer feature patches at interval shape nodes at these levels, as shown in Fig. 2, and propagate the prediction to the landmarks nearby, which results in a more compact feature pyramid.
The implementation of the whole algorithm is as follow:
Training:
1. Train the shape prior using PCA and obtain¯s,Ps, Λ =
diag(λ1, λ2, ..., λt);
2. Build Gaussian pyramid, train the local appearance and
obtainA¯,∂A¯⊥ ∂x
+
for each node (see Fig. 2) at each level;
[image:4.612.57.299.69.189.2] [image:4.612.317.560.69.178.2]1. Generate the Gaussian pyramid of the testing image. 2. Initialise the shapes(0);
3. For each node, calculate∆xl,σl2at each scale using (14);
4. Update the current shapeˆs(lk+1)=s(k)+ ∆xl;
5. Calculate the optimal shapes(k+1)using (8); 6. Repeat 3. 4. 5. until converged;
5. EXPERIMENTS AND RESULTS
As each of our proposed modifications can be applied inde-pendently, we focus on evaluating the improvement brought by each one, comparing the performance with and without. The experiments are performed on 56 axial lumbar vertebra and 30 sagittal knee slices, sizes of both are 512×512 pixels.
1. Feature searching method with appearance mod-elling:For each landmark, we randomly initialise the position within 5 pixels from the true feature and evaluate the search-ing method in section 3 comparsearch-ing it with a standard gradient descent method. After the local appearance variations mod-elled and removed, the 1 s.d. error of local feature searching goes down from4.1±1.6to3.1±1.1pixels on vertebrae and from3.6±1.5to2.8±1.4pixels on knee data.
2. Shape optimisation vs. shape relaxation dealing with over constraint: We compare our energy minimising method with hyperrectangle [1] and hyperellipsoid [13] con-straints in dealing with inadequate training data situation. All three methods are trained with different m data randomly sampled from the dataset and tested on the rest. The experi-mental optimal loosening parameters are chosen for eachm (around 3 s.d. and 1.7 s.d. for hyperrectangle and hyperel-lipsoid constraints respectively), while a constant β = 0.3
[image:5.612.315.559.70.180.2]is chosen for our method. The Distance to ‘True Boundary’ (DtoTB) and Dice Similarity Coefficient (DSC) [16] to the ground truth are used as the metric of segmentation precision. Table 1 shows the experiment results. We can see that our method degrades less with reducing numbers of training sam-ples, and performs better especially with very limited training.
Table 1. Performance of three methods on segmentation of vertebrae and knees, trained with reducingmsamples.
DtoTB (pixels) DSC (%)
Rect.[1] Ellip.[13] Our Rect.[1] Ellip.[13] Our
Vertebra
m= 40 2.6±1.2 2.6±1.0 2.5±1.1 95.3±2.1 95.7±1.8 95.6±2.3
m= 20 3.1±1.3 2.9±1.1 2.7±1.0 94.3±3.1 94.1±2.2 95.0±3.5
m= 10 4.1±1.9 4.2±2.5 3.1±1.1 92.0±3.0 91.8±3.6 93.9±2.1
m= 5 7.7±2.6 7.7±2.9 5.0±1.7 84.1±6.4 84.2±6.7 88.7±4.0 Knee
m= 20 2.7±1.2 2.7±1.3 2.2±0.7 97.4±1.3 97.6±1.2 97.9±0.7
m= 10 4.3±2.7 3.5±2.5 2.7±1.0 96.3±3.2 96.7±2.6 97.6±1.0
m= 7 5.5±3.0 3.7±2.5 3.0±1.3 94.3±4.9 96.3±2.5 97.3±1.1
m= 5 7.2±3.2 4.9±2.6 4.0±2.5 92.5±4.3 94.9±3.2 96.6±1.8
3. Multi-scale vs. coarse-to-fine in convergence speed:
We randomly initialise the shapes within 30 pixels from true
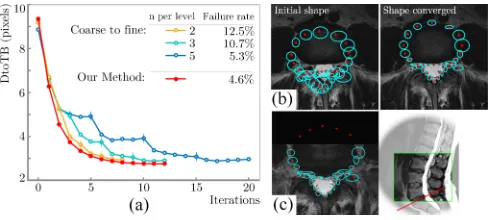
Fig. 3. (a) Convergence process and failure rate of multi-scale strategy compared with coarse-to-fine method with certain it-erations per level. (b) Cyan ellipses show the predictions from local features with the sizes indicating the variances. Red crosses show the optimal shape. (c) A special case when part of the vertebra in the axial slice is missing.
position and compare our multi-scale method with a coarse-to-fine method usingn= 2,3,5iterations per level. Fig. 3(a) shows the mean result of an intensive test trained on 20 sam-ples. The corresponding failure rate (being trapped in local minima) is also given. It shows that with decreasingn, the failure rate increases. While our method converges fastest with lowest failure rate. The shape in our method is driven by multi-scale features simultaneously. Salience of each scale is controlled by the variance of predictions. Fig. 3(b) gives an example of variances at the finest level before (left) and after (right) the convergence. The variations decrease significantly when the landmarks find the salient features, meanwhile the features whose boundary is blurred have higher variance, thus depend more on the shape prior. In a special case in Fig. 3(c) when part of the object is missing, these variances become in-finite and the corresponding landmarks are completely based on other salient ones and the shape prior, which is similar to the partial ASM [17] in dealing with the missing boundary but is feature-driven thus more compact.
6. CONCLUSIONS
Several modifications of ASM have been presented. Experi-ments validated the improvement in three aspects.
(1) Higher precision in local feature searching. This is be-cause variations of feature appearance presented in the train-ing data are learned and modelled, and durtrain-ing feature search-ing these variations have been ‘projected out’ before matchsearch-ing to the feature template.
(2) Better performance with limited training samples. The shape is unleashed and optimal in a statistical sense taking both the shape prior and feature confidence into consideration thus the detail of salient features is better preserved.
[image:5.612.57.298.576.688.2]7. REFERENCES
[1] Cootes, Timothy F and Taylor, Christopher J and Cooper, David H and Graham, Jim, “Active shape models-their training and application,” Computer Vi-sion and Image Understanding, vol. 61, no. 1, pp. 38– 59, 1995.
[2] Milborrow, Stephen and Nicolls, Fred, “Locating fa-cial features with an extended active shape model,” in
Proceedings of the European Conference on Computer Vision, pp. 504–513. Springer, 2008.
[3] Shang, Y and Dossel, O, “Statistical 3D shape-model guided segmentation of cardiac images,” inComputers in Cardiology. IEEE, 2004, pp. 553–556.
[4] Heimann, Tobias and M¨unzing, Sascha and Meinzer, Hans-Peter and Wolf, Ivo, “A shape-guided deformable model with evolutionary algorithm initialization for 3D soft tissue segmentation,” inInformation Processing in Medical Imaging. Springer, 2007, pp. 1–12.
[5] Koikkalainen, Juha and Tolli, Tuomas and Lauerma, Kirsi and Antila, Kari and Mattila, Elina and Lilja, Mikko and Lotjonen, Jyrki, “Methods of artificial en-largement of the training set for statistical shape mod-els,” IEEE Transactions on Medical Imaging, vol. 27, no. 11, pp. 1643–1654, 2008.
[6] Zhang, Wuxia and Yan, Pingkun and Li, Xuelong, “Es-timating patient-specific shape prior for medical image segmentation,” inIEEE International Symposium on Biomedical Imaging: From Nano to Macro. IEEE, 2011, pp. 1451–1454.
[7] Zhang, Shaoting and Zhan, Yiqiang and Dewan, Ma-neesh and Huang, Junzhou and Metaxas, Dimitris N and Zhou, Xiang Sean, “Towards robust and effective shape modeling: Sparse shape composition,” Medical Image Analysis, vol. 16, no. 1, pp. 265–277, 2012.
[8] Cristinacce, David and Cootes, Tim, “Automatic fea-ture localisation with constrained local models,”Pattern Recognition, vol. 41, no. 10, pp. 3054–3067, 2008.
[9] Kirschner, Matthias and Wesarg, Stefan, “Active shape models unleashed,” in SPIE Medical Imaging. Inter-national Society for Optics and Photonics, 2011, pp. 796211–796211.
[10] Kirschner, Matthias and Becker, Meike and Wesarg, Ste-fan, “3D active shape model segmentation with non-linear shape priors,” inMedical Image Computing and Computer-Assisted Intervention, pp. 492–499. Springer, 2011.
[11] Moghaddam, Baback and Pentland, Alex, “Probabilistic visual learning for object representation,” IEEE Trans-actions on Pattern Analysis and Machine Intelligence, vol. 19, no. 7, pp. 696–710, 1997.
[12] Heimann, Tobias and Meinzer, Hans-Peter, “Statistical shape models for 3D medical image segmentation: A review,” Medical Image Analysis, vol. 13, no. 4, pp. 543–563, 2009.
[13] Cerrolaza, Juan J and Villanueva, Arantxa and Cabeza, Rafael, “Shape Constraint Strategies: Novel Ap-proaches and Comparative Robustness.,” inProceedings of the European Conference on Computer Vision, 2011, pp. 1–11.
[14] Baker, Simon and Matthews, Iain, “Equivalence and ef-ficiency of image alignment algorithms,” inProceedings of the IEEE Conference on Computer Vision and Pattern Recognition. IEEE, 2001, vol. 1, pp. I–1090.
[15] Matthews, Iain and Baker, Simon, “Active appearance models revisited,” International Journal of Computer Vision, vol. 60, no. 2, pp. 135–164, 2004.
[16] Popovic, Aleksandra and de la Fuente, Mat´ıas and En-gelhardt, Martin and Radermacher, Klaus, “Statistical validation metric for accuracy assessment in medical image segmentation,” International Journal of Com-puter Assisted Radiology and Surgery, vol. 2, no. 3-4, pp. 169–181, 2007.