Abstract
Three-Phase Fluidized Beds have found an important place in processing technology as Reactors. Gas-Liquid-Solid fluidization is considered in the present paper as operating bed of fluidized solid particles simultaneously with co-current upward flow of a continuous liquid phase and a gaseous phase dispersed in the form of bubbles. In the present study, the experimental work of the author on heat transfer from the Wall-to-Bed Three-Phase Fluidization is described. The mechanistic models based on Double Thermal Resistance, Surface Renewal and Capillary Tube models are discussed and compared with the author data. After discussing the possible reasons for the discrepancy, a generalized correlation for the wall-to-bed heat transfer coefficient is developed. It was noted that the limitations of Semi-theoretical models and important conclusions are presented. A good understanding of heat transfer mechanism should further aid the design and optimization process.
Key Words: capillary tube, mechanistic model, surface renewal, three-phase, thermal resistance.
1. Introduction
TPFBs with cocurrent upward flow of gas and liquid are recently receiving greater attention because of their wide variety of industrial applications. Many industrial process for hydro treating and conversion of heavy petroleum and synthetic, H – Oil, H – Coal process for coal liquefaction, Catalytic wet oxidation, Methanation, Washing of Uranium ore, Electrolytic tinning process, Bio-Fluidization and waste water purification and alkaloid production with immobilized cells. Recent progress in research and development for TPFBs was reviewed by Kim and Laurant
[1]. The influences of the liquid properties on the htcs in TPFBs were examined by Kato [2], Kang [3], Saberian – Broudjenni [4], Kim [5], Magilioutou [6] , Zaidi [7], Rao Patnaik K.S.K [12], [13], Li, H and A Prakash, [15], Yang, G.Q, [17]. Recently Nigam K.D.P and Schumpe. A [14] has reviewed the TPSRs and it’s fundamentals and analysis of practical systems.
2. Literature review –
Mechanistic models
2.1 Thermal Resistance model
Chiu and Ziegler [8] proposed a model based on thermal resistance of the Fluidized bed. This implies that existence of two resistances of heat transfer, on near the heating surface and the other located inside the bed. The htc was calculated from the following equations
h =
)
(
W BW
T
T
A
Q
−
(1)
Q
W=
m c
p(T
Bout– T
Bin)
(2)
Where TB is the bulk steam temperature
bed at the level of the main heater and Tw
is the wall temperature. They observed that the temperature distributions flattened with increasing gas velocity. This inference radial mixing in TPFBs increases with increasing gas velocity.
Muroyama, K [9] examined the htc data by the equation of the Colburn type
j´
H= 0.137 Re´
LG-0.271(3)
with j´
H= h
w/(
ρ
LC
PLU
L)
ε
LPr
⅔Re´
LG= [Re
L(
ε
G+
ε
L)]/[
ε
L(1-
ε
G-
ε
L))]
(4)
The plots of j´H Vs Re´LG for the TPFBs
independent of solid properties within the accuracy of heat transfer experiments.
2.2 Surface Renewal model
In TPFBs the continuous splitting and recombination of liquid stream around bubbles and particles generate the radial flow of the liquid phase between the heater surface and the bed. The liquid elements will stay for a certain period of time at the surface and leave it and enter the bulk fluid again. In the liquid elements adjacent to wall, unsteady heat diffusion may take place. The rate of heat transfer is controlled by the rate of renewal of liquid element which depend on the intensity of turbulence.
The mathematical representation of the above mechanism is
t
T
∂
∂
=
α
L 2
2
r
T
∂
∂
(5)
subject to the boundary conditions
T = T
w, r = 0, t
≥
0,
T = T
B, r > 0, t = 0,
T = T
B, r =
∞
, t > 0,
The mathematical solution of the above equation leads to the temperature profile. Therefore the average heat flux during the contact time
θ
of the liquid eddy at the exchanger surface is given byq = 2
πθ
α
Lρ
L
C
PL(T
W– T
B)
(6)
The htcs in TPFBs can be represented by
h = C
5 .0 5 .0
]
)}
/(
]
)
)(
{[(
[
k
Lρ
Lc
PLU
L+
U
Gε
Sρ
S+
ε
Lρ
L+
ε
Gρ
G−
U
Lρ
Lg
ε
Lμ
L(7)
where C is the proportionality constant.
2.3 Capillary Tube model
The heat transfer in TPFBs is influenced by the hydrodynamics effects of the gas – liquid and solid – phase and the thermophysical properties of the liquid phase and can be represented by the following relationship
h = f (hydrodynamic variables, liquid thermophysical properties)
The hydrodynamic variables can be represented by Reynolds number Reand Froude number Fr and the thremophysical properties by Prandtl number Pr. The above relationship, therefore, is described as follows:
St = F (Re, Fr, Pr) (8)
if Stanton number St is used for the htcs. For TPFBs, however it is not easy to define clearly the characteristic velocity and length scale due to the presence of gas phase. Kato [2], therefore, employed Reynolds number for the hydrodynamic contribution of liquid phase and an additional dimensionless number, i.e., Froude number due to the presence of gas phase. All the correlations for the heat transfer in TPFBs based on the capillary tube model are reduced to a relationship for hin LSFBs,
h ~ c
aPL kb
L
ρ
cLμ
dLd
eSd
fRu
yLє
hSє
iL(9)
The energy dissipation rate per unit mass of liquid has been used widely for developing a unified correlation of transport parameter in multiphase reactors. From a macroscopic viewpoint Suh, [10] the energy dissipation rate per unit cross sectional area of a TPFB with a bed height of HR is calculated as the rateE = (u
L+ u
G)
Δ
P
HR– H
Rg(u
Lρ
L+ u
Gρ
G)
(10)
In whichΔ
PHR is the pressure drop across the bed height HR andrepresentation as follows
Δ
P
HR= (
ε
Sρ
S+
ε
Lρ
L+
ε
Gρ
G)gH
R(11)
A less rigorous method determining the energy dissipation rate in TPFBs adopted by Yasunishi . [11], however, the superficial liquid velocity instead of the interstitial liquid velocity for the relative velocities between the liquid and particles and between bubbles and the liquid.
3. Experimental
The experimental set up is used for investigating the htcs in TPFBs is the same on that used for heat transfer experiments described elsewhere. The complete experimental construction, explanation and procedure is therefore omitted here.
In the present observation, nearly 500 experimental runs are conducted covering different particle sizes, different bed weights with Water – Air and Aqueous glycerol – Air as Fluidizing media.
4. Results and Discussion
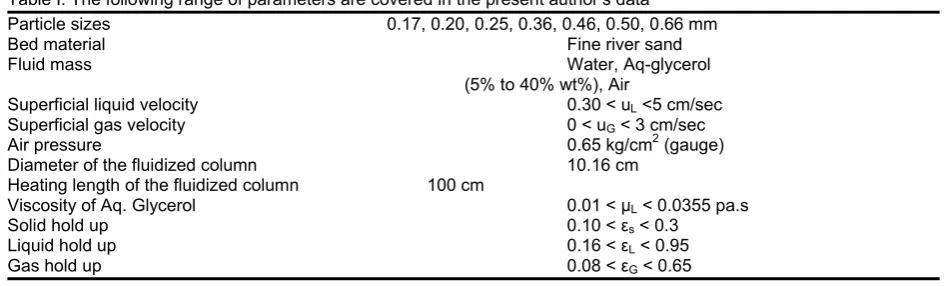
[image:3.595.74.549.622.765.2]Table I: The following range of parameters are covered in the present author’s data Particle sizes 0.17, 0.20, 0.25, 0.36, 0.46, 0.50, 0.66 mm
Bed material Fine river sand
Fluid mass Water, Aq-glycerol
(5% to 40% wt%), Air
Superficial liquid velocity 0.30 < uL <5 cm/sec
Superficial gas velocity 0 < uG < 3 cm/sec
Air pressure 0.65 kg/cm2 (gauge)
Diameter of the fluidized column 10.16 cm
Heating length of the fluidized column 100 cm
Figure.1 represents the relation between the j´H vs Re´LG for the TPFBs are
presented. The author’s data is scattered and below the Muroyama, K (9) predicted value. The correlation is almost independent of the particle properties with in the accuracy of heat transfer data. The author’s correlation for the whole range of data is with in the ± 15% deviations. Figure. 2 represents the relation between the h Vs x where x = and also ‘h’ increases with variable ‘x’.
The author’s data having large scatter and fall below the Suh, (10) line. This clearly shows that the constant ‘c’ cannot be predicted from theory. It may be concluded that surface renewal model is purely a semi-theoretical requiring further development. However, at this stage it is difficult to substantiate the validity of these semi-empirical models. Figure. 3 indicates the relation of Capillary tube model which is based on hydrodynamic and thermophysical properties of liquids i,e Stantum number, St Vs [Re Pr2 Fr]-¼
directly reads the proportionality constant C = 0.0665 from the author’s data. If the value of
C = 0.0647 Suh et, al (16) instead of 0.1 is used in general equation gives a constant value of the relative apparent bed viscosity
5. Conclusions
1. The author’s data show the same trend as that of Muroyama. K, [9] on j´H factor Vs Re´LG correlation
plot. The author’s data fall below the muroyama correlation. The author’s data is represented by
j´H = 0.175 Re´LG
with ± 10% deviation (12)
2. The author’s data show a large scatter. The author’s data is represented in accordance with the surface renewal model as
h=
0
.
042
5 .0 5 .0
]
)}
/(
]
)
)(
{[(
[
k
Lρ
Lc
PLU
L+
U
Gε
Sρ
S+
ε
Lρ
L+
ε
Gρ
G−
U
Lρ
Lg
ε
Lμ
L (13)With ± 20% deviations.
3. The author’s data show an excellent agreement with the Suh and Deckwer [16] based on capillary tube model. The author’s data is represented by
Stl = 0.0665 [Pr2 Rel Frl
l b
μ μ
*
1
v
P
]-1/4
(14)
4. The fact that the constant C cannot be predicted from the theory.
5. It may be concluded that these models (Double Thermal Resistance, Surface Renewal and Capillary tube) are purely a semi-empirical requiring further development.
Notation
A = geometric surface area for heat transfer
Q = power dissipated by the heating surface
q = heat flux m = mass flow rate
cP = heat capacity at constant pressure
uG = Superficial gas velocity
uL = Superficial liquid velocity
h = wall-to-bed heat transfer coefficient
c = proportionality constant K = Thermal conductivity
j´H = modified Chilton-Colburn factor for
heat transfer at the wall Re´LG = modified Reynolds number
t = real time
T = temperature difference Ker = effective thermal conductivity
ds = particle diameter
Ut = radial velocity component
ηb = relative apparent bed viscosity
μb = apparent effective bed viscosity
g = acceleration due to gravity HR = bed height
μl = liquid viscosity
E = energy dissipation per unit cross-sectional area
ΔPHR = pressure drop across the bed
height
Pv = mechanical energy dissipation
rate per unit volume of liquid in TPFB
*
v
P
= dimensionless groupTPFBs =Three-Phase Fluidized Beds
TPSRs =Three-Phase Sparged Reactors
htc =heat transfer coefficient
LSFBs =Liquid-Solid Fluidized Beds
Greek symbols Є = phase holdup μ = dynamic viscosity ρ = density
α = thermal diffusivity Θ = contact time
Subscripts G = gas phase L = liquid phase S = solid phase P = particle B = bed W = wall
References
[1]. Kim, S.D and Laurent, A., (1991) “The state of knowledge on heat transfer in Three-Phase Fluidized beds”, Intl. Chem. Eng. 31,2, 284-302
[2]. Kato, Y., Uchida, K., Kago, T and Morooka.S (1981) “Liquid holdup and Heat Transfer Coefficient Between Bed and wall in
liquid-solid and Gas-Liquid-Solid Fluidized Beds” Powder Techmol, 28, 173-179
[3]. Kang, Y., Suh, I.S and Kim, S.D.(1985) “Heat Transfer characteristic of Three Phase Fluidized Beds”, Chem. Eng. Commun, 34, 1-13
[4]. Saberian-Broudjenni, M, Wild, G, Midoux,N and Charpentier, J.C (1985) “Contribution to the study of wall heat transfer in reactors with a Gas-Liquid-Solid Fluidized Bed at low liquid velocities”, caned J. Chem. Eng, 63, 553. [5]. Kim, S.D, Kang, Y, and Kwon,
H.K (1986) “Heat Transfer characteristics of two and Three-Phase Slurry Fluidized Beds”, AIChE.J. 32, 1397.
[6]. Magiliotou, M.,Chen, Y,M, and Fan, L.S (1988) “Bed immersed object heat transfer in a Three-Phase Fluidized Bed”, AIChE.J., 34, 1043-1047
[7]. Zaidi, A, BenchKchou, B., Kariown, M and Akharaz, A (1990 a) “Heat Transfer in Three-Phase Fluidized Beds with
Non-Newtonian pseudoplastic solutions”, Chem. Eng. Commun,
93, 135-146
[8]. Chiu, T.M and Ziegler, E.N (1983) “Heat Transfer in Three-Phase Fluidized beds”, AIChE.J 29, 677 [9]. Muroyama, K, Fukuma, M and
Yasunishi, A (1986) “Wall-to-bed heat transfer in liquid-solid and gas-liquid-solid fluidized beds”, Part-II : gas-liquid-solid fluidized beds Caned.J.Chem. Eng 64, 409 [10]. Suh, I.S.,Jin, G.T and Kim, S.D
(1985) “Heat transfer coefficient in Three-Phase fluidized beds”, Intl, J. Multiphase flow, 11, 255-259 [11]. Yasunishi, A.,Fuckuma, M and
co-current upflow”. J. Chem. Eng. Jap, 21. 522-528
[12]. Rao Patnaik, K.S.K.,
Subrahmaniyam, S, and Sadasiva Rao, P (1998) “Verification of correlations based on mechanistic models-Heat transfer in Three-Phase fluidized beds : Part–II” Journal of energy, heat and mass transfer, 20, 109-115 (1998) [13]. Rao Patnaik, K.S.K and Gulla E.S
(2000) “Correlation of Heat transfer coefficients in Three-Phase Fluidized beds: Part-III” Journal of energy, heat and mass transfer, 22, 177-180
[14]. Nigam K.D.P and Schumpe A (1996) “Three-Phase sparged reactors” 8 Gordon and Breach publishers SA
[15]. Li, H and A Prakash, (2001) “Survey of Heat Transfer Mechanisms in a Slurry Bubble Column” The Can. J. Chem. Eng, 79(10), 717-725
[16]. Suh I.S and Deckwar, W.D (1989) “Unified correlation of heat transfer coefficients in three-phase fluidized beds”, Chem. Eng. Sci., 44, 6, 1455-1458.