Data Dependencies in the Quantitation of Affymetrix Gene Expression Data
Jared Fox and Nik Brown
Computer Science Department, University of California Los Angeles
{jaredfox, nik}@ucla.edu
Abstract
The decision of which quantitation algorithm to use for the quantitation of Affymetrix gene expression data is often made on the class of data rather than the data itself. Despite the fact that Affymetrix gene expression data can be highly variable, it is common practice in the quantitation of microarrays for researchers to pick one quantitation algorithm and use it in all cases, believing that the choice of quantitation method doesn’t make a large impact on the outcome. However, in this paper we use correlation to show that methods for the quantitation of Affymetrix gene expression data can have very different behavior on seemingly similar data, demonstrating strong data dependencies. The existence of strong data dependencies in the quantitation of Affymetrix gene expression data suggests further work is needed to characterize the sensitivities of quantitation algorithms to various properties in raw GeneChip CEL files.
1. Introduction
The decision of which quantitation algorithm to use for the quantitation of Affymetrix gene expression data is often made on the class of data rather than the data itself. That is, once a quantitation algorithm has been shown to work well on a set of data, it is assumed to work well on that entire class of data irrespective of the context in which new data may have been generated. Affymetrix gene expression data can be generated in many contexts – it can be very noisy or very clean, it can come from highly expressing tissues or low expressing tissues, it can come from pooled samples or non-pooled samples. The raw data generated from Affymetrix GeneChips can vary quite a bit, yet it is common practice in the quantitation of microarrays to pick one quantitation algorithm and use it in all cases. In this paper we use correlation to show that methods for the quantitation of Affymetrix gene expression data can have very different behavior on
seemingly similar data. The quantitation of Affymetrix gene expression data has strong data dependencies. Two quantitation methods can give highly correlated results for one set of data and virtually uncorrelated results for another set of data. The existence of strong data dependencies in the quantitation of Affymetrix gene expression data suggests further work is needed to characterize the sensitivities of quantitation algorithms to various properties in raw GeneChip CEL files.
There are many well accepted quantitation algorithms for Affymetrix gene expression data, including MAS5 [1], PLIER [2], RMA [3], [4], DCHIP [5], [6], [7], GCRMA [8], and VSN [9]. The question is which method to use. Even though these methods use different algorithms, the intent of these algorithms is the same – to generate expression values from probe level data.
All downstream analysis, whether it is clustering, finding significant genes, building predictive models, or finding gene networks, is based on the output of methods that convert probe level data into expression values. The most common way of deciding which methods to use for a data analysis task is human experience and intuition. Researchers might read some studies on data similar to their own study and assume that the method used in the published works will behave in a very similar manner for their own data.
In this paper we demonstrate that using similar methods on similar data can give significantly different results for many Affymetrix gene expression data quantitation methods. To look at the data and method dependencies for the quantitation of Affymetrix gene expression data we used correlation to study how well methods correlate with one another when analyzing the exact same data.
data, we treated a CEL file as an exact replicate of itself, quantitated it with four different methods, and looked at the pair wise correlation scores of the methods for approximately two thousand Affymetrix gene expression arrays.
We expected that algorithms with the same intent – to generate expression values from probe level data – would have fairly comparable output but with some differences since the methods were not exactly the same. Instead, we found that the pair wise correlation score was highly dependent on both the data and the method. Results can change dramatically for many data sets simply based on the choice of method.
2. Data
The data for this project consisted of CEL files produced from 1,975 Affymetrix GeneChip Microarrays. Specifically, there were 1,131 Human Genome U133A, 352 Human Genome U133B, 241 Human Genome U95A, and 251 Mouse Genome U74Av2 arrays. The CEL files were provided by the UCLA DNA Microarray Core.
3. Methods
Each CEL file was processed with each of the following quantitation/normalization methods: DCHIP, RMA, GCRMA, VSN, MAS5, PLIER, and PLIER with Quantile normalization. All of the methods except DCHIP were executed in the statistical computing environment R via the packages provided by the Bioconductor project. DCHIP was executed as a compiled binary, compiled from the code provided by DCHIP’s author, Cheng Li. The CEL files were normalized to a normalization pool of 50 CEL files. The normalization pool remained constant for all of the CEL files in each platform. The choice of a normalizition pool is based on our experience that the output of some Affymetrix quantitation algorithms can vary quite a bit for the same array on small normalization sets but tends to become stable as the pool size gets beyond approximately 40 arrays.
After each CEL file had been processed by each of the seven quantitation/normalization methods, the
should be no biological processing noise in a comparison of a CEL file versus itself.
Each of the seven output files associated an input CEL file (one output file for each quantitation/normalization method) was correlated with each of the other six output files associated with that CEL file. The correlation score for each set of output files was generated in this same way. This generated twenty-one pair wise correlations for each of the 1,975 CEL files.
[image:2.612.317.541.230.372.2]4. Results
[image:2.612.317.539.456.599.2]Figure 1 – This graph shows a summary of all the possible pair wise combinations of correlations for all seven quantitation/normalization methods. Note that every plot containing PLIER and another method has a very large section between the first and third quartiles.
How well these two methods agree seems dependent on the data.
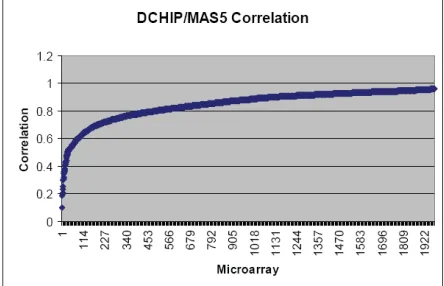
[image:3.612.317.539.313.469.2]Figure 3 - This graph shows the scores for the correlation between DCHIP/RMA, sorted by correlation score. Note the sharp change in the curve that takes place at a correlation score of about 0.7. 1,503 of the 1,976 have a correlation of 0.8 or better - which means most arrays agree pretty well between the two methods. However 3-5% of the arrays typically have almost no correlation and the particular arrays differ depending on the pair wise comparison.
Figure 4 - This graph shows the scores for the correlation between GCRMA/VSN, sorted by correlation score. GCRMA and VSN are extremely similar algorithmically and 98% of the arrays have a correlation of 0.8 or above suggesting that these are fairly interchangeable methods.
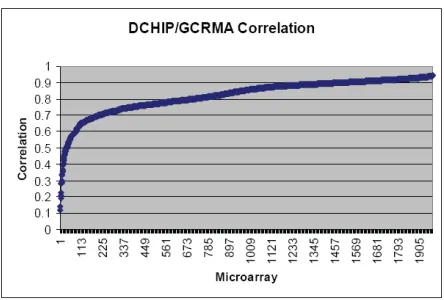
Figure 5 - This graph shows the scores for the correlation between DCHIP/GCRMA, sorted by correlation score. Nearly one-third of the arrays have a correlation of less than 0.7 suggesting that these methods can behave very differently depending on the data.
[image:3.612.73.296.387.543.2]Figure 7 - This graph shows the scores for the correlation between RMA/VSN, sorted by correlation score. GCRMA and VSN are extremely similar with only 41 of 1,976 arrays having a correlation of 0.8 or less.
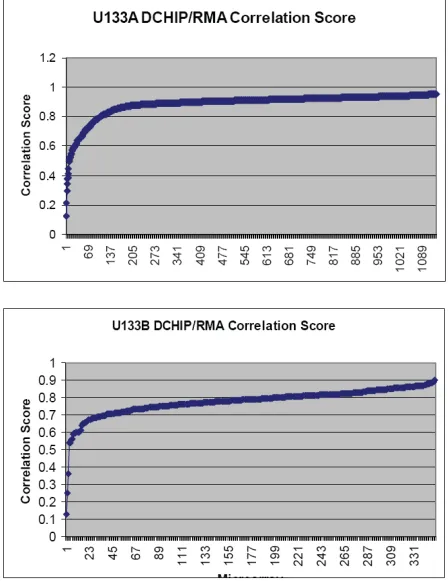
Figures 8a, 8b, and 8c – Data dependencies seem to exist in all chip types. Human Affymetrix U133A and U133B as well as Mouse U74A microarrays show similar data dependency patterns.
5. Discussion
A fundamental question for the analysis of Affymetrix gene expression data is the choice of quantitation algorithm. In this paper we demonstrate that significant data dependencies affect the output of Affymetrix quantitation methods. Widely different expression levels can be obtained from the same data depending on the choice of quantitation algorithm. We found that MAS5, DCHIP, and RMA have some differences but give very similar output on the same data. MAS5, and RMA are the most similar. We also found that PLIER can give very different results based on very similar data inputs.
Our results show that the output of RMA, MAS5, and VSN are highly related, the agreement between DCHIP, RMA, MAS5, and VSN has some differences but are still related, and PLIER is substantially different from every other method. Fig 1 shows a box-plot of all 21 pair wise comparisons side-by-side. This result demonstrates that the choice of quantitation method can give quite different results on the same data.
the differences in the quantitation algorithms a priori. Similar to checking data for the evidence of normality before using a t-test, it’s likely that some quantitation algorithms will be more appropriate according to various measurable properties of the CEL file data. For example, a quantitation algorithm that is less sensitive to noise may be more useful given very noisy data even though that method may not be as effective at finding small signals in clean data. One quantitation algorithm may work very well given a lot of data but very poorly on sparse data.
Researchers often spend many months acquiring tissue samples and many thousands of dollars for the raw materials required to generate Affymetrix gene expression data. We demonstrate in these studies that commonly used Affymetrix quantitation algorithms can give quite different results on the same data. It is disconcerting to us that published results can be dependent as much on the choice of software as to the actual data itself.
In conclusion, we recommend not relying on only a single method when analyzing gene expression data. VSN and RMA are essentially interchangeable in our analysis but the rest the methods are significantly different. Analysis should be done with either VSN or RMA as well as with DCHIP, PLIER, and MAS5. A researcher should be suspicious of genes that appear significant with one method but cannot be confirmed as significant with another method using the same post-quantitation analysis on the same data.
6. References
[1] Affymetrix (2001) “Statistical Algorithms Reference Guide”, Technical Report Affymetrix
[2] Affymetrix (2005) “Guide to Probe Logarithmic Intensity Error (PLIER) Estimation”, Technical Report Affymetrix
[3] B.M. Bolstad, R.A. Irizarry, M. Astrand, and T.P. Speed, (2003), “A Comparison of Normalization Methods for High Density Oligonucleotide Array Data Based on Bias and Variance”. Bioinformatics 19(2):185-193.
[4] R.A. Irizarry, B. Hobbs, F. Collin, Y.D. Beazer-Barclay, K.J. Antonellis, U. Scherf, T.P. Speed (2002) “Exploration, Normalization, and Summaries of High Density Oligonucleotide Array Probe Level Data” Biostatistics 4(2):249-64.
[5] C. Li and W.H. Wong (2001a) “Model-Based Analysis of Oligonucleotide Arrays: Expression Index Computation and Outlier Detection”, Proc. Natl. Acad. Sci. 98(1):31-6.
[6] C. Li and W.H. Wong (2001b) “Model-Based Analysis of Oligonucleotide Arrays: Model Validation, Design Issues and Standard Error Application”, Genome Biology 2(8).
[7] E.E. Schadt, C. Li, S.C. Cheng, W.H. Wong (2000) “Analyzing High-Density Oligonucleotide Gene Expression Array Data”, Journal of Cellular Biochemistry. 80, 192-202.
[8] Z. Wu, R.A. Irizarry, R. Gentleman, F.M. Murillo, and F. Spencer. (2004) “A Model Based Background Adjustment for Oligonucleotide Expression Arrays”. J. Am. Stat. Assoc., 99, 909–917