Combining Multiple Forms of Evidence While Filtering
Yi Zhang
∗Information System and Technology Management
School of Engineering
University of California, Santa Cruz
Santa Cruz, CA 95064, USA
[email protected]
Jamie Callan
Language Technologies Institute
School of Computer Science
Carnegie Mellon University
Pittsburgh, PA 15213, USA
[email protected]
Abstract
This paper studies how to go beyond relevance and enable a filtering system to learn more in-teresting and detailed data driven user models from multiple forms of evidence. We carry out a user study using a real time web based per-sonal news filtering system, and collect exten-sive multiple forms of evidence, including ex-plicit and imex-plicit user feedback. We explore the graphical modeling approach to combine these forms of evidence. To test whether the ap-proach can help us understand the domain bet-ter, we use graph structure learning algorithm to derive the causal relationships between dif-ferent forms of evidence. To test whether the approach can help the system improve the per-formance, we use the graphical inference algo-rithms to predict whether a user likes a docu-ment based on multiple forms of evidence. The results show that combining multiple forms of evidence using graphical models can help us better understand the filtering problem, im-prove filtering system performance, and handle various data missing situations naturally.
1
Introduction
An adaptive personal information filtering system is an autonomous agent that delivers information to the user in a dynamic environment over a period of time. A com-mon filtering approach is adapting existing text classi-fication/retrieval algorithms to classify incoming docu-ments as either relevant or non relevant using user pro-files learned from explicit user feedback on documents the user has seen. However, there are other important criteria for the user besides relevance, such as readabil-ity (Collins-Thompson and Callan, 2004), novelty (Har-man, 2003), and authority (Kleinberg, 1998). Besides, much information about the user and the document can be collected by a filtering system. These suggest a way to improve the current filtering system: going beyond rele-vance and using multiple forms of evidence.
∗
This research was done while at the Language Technolo-gies Institute, Carnegie Mellon University.
Unfortunately, there is no standard evaluation data set for this research, and there is not much work on finding a good theory to combine various forms of evidence. To solve the first problem, we designed a user study and col-lect thousands of cases with multiple forms of evidence, including the content of a document, explicit and im-plicit user feedback, such as a user’s mouse usage, key board usage, document length, novelty, relevance, read-ability, authority, user profile characteristics, news source information, and whether a user likes a document or not. Solving the second problem is very challenging. A good model should have the representation power to combine multiple forms of evidence; it should be able to help us understand the relationships between various forms of ev-idence; it should use the evidence to improve filtering system performance; and it should handle various prob-lems like missing data in an operational environment ro-bustly.
On the other hand, researchers have identified three major advantages of graphical modeling approach: 1) it provides inference tools to naturally handle situations of missing data entry because of the conditional dependen-cies encoded in the graph structure; 2) it can learn causal relationships in the domain, thus help us to understand the problem and to predict the consequences of interven-tion; and 3) it can easily combine prior knowledge (such as partial information about the causal relationship) with data in this framework. This approach has been applied to model computer software users (Horvitz et al., 1998), car drivers (Pynadath and Wellman, 1995), and students (Conati et al., 1997). Motivated by the prior work, we choose to use graphical models as our solution. To under-stand relationships between various forms of evidence, we use the causal graph structure learning algorithms (ad-vantage 2), together with some prior knowledge of the domain (advantage 3), to derive the causal relationships between different user feedback, actions and user con-text. To improve the existing filtering system, especially in the situation of missing data, we use statistical infer-ence tools to predict how a user will like a document, using information available in different missing evidence situations (advantage 1). We also try linear regression as an alternative approach.
The following sections describe our efforts towards
Figure 1: The user study system structure. The structured information, such as user feedback and crawler statistics, are kept in the database. The content of each web page crawled is saved in the news repository.
collecting data and customizing the graphical modeling approach to combine multiple forms of evidence for fil-tering. We begin with a description of the user study in Section 2, followed by some preliminary data analysis on the data collected in Section 3. Section 4 explores causal structure learning algorithm to understand the re-lationships between various forms of evidence from the data and Section 5 explores how to improve the system performance using multiple forms of evidence. Section 6 discusses related work and how this work differs from existing work, and Section 7 concludes.
2
User Study
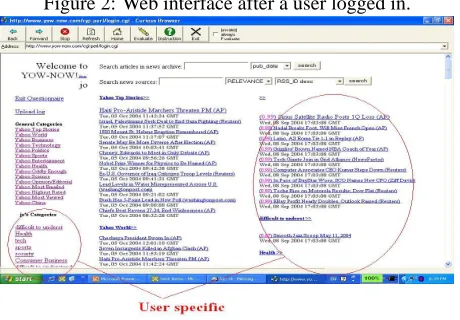
No existing filtering database contains the level of detail that we needed for our study, so we developed a web based news story filtering system to collect an evalua-tion data set (Figure 1). This system constantly gathers and recommends information to the users. The system includes a crawler with 8000 candidate RSS news feeds (Pilgrim, 2002) to crawl every day. The Lemur indexer indexes the crawled document stream incrementally, and an adaptive filtering system recommends documents to the users using a modified logistic regression algorithm (Zhang, 2004). Users read and evaluate what the system has delivered to them. An example of the web interface after user login is in Figure 2.
More than 20 paid subjects from 19 different programs at Carnegie Mellon University, who are otherwise not af-filiated with our research, participated in the study for 4 weeks. We expected to collect enough data for evalua-tion over this period of time. The subjects were required to read the news for about 1 hour per day and provide explicit feedback for each page they visited. 1 28 users
1In the last week of the study, some subjects read 2 hours
per day. They are encouraged but not required to do so.
[image:2.612.86.298.112.252.2]Figure 2: Web interface after a user logged in.
Figure 3: Evaluation user interface. The interface for user to give their explicit feedback of the current news story.
tried this system. However, only 21 users are official paid subjects, among which one worked only for 2 weeks and 20 worked for about 4 weeks.
2.1 Data collected
We have collected 7881 feedback entries from all 28 users, among which 7839 were from the 21 official par-ticipants. Each entry contains several different forms of evidence for a news story a user clicked.2 Our intention to collect the evidence is not to be exhaustive, but repre-sentative. The evidence can be roughly classified into the following five categories listed in Tables 1 to 5.3
Explicit user feedback After finishing reading a news
story, a user clicks a button on the toolbar of the browser to bring up an evaluation interface shown in Figure 3. Through this interface, the user provided the explicit feedback to tell the hidden properties about current story, including the topics the news belongs to (classes), how the user likes this news
2
Each entry is for a<document, user class, time>tuple.
3The forms of evidence are listed in the first column and we
[image:2.612.313.541.272.411.2](user likes), how relevant the news is related to the class(es) (relevant), how novel the news is (novel), whether the news matches the readability level of the user (readable), and whether the news is au-thoritative (authoritative). user likes,relevant andnovelare recorded as integers ranging from 1 (least) to 5 (most).readableandauthoritativeare recorded as 0 or 1. A user has the option to provide partial instead of all explicit feedback. A user can create new classes, and choose multiple classes for one documents.
User actions The browser adapted from (Claypool et al.,
2001) recorded some user actions, such as mouse ac-tivities, scroll bar acac-tivities, and keyboard activities (Table 2). TimeOnPage is the number of seconds the user spent on a page, and EventOnScroll is the num-ber of clicks on the scroll bars. When the mouse is out of the browser window or when the browser window is not focused, the browser does not capture any activities. More details about the actions are in (Le and Waseda, 2000).
Topic information Each participant filled out an exit
questionnaire and answered several topic/class4 spe-cific questions for each of his/her most popular 10 topics and other topics with more than 20 evalu-ated documents each (Table 3). The questions in-clude how familiar the user is with the topic be-fore the study (topic familiar bebe-fore), how the user likes this topic (topic like), and how confident the user is with respect to the answers he/she provided (topic conf idence). We include this information as evidence, because they may be collected when a topic is created and used by filtering systems. Whether collecting them in exit questionnaire af-fects the answers needs further investigation.
News Source Information For each news source (RSS
feed), we collected the number of web pages that link to it (RSS link), the number of pages that link to the server that provided it (host link), and the speed of the server that hosts it.
Content based evidence Three pieces of evidence are
collected to represent the content of each document: the relevance score, the readability score and the number of words in the document (doc len) (Table 5). To estimate the relevance score of a document, the system processes all the documents a user put into a class ordered by the feedback time and adap-tively learns a topic specific relevance model using the relevance feedback the user provided. The rel-evance score of a documents is estimated using a
[image:3.612.325.530.85.159.2]4“topic” and “class” are used interchangeably in the paper.
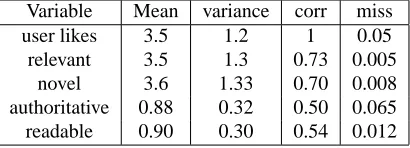
Table 1: Basic descriptive statistics about explicit feed-backs.
Variable Mean variance corr miss
user likes 3.5 1.2 1 0.05
relevant 3.5 1.3 0.73 0.005
novel 3.6 1.33 0.70 0.008
authoritative 0.88 0.32 0.50 0.065
readable 0.90 0.30 0.54 0.012
modified logistic regression model learned from all feedback before it (Zhang, 2004). To estimate the readability score of document, the system processes all the documents in all users’ classes ordered by the feedback time and adaptively learns a user indepen-dent readability model using a logistic regression al-gorithm.
3
Preliminary data analysis
The means and variances of all variables are in Tables 1 to 5. These basic descriptive statistics are very diverse. The values of some evidence may be missing; only the user actions and news source information were always col-lected. Out of the 7991 entries, only 4522 (57%) entries contain no missing value. The missing rate of each form of evidence is also reported in the tables. There are sev-eral reasons for missing data. For example, the explicit feedback is missing because users didn’t always follow instructions, the relevance score is missing for the first story in a class, and thetopic f amiliar bef orevalues for many topics are missing because we only collected the topic specific answers for larger topics. We expect missing data to be common in operational environments. The correlation coefficient between each evidence and the explicit feedback user likes is also listed (corr). The high correlation coefficients betweenuser likesand other forms of explicit feedback are not very interest-ing because we can only get explicit feedback after a user reads the document. The correlation coefficient be-tween relevance score anduser likesis 0.37, the highest among all forms of evidence that the system can get be-fore delivering a document. This is not surprising since most filtering systems only consider relevance and use relevance score to make decisions.
in-Table 2: Basic descriptive statistics about user actions. The unit for time is second.
Variable Mean variance corr
TimeOnPage 7.2×10⁴ 1.3×10⁵ 0.14
EventOnScroll 1 3.6 0.1
ClickOnWindow 0.93 2.5 0.05
TimeOnMouse 2×10³ 5.8×10³ 0.02
MSecForDownArrow 211 882 0.08
NumOfDownArrow 1.1 4.7 0.09
MSecForUpArrow 29 240 0.03
NumOfUpArrow 0.10 0.8 0.04
NumOfPageUp 0.12 0.9 '0
NumOfPageDown 0.14 1 '0
MSecForPageUp 22 202 '0
MSecForPageDown 28 251 '0
Table 3: Basic descriptive statistics about topics. Each variable ranges from 1 to 7.
variable Mean variance corr miss
topic familiar before 3.6 1.9 0.30 0.27
topic like 4.9 2.0 0.30 0.27
topic confidence 4.7 2.0 0.34 0.27
Table 4: Basic descriptive statistics about news sources.
variable Mean variance corr
RSS link 90.35 4.89 0.14
host link 4.41×10⁴ 7.5×10⁷ 0.08
RSS SPEED 3.92×10⁵ 3.7×10⁹ -0.08
Table 5: Basic descriptive statistics about documents. The length of the document does not include HTML tags.
variable mean variance corr miss
doc length 837 1.2×10³ 0.04 0.05
relevant score 0.49 0.42 0.37 0.18
readability score 0.52 0.16 0.25 0.11
formation anduser likesare weaker (Table 4). The cor-relation coefficient betweenuser likesand each user ac-tion (Table 2) is even lower (Table 1). Some acac-tions, such asT imeOnP age, are more correlated withuser likes than other refined actions, such asN umOf P ageDown. This finding agrees with (Claypool et al., 2001).
4
Understanding the domain using causal
structure learning
Correlation analysis in Section 3 has helped us to get some initial idea about the data collected. However, in order to better understand the underlying truth of the do-main, we need to go beyond correlation and uncover the causal relationships between different variables.
To do that, we first specify N nodes, one for each form of evidence to be included in the model. Then PC
algo-rithm is used (Spirtes et al., 2000) to search the causal relationships between multiple forms of evidence from the data collected. To make the search space smaller, some prior domain knowledge, such as forbidden edges, required edges or temporal tiers, can be introduced be-fore searching. In our experiments, we manually spec-ified some prior knowledge based on the first authors’ experience and intuition as the following 5-tier tempo-ral tier: 5 1) T opic inf o = (familiar topic before), RSS inf o =(RSS link, host link), document length (doc len); 2) hidden criteria, such as relevant, novel, authoritative, and readable; 3) system generated scores, such as relevance score and readability score; 4) user likes; 5) user actions, such as seconds spent on a page (TimeOnPage) or the number of clicks on the↓key (NumOfDownArrow). This informs the learning algo-rithm that→from a higher level to lower level is prohib-ited.
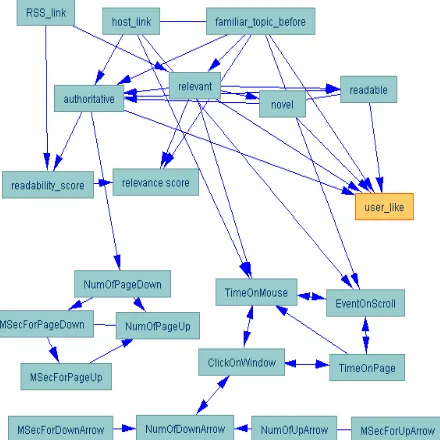
It is very encouraging to see that the structure learned automatically looks reasonable (Figure 4). Accord-ing to the graph, novel, relevant, authoritative, readabilty of a document and whether a user is familiar with the topic before using the system (f amilar topic bef ore) are direct causes of the user’s preference for a document (user likes) . How fa-miliar with this topic a user is before participating the study (topic f amiliar bef ore) and the number of web links to the news source (RSS link) directly af-fect the user’s relevant and authoritative feedback and readability score. Relevant, authoritative, f amiliar topic bef oreandhost linkinfluence a user’s actions, such as theEventOnScroll.
Comparing Tables 2 to 5 with Figure 4, one may ask why some variables are correlated with user likes al-though there is no direct links between them and user
likes. For example, why the correlation between rele-vance score and user likes is 0.39, while there is no
di-rect link between them. Does Figure 4 contradict Ta-ble 5? The answer is “no”. In fact the indirect causal relationship between them tells us why relevance score and user likes are correlated: relevance score and user
likes have a common cause relevant. Most of the
re-fined actions, such as the number of pressing page up key (N umOf P ageU p), are far away fromuser likes. This implies that these refined actions are not very informative if we want to use the learned model to predict whether a user likes a document or not. This finding agree with (Claypool et al., 2001) and Table 2.
The node authoritative is directly linked to readability score and host link. The link between host link andauthoritativeconfirms the existing ap-proaches that use the web link structure to estimate the
[image:4.612.72.301.87.243.2]Figure 4: User independent causal graphical structure learned using PC algorithm. X → Y means X is a di-rect cause of Y.X−Y means the algorithm cannot tell if X causes Y or if Y causes X.X ←→Y means the algo-rithm found some problem, which may happen due to a latent common cause of X and Y, a chance pattern in the sample, or other violations of assumptions.
Figure 5: Structure of GM complete.
Figure 6: Structure of GM causal.
authority of a page (Kleinberg, 1998). The links between readability score,readableandauthoritativeare very interesting. They suggest the difficulty to understand a page may make the user feel it is not authoritative. Fur-ther investigation shows that although the percentage of un-authoritative news is less than15%in general, among the 187 news stories some users identified as “difficult” using class labels,73%were also rated as not authorita-tive. Besides some successful web page authority algo-rithms that only use hyper links, the estimation of author-ity may be further improved using the content of a page.
There are links among relevant, novel, readable and
authoritative. Although the algorithm failed to tell the
causal direction between some pairs of variables, it sug-gests that the four variables influence each other. This may be an inherent property of the document; or because a user is likely to rate one aspect of the document higher than he/she should if the other aspects are good.
One may ask why the structure in Figure 4 contains no link betweenreadableandreadability score, since intuitively it should exist. To answer this question, one needs to understand that the causal relationships learned automatically are what the algorithm “believes” based on the evidence of the data, the assumptions it makes, and the prior constraints we engineered. They may have er-rors, because the data is noisy, or the assumptions and the prior constraints may be wrong. For example, the PC algorithm do statistical test about the independence re-lationships among variables using the data and the final results are subject to the error of the statistical test. The PC algorithm assumes no hidden variables, however be-sides relevant, novel, authoritative, and readable, other hidden variables, such as whether a document is
up-to-date, interesting, misleading, etc. (Schamber and
Bate-man, 1996), may exist and influence a user’s preference for a document. Thus it is not surprising that some of the causal relationships, such as the link betweenreadable andreadability score, are missed in the final graph be-cause of the limitation of the learning algorithms. The model learned only sheds some light on the relationships between the variables instead of uncovering the whole truth. It only serves as a starting point for us. To further understand the domain, we may want to break down some variables in the current graph further and relate them to either the user or document properties. In general, causal discovery is inherently difficult and far from solved.
5
Improving system performance using
inference algorithms
graphical models can improve system performance, we evaluate the proposed solution on the task of predicting user likeswhile filtering.
To predict user likes, the system needs to learn a graphical model: the combination of a graph structure and a set of local conditional probability functions or po-tential functions. Doing inference over the causal struc-ture learned in the previous section is difficult because of the circles and a mixture of directed and undirected links on the graph. So, we tried the following directed acyclic graphical models.
GM complete, an almost complete Bayesian network:
In this graph, we order the nodes from top to bot-tom, and the parents of a node are all the nodes above it, such as in Figure 5. For this structure, the order of the nodes is not very important when using Gaussian distributions.
GM causal, a graphical model inspired by causal models:
We manually modify the causal structure in Figure 4 to make it a directed acyclic graph as in Figure 6.
In the graphs, RSS info=(RSS link, host link) and Topic
info=topic familiar before, topic like) are 2 dimensional
vectors representing the information about the news source and the topic in Table 4 and Table 3. actions = (T imeOnP age, ...) is a 12 dimensional vector repre-senting the user actions in Table 1. user likes is the target variable the system wants to predict.
Before learning the parameters of the model, we need to choose a specific conditional form for the probability function associated with each node. We chose Gaussian distributions. If the parents of node X are Y,P(X|Y) =
N(m+W ×Y,Σ), whereN(µ,Σ)is a gaussian distri-bution with mean µand covariance Σ. This is a com-monly used distribution for continuous valued nodes. It assumes the joint distribution of these variables is mul-tivariate Gaussian, which may be wrong. Nevertheless, because of the mathematical convenience, the existence of efficient learning and inference algorithms for Gaus-sian networks, and the availability of modeling tools, we chose this distribution. Using the BNT Toolbox (Mur-phy, 2001), the maximum likelihood estimations of the parameters(m, W,Σ)were learned using EM algorithm and junction tree inference engine(Cowell et al., 1999) over the graphical models, with whatever information was available on the first2/3of the data.
[image:6.612.315.539.53.219.2]An alternative approach to combine multiple forms of evidence is linear regression. We tried two special meth-ods to solve the missing evidence problem while using linear regression: 1) building a model that does not use the evidence that is missing for each missing situation (LR different); or 2)mean substitution: replacing each missing value for an evidence with the average of the
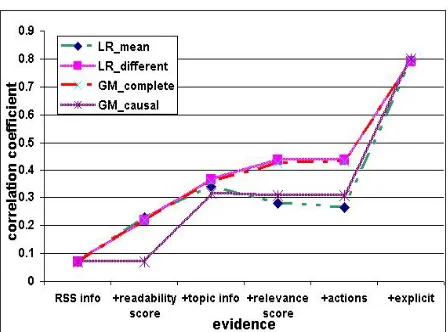
Figure 7: Comparison of the prediction power of differ-ent models using 7952 cases for evaluation. The vertical axis is the correlation coefficient between the predicted value ofuser likesusing the model and the true explicit feedback provided by the users. The order of different forms of evidence is set manually, based on how easy it is to collect each evidence.
observed evidence (LR mean). For K different forms of evidence, the system may need to handle2K differ-ent evidence missing situations. A large number of linear regression models need to be learned if we use the first approach, considering K is higher than 15 in some of our experiments. Building215models is almost impossible
for us, so a heuristic approach, which is discussed later, was used to make the experiments possible.
Not all 7991 cases collected in the user study were used in the experiments. We conducted two sets of ex-periments. For the first set of experiments, we use 7952 cases for whichuser likesis not missing. For the other set of runs, we use only cases without missing value. In this task, the value of each variable is continuous and nor-malized to variance one. Each model is learned using all information available on the first 2/3 of the cases, and tested on the remaining1/3of the cases. The correlation coefficient between the predicted value ofuser likesand the true explicit user likes feedback provided by the users is used as the evaluation measure. Our baseline is usingrelevance scorealone, which has a correlation co-efficient of 0.367 with 95% confidence interval 0.33-0.40 on the last 1/3 of the 7952 cases.
5.1 Experimental results and discussions
value ofuser likes only given the value ofRSS inf o at testing time. “+explicit” means the explicit feed-back (exceptuser likes) about the current document is given besides the value of actions, relevance score, readability score, RSS inf o, and T opicInf o. The graphical models andLR meanmodel were trained with all evidence/features, and the learned models are inde-pendent of the testing condition. LR different models were only trained with features that are also provided at testing time, so there is one model per testing condition. 6
The results show that GM completeperforms sim-ilarly to LR different. This is not surprising. Theo-retically, if there is no missing entries in training data, GM complete’s estimation of the conditional distribu-tion ofP(user likes|available evidence)would be the same as that of LR different on a testing case with miss-ing evidence.
Comparing the correlation coefficients under dif-ferent testing conditions when using LR difdif-ferent or GM complete, we can see that as more forms of ev-idence are available, the performance improves. If only the news source information of a document (RSS inf o) is given, all models perform poorly. The readability scoreimproves the system performance sig-nificantly. This is nice and interesting, because the evi-dence is user independent and can be estimated efficiently for each document. The performance keeps improving as topic inf o and relevance score were added. To collect them, we needs user feedback on previous doc-uments. The performance improvement is not very ob-vious withactionsadded. This means that given other evidence (RSS inf o,topic inf o,relevance scoreand readability score), the system won’t improve its predic-tion of the document much by observing these acpredic-tions. However, this is only true when we use a model learned for all users and other forms of evidence are available. It does not mean the actions are useless if we learn user specific model, or if other forms of evidence (such as relevance score) are not available. All models perform very good with explicit feedback added. However, this is a “cheating” condition of less interest to us.
The performances of LR mean and GM causal do not increase monotonically as more forms of ev-idence are added. They perform much worse than
LR different andGM complete. Why does a structure that looks more causally reasonable not perform well
6
However, for a specific testing condition, the training data and testing data contain cases where some evidence that is sup-posed to be available is missing. These cases in training data were ignored and not used to learn aLR dif f erentmodel. However, ignoring such kind of cases in testing data makes comparison of different runs difficult. So we used mean sub-stitution approach to fill the required missing features in testing data while usingLR dif f erent.
Model Cond. corr RLow RUp
LR mean +R 0.2783 0.2426 0.3132
LR different +R 0.4372 0.4058 0.4677
GM complete +R 0.4247 0.3928 0.4555
GM causal +R 0.3078 0.2728 0.342
LR mean +A 0.2646 0.2286 0.2998
LR different +A 0.4375 0.406 0.4679
GM complete +A 0.4315 0.3999 0.4622
[image:7.612.315.540.53.163.2]GM causal +A 0.3086 0.2736 0.3428
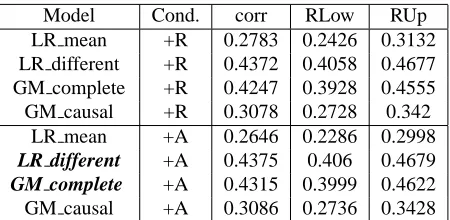
Table 6: A comparison of different models on all data un-der the+relevance score(+R) and+action(+A) con-ditions. Corr is the correlation coefficient between the predicted value of user likes using the model and the true explicit feedback provided by the users. RLO and RUP are the lower and upper bounds for a 95% confi-dence interval for each coefficient.
as the simple GM complete? We may answer this question better by comparing the underlying assumptions of these algorithms. GM complete only assumes the joint distribution of all variables is multivariate Gaus-sian. GM causalmakes much stronger independence assumptions by removing some links between variables. As mentioned before, the causal relationships learned au-tomatically are not perfect, which may cause the poor performance of GM causal. LR mean also suffers from the strong conditional independent assumptions.
Table 6 reports the performance together with the confidence intervals of all the models under the
+relevance score and +actions conditions. Under both conditions, GM complete and LR different are statistically significantly better than the baseline 0.367. LR meanand GM causalare significantly worse. It means using multiple forms of evidence may hurt some models and benefit others. Further analysis about the
+actionsruns shows thatLR meangave explicit
feed-back too much weight and overlooked other less strong
evidence. At testing time, it did not handle the problem of missing explicit feedback well and thus performed poorly. AlthoughGM completealso gave very high weights to
explicit feedback, it could infer the missing values based
Model Cond. Corr RLow RUp
LR mean +R 0.13 0.08 0.18
LR different +R 0.41 0.37 0.45
GM complete +R 0.41 0.37 0.45
GM causal +R 0.41 0.375 0.45
LR mean +A 0.11 0.061 0.16
LR different +A 0.42 0.38 0.46
GM complete +A 0.42 0.38 0.46
[image:8.612.82.290.53.164.2]GM causal +A 0.38 0.33 0.42
Table 7: The performance on 4522 no missing value cases under the +relevance score (+R) and +action (+A) conditions.
different evidence missing combinations, and2K linear regression models are needed in order to handle all these situations using LR different approach. LR different may be preferred if K is small, while graphical modeling us-ingGM completemay be a better approach to handle different data missing situations if K is big.
So far, all results are based on 7952 cases where some evidence may be missing. We also compared the models under different testing conditions using the 4522 cases that do not have any missing value (Table 7). GM causalperforms significantly better than be-fore. We need to be very careful with the structures while using the graphical modeling approach, since a structure that looks more reasonable may work poorly on the in-ference task. However, we couldn’t not draw any con-clusion on whether GM completeis better in general, because the answer may be different with different con-ditional probability distributions, different data sets, or a better structure learning algorithm.
6
Related Work
There has been some research on news filtering using time-coded implicit feedback (Lang, 1995; Morita and Shinoda, 1994). We noticed that an independent work uses a different graphical modeling approach, depen-dency network, to understand the relationships between implicit measures and explicit satisfaction while user were conducting their web searches and viewing results, and then uses decision tree to predict user satisfaction with results (Fox et al., 2005). Our work differs from the previous work in the goal of the task, the range of ev-idence considered, the modeling approach we took, and the findings reached.
There has been a lot of related research on using im-plicit feedback (Kelly and Teevan, 2003). The user actions we collected are based on (Claypool et al., 2001). There is much work about how to handle miss-ing data. (Schafer and Graham, 2002) discussed several approaches such as case deletion, mean substitution, and
recommended maximum likelihood (ML) and Bayesian multiple imputation (MI).LR meanuses mean substitu-tion, LR different uses case delesubstitu-tion, and graphical mod-els follow the ML approach.
There has been some research on criteria beyond topic relevance (Carbonell and Goldstein, 1998) (Zhang et al., 2002) (Collins-Thompson and Callan, 2004) (Kleinberg, 1998). (Schamber and Bateman, 1996) identified crite-ria underlying users’ relevance judgements and explored how users employed the criteria in making evaluations by asking users to interpret and sort criteria independent of document manually. In the literature, the word “rele-vant” is used ambiguously, either as a narrow definition of “related to the matter at hand (aboutness)” or a broader definition of “having the ability to satisfy the needs of the user”. When it is used by the second definition, such as in (Schamber and Bateman, 1996), researchers are usu-ally studying what we refer to as user likes. In this paper, we use “relevant” as is defined in the first definition and use the phrase “user likes” for the second definition. De-spite the vocabulary difference, our work is motivated by the early research. The major contributions of our work in this area are: 1) we model the user likes and other cri-teria as hidden variables; 2) we quantify the importance of various criteria based on probabilistic reasoning; and 3) we have explored the new methodology for combining these criteria with implicit and explicit user feedback.
7
CONCLUSION
We have explored how to combine multiple forms of evi-dence using the graphical modeling approach. This work is significant because it addresses some long-standing is-sues in the adaptive information filtering community: the integration of a wider range of specific and user-independent evidence, and handling situations like miss-ing data that occur in operational environments.
We have analyzed the user study data using graphical models, as well as linear regression algorithms. The ex-perimental results show that the graphical modeling ap-proach can help us to understand the causal relationships between multiple forms of evidence in the domain and explain the real world scenario better. It can also help the filtering system to predict user preference more accu-rately with multiple forms of evidence compared to using a relevance model only.
of evidence is few, LR different probably is preferable because of the simplicity. However, as more forms of evidence are added, a more powerful model, such as GM complete, may be preferred because of the com-putation and space efficiency.
We only collected data for documents users clicked. Further investigation is needed to look at data not clicked, which is a critical step to see whether the improvement on prediction accuracy of user preference will help the sys-tem serve the user better in a real syssys-tem. This is the first step towards using graphical models to combine multiple forms of evidence while filtering. The proposed solution, especially the data analyzing methodology used in this paper, can also be used in other IR tasks besides filtering, such as context-based retrieval.
8
Acknowledgments
We thank Jaime Carbonell, Tom Minka, Stephen Robert-son, Yiming Yang, Wei Xu, Peter Spirtes, Diane Kelley, Paul Ogilvie, Kevyn Collins-Thompson, Luo Si, Joemon Jose for valuable discussions about the work described in this paper.
This research was funded in part by a fellowship from IBM and a grant from National Science Foundation. Any opinions, findings, conclusions or recommendations ex-pressed in this paper are the authors’, and do not neces-sarily reflect those of the sponsors.
References
Jaime Carbonell and Jade Goldstein. 1998. The use of MMR, diversity-based reranking for reordering docu-ments and producing summaries. In Proceedings of
the 21st annual international ACM SIGIR conference.
Mark Claypool, Phong Le, Makoto Wased, and David Brown. 2001. Implicit interest indicators. In
Intel-ligent User Interfaces.
K. Collins-Thompson and J. Callan. 2004. A language modeling approach to predicting reading difficulty. In
Proceedings of the HLT/NAACL 2004 Conference.
C. Conati, A. S. Gertner, K. VanLehn, and M. J. Druzdzel. 1997. On-line student modeling for coached problem solving using Bayesian networks. In
Proceedings of the Sixth International Conference on User Modeling, pages 231–242.
Robert G. Cowell, A. Philip Dawid, Steffen L. Lauritzen, and David J. Spiegelhalter. 1999. Probabilistic
Net-works and Expert Systems. Springer.
Steve Fox, Kuldeep Karnawat, Mark Mydland, Susan Dumais, and Thomas White. 2005. Evaluating im-plicit measures to improve web search. In ACM Trans.
Information Systems, volume 23.
Donna Harman. 2003. Overview of the TREC 2002 nov-elty track. In The Eleventh Text REtrieval Conference
(TREC-11). NIST 500-251.
E. Horvitz, J. Breese, D. Heckerman, D. Hovel, and K. Rommelse. 1998. The Lumiere project: Bayesian user modeling for inferring the goals and needs of soft-ware users. In Proceedings of the Fourteenth
Confer-ence on Uncertainty in Artificial IntelligConfer-ence, July.
Diane Kelly and Jaime Teevan. 2003. Implicit feedback for inferring user preference: a bibliography. SIGIR
Forum, 37(2):18–28.
J. Kleinberg. 1998. Authoritative sources in a hyper-linked environment. In Proc. 9th ACM-SIAM
Sympo-sium on Discrete Algorithms.
Ken Lang. 1995. Newsweeder: Learning to filter news. In Proceedings of the Twelfth International Conference
on Machine Learning.
Phong Le and Makoto Waseda. 2000. A curious browser: Implicit ratings. http://www.cs.wpi.edu/ clay-pool/mqp/iii/.
Masahiro Morita and Yoichi Shinoda. 1994. Informa-tion filtering based on user behavior analysis and best match text retrieval. In Proceedings of the 17th ACM
SIGIR conference.
Kevyn Murphy. 2001. The Bayes net toolbox for matlab. In Computing Science and Statistics.
Mark Pilgrim. 2002. What is RSS.
http://www.xml.com/pub/a/2002/12/18/dive-into-xml.html.
D.V. Pynadath and W.P. Wellman. 1995. Accounting for context in plan recognition, with application to traffic monitoring. In Proceedings of the Eleventh
Confer-ence on Uncertainty in Artificial IntelligConfer-ence.
Joseph L. Schafer and John W. Graham. 2002. Missing data: Our view of the state of art. In Psychological
Methods, volume 7, No 2.
Linda Schamber and Judy Bateman. 1996. User crite-ria in relevance evaluation: Toward development of a measurement scale. In ASIS 1996 Annual Conference
Proceedings, October.
Perter Spirtes, Clark Glymour, and Richard Scheines. 2000. Causation, Prediction, and Search. The MIT Press.
Yi Zhang, Jamie Callan, and Tom Minka. 2002. Novelty and redundancy detection in adaptive filtering. In
Pro-ceedings of the 25th Annual International ACM SIGIR Conference.
Yi Zhang. 2004. Using Bayesian priors to combine clas-sifiers for adaptive filtering. In Proceedings of the 27th