The origins of post-starburst galaxies at
z <
0
.
05
.
M. M. Pawlik
1, L. Taj Aldeen
1,2, V. Wild
1, J. Mendez-Abreu
1,3,4, N. Lah´
en
5,
P. H. Johansson
5, N. Jimenez
1,6, W. Lucas
1, Y. Zheng
1, C. J. Walcher
7and K. Rowlands
1,81School of Physics and Astronomy, University of St Andrews, North Haugh, St Andrews, KY16 9SS, U.K. (SUPA) 2Department of Physics, College of Science, University of Babylon, Hillah , Babylon, Iraq
3Instituto de Astrof´ısica de Canarias C/ V´ıa L´actea, s/n E38205 - La Laguna (Tenerife), Spain
4Departamento de Astrof´ısica, Universidad de La Laguna, Calle Astrof´ısico Francisco S´anchez s/n, E-38205 La Laguna, Tenerife, Spain 5Department of Physics, University of Helsinki, Gustaf H¨allstr¨omin katu 2a, FI-00014 Helsinki, Finland
6Unbound, Unit 18, Waterside, 44-48 Wharf Road, London N1 7UX, UK
7Leibniz-Institut f¨ur Astrophysik Potsdam (AIP), An der Sternwarte 16, D-14482 Potsdam, Germany
8Department of Physics&Astronomy, Johns Hopkins University, Bloomberg Center, 3400 N. Charles St., Baltimore, MD 21218, USA
ABSTRACT
Post-starburst galaxies can be identified via the presence of prominent Hydrogen Balmer absorption lines in their spectra. We present a comprehensive study of the origin of strong Balmer lines in a volume-limited sample of 189 galaxies with 0.01< z < 0.05, log(M?/M) >9.5 and projected axis ratiob/a > 0.32. We explore their
structural properties, environments, emission lines and star formation histories, and compare them to control samples of star-forming and quiescent galaxies, and simulated galaxy mergers. Excluding contaminants, in which the strong Balmer lines are most likely caused by dust-star geometry, we find evidence for three different pathways through the post-starburst phase, with most events occurring in intermediate-density environments: (1) a significant disruptive event, such as a gas-rich major merger, causing a starburst and growth of a spheroidal component, followed by quenching of the star formation (70% of post-starburst galaxies at 9.5 < log(M?/M) < 10.5
and 60% at log(M?/M) >10.5); (2) at 9.5 <log(M?/M) < 10.5, stochastic star
formation in blue-sequence galaxies, causing a weak burst and subsequent return to the blue sequence (30%); (3) at log(M?/M)>10.5, cyclic evolution of quiescent galaxies
which gradually move towards the high-mass end of the red sequence through weak starbursts, possibly as a result of a merger with a smaller gas-rich companion (40%). Our analysis suggests that AGN are ‘on’ for 50% of the duration of the post-starburst phase, meaning that traditional samples of post-starburst galaxies with strict emission line cuts will be at least 50% incomplete due to the exclusion of narrow-line AGN.
Key words: galaxies:evolution, galaxies:stellar content, galaxies:structure, galax-ies:starburst, galaxies:interactions
1 INTRODUCTION
About one percent of the local galaxies within the Sloan Digital Sky Survey (SDSS) have optical spectra featuring unusually strong Balmer lines in absorption accompanied by weak emission lines (Goto et al. 2008; Wong et al. 2012). Such features have been interpreted as a signature of a rapid decrease in the star-formation activity, likely following a re-cent starburst (Dressler & Gunn 1983; Nolan, Raychaud-hury & Kab´an 2007; Balogh et al. 2005; Wild et al. 2007; von der Linden et al. 2010). In this picture, shortly after the starburst, the balance of the newly born stars in a galaxy
between the star-forming blue cloud and the quiescent red sequence. As such, they offer a unique insight into galaxy evolution and may provide a means of constraining the ori-gin of the bimodality in the population of massive galaxies: blue star-forming gas-rich systems with prominent disks and ‘red and dead’ gas-poor spheroids (e.g. Strateva et al. 2001; Kauffmann et al. 2003b; Bell et al. 2004; Baldry et al. 2004, 2006; Bundy, Ellis & Conselice 2005).
The evolutionary scenario in which galaxies migrate from the blue cloud over to the red sequence is supported by observations which reveal that the stellar mass and num-ber density of galaxies on the red sequence has doubled since z ∼ 1, during which time the mass density of the blue cloud has remained nearly constant (see e.g. Bell et al. 2004; Arnouts et al. 2007; Faber et al. 2007). The phys-ical processes governing this transition have not yet been determined and it is unlikely that all star-forming galaxies follow the same pathway to the red sequence. The evolu-tionary path of a galaxy may be determined by a number of factors, such as its mass and structural properties or its environment. As argued by Peng et al. (2010), more mas-sive galaxies are more likely to become quiescent regard-less of what environment they reside in (‘internal’ or ‘mass quenching’) and galaxies in denser environments are more likely to quench their star formation independent of their stellar mass (‘external’ or ‘environmental quenching’). Nu-merous observations reveal that the build up of the low-mass end of the red-sequence occurs at later times in the history of the Universe than that of the high-mass end (e.g. March-esini et al. 2009; Moustakas et al. 2013; Muzzin et al. 2013), which may simply be related to the fact that the star for-mation rate of low-mass galaxies declines more slowly than high-mass galaxies (e.g Asari et al. 2007), or may indicate that quenching events are occurring at later cosmic times for low mass galaxies.
A popular candidate for the internal quenching mech-anism in massive galaxies is feedback from the accreting supermassive black hole (active galactic nucleus, AGN) fu-eled by, e.g. disk instabilities (Bournaud et al. 2011) or a central bar (Knapen, Shlosman & Peletier 2000), that can halt the star formation activity by modifying the interstel-lar gas conditions or expelling it in powerful galactic winds. External quenching may be driven by a variety of processes depending on the galaxy’s immediate environment. In dense galaxy clusters these include: ram-pressure stripping of the cold interstellar medium (Gunn & Gott 1972), the removal of the hot gas halo or ‘strangulation’ (Larson, Tinsley & Caldwell 1980; Balogh & Morris 2000) or fast encounters with other galaxies also known as ‘harassment’ (Gallagher & Ostriker 1972; Moore, Lake & Katz 1998). In less dense en-vironments it is more likely caused by galaxy mergers which can destroy disks in star-forming galaxies leading to mor-phologically and kinematically disturbed remnants that over time relax to a state characteristic of the red-sequence pop-ulation (e.g Barnes 1992; Naab & Burkert 2003; Bournaud, Jog & Combes 2005). Mergers of gas-rich galaxies can lead to powerful centralised starbursts followed by quenching of the star-formation, possibly also related to the AGN feedback on the interstellar medium (e.g. Sanders et al. 1988; Hop-kins et al. 2006; Johansson, Naab & Burkert 2009a). Alter-natively quenching may occur without the presence of AGN feedback as once a galaxy acquires a spheroid-dominated
morphology it can shut off its star-formation and turn red due to disk stabilisation against gas clouds fragmentation (‘morphological quenching’, Martig et al. 2009). Discrimi-nating between the different mechanisms driving the evolu-tion of galaxies from blue to red is not trivial, especially since their relative importance is unlikely to have been constant over cosmic time.
It is clear that a single class of galaxies will not hold the answers to all questions regarding the complex picture of galaxy evolution but building up our knowledge about the galaxies caught in transition between the main evolution-ary stages, such as post-starburst galaxies, is a step in the right direction. One of the main challenges in studying post-starburst galaxies, perhaps apart from their scarcity, is the large diversity of selection criteria used in the literature. In what follows, we review the different selection methods, the corresponding post-starburst sample properties, and conclu-sions about their origin and importance for galaxy evolution.
1.1 Quiescent post-starburst galaxies
The first observation of post-starburst galaxies or ‘K+A’ galaxies (here,quiescent post-starburst galaxies) goes back to the early 1980s (Dressler & Gunn 1983), when they were found in distant galaxy clusters (0.3 < z < 0.6). Further observations showed that at these intermediate redshifts ‘K+A’ galaxies reside preferentially in such high density environments (see e.g. Poggianti et al. 2009 and the ref-erences therein). Morphological analysis of their optical im-ages revealed that they are predominantly disk-dominated systems, some of which are interacting or obviously dis-turbed (e.g. Couch et al. 1994, 1998; Dressler et al. 1994; Oemler, Dressler & Butcher 1997; Caldwell & Rose 1997; Dressler et al. 1999). Evidence of disk-like structures was also found in the kinematics of some cluster post-starburst galaxies, e.g. by Franx (1993) or, more recently, in integral-field spectroscopic observations where kinematical configu-rations characteristic of fast rotators (Emsellem et al. 2007) were found in over 80% of the studied cluster post-starburst galaxies (Pracy et al. 2009; Swinbank et al. 2012; Pracy et al. 2013). The proposed mechanisms for the origin of ‘K+A’ galaxies in dense environments include perturbations due to the cluster tidal field (Byrd & Valtonen 1990), repeated en-counters with other galaxies - ‘harassment’ - (Moore et al. 1996; Moore, Lake & Katz 1998) which could induce distur-bance in galaxy morphology, or interactions with the intra-cluster medium of newly infalling galaxies to the intra-cluster (Gunn & Gott 1972), leaving the stellar morphology undis-turbed and possibly explaining the high incidence of disks in the galaxy samples. It has also been suggested (see e.g. Poggianti et al. 1999; Tran et al. 2003) that intermediate-redshift cluster post-starburst galaxies could be the progen-itors of S0 galaxies that dominate the cores of present-day clusters, therefore playing a significant role in the evolution of the star-forming galaxy fraction in clusters over cosmic time (Butcher-Oemler effect, Butcher & Oemler 1984).
et al. 2004; Hogg et al. 2006; Yang et al. 2008; Yan et al. 2009; Goto 2007). A connection to mergers is also revealed in the morphology and structural properties of many quies-cent post-starburst galaxies, although the outcomes of differ-ent studies are quantitatively diverse. Morphological distur-bance signifying an ongoing or past merger has been found in between 15% and 70% of cases, depending on selection criteria and image quality (e.g. Zabludoff et al. 1996; Goto 2005; Yang et al. 2008; Pracy et al. 2009; Trouille et al. 2013). Many studies have reported a high incidence of bulge-dominated early-type morphologies and steep light profiles with high central concentration in post-starburst samples (e.g. Goto 2005; Quintero et al. 2004; Tran et al. 2004; Blake et al. 2004; Poggianti et al. 2009; Mendel et al. 2013), char-acteristics typical of red-sequence galaxies and also consis-tent with merger remnants seen in numerical simulations (e.g Toomre & Toomre 1972; Barnes 1988; Naab & Burk-ert 2003). Evidence for a merger origin has also been found in spatially-resolved studies of some post-starburst galaxies, which revealed centrally concentrated A/F stellar popula-tions (Pracy et al. 2012; Swinbank et al. 2011; Whitaker et al. 2012), in agreement with expectations of gas inflows to the centre of the merger seen in simulations.
Despite the diversity in the findings regarding the prop-erties of the ‘K+A’ galaxies, many studies agree that they are likely transitioning between the blue cloud and the red sequence, both in clusters and in the field. Many lie in the ‘green valley’ of colour-magnitude diagrams (e.g. Wong et al. 2012). Tran et al. (2004) estimated that ∼25% of passive galaxies in the local field underwent a ‘K+A’ phase atz <1 (increasing to 70% if only early morphological types are con-sidered) and Whitaker et al. (2012) argued that their num-ber density evolution of the ‘K+A’ and red-sequence galax-ies is consistent with all qugalax-iescent galaxgalax-ies experiencing a ‘K+A’ phase at z > 1. However, other studies present a contrasting view of the role of post-starburst galaxies in the red-sequence growth. Reservoirs of both neutral and molecular gas have been found in over half of the inves-tigated post-starburst galaxies (Chang et al. 2001; Buyle et al. 2006; Zwaan et al. 2013; French et al. 2015), meaning that these galaxies are not yet devoid of fuel for star for-mation (although such conclusions are still limited to small samples). Furthermore, the low incidence of ‘K+A’ galax-ies in two clusters at z ∼ 0.5 found by De Lucia et al. (2009) seems insufficient to represent a dominant channel for the formation of red sequence galaxies. A similar conclu-sion was arrived at by Dressler et al. (2013), who proposed that the majority of the ‘K+A’ galaxies in both clusters and the field at 0.3< z <0.54 represent a phase in an evo-lutionary cycle within the red sequence, where an already quiescent galaxy accretes a smaller gas-rich companion and passes through a brief post-starburst phase before returning to the red sequence. This was also supported by a morpho-logical analysis of the sample by Abramson et al. (2013). At somewhat higher redshifts (0.47< z < 1.2) Vergani et al. (2010) concluded that a variety of processes could lead to the post-starburst phase and that this channel provides a non-negligible contribution to the red sequence growth, al-though not higher than∼10%.
1.2 Transitioning post-starburst galaxies
All the studies mentioned above relate to post-starburst galaxies in which the star-formation has effectively been quenched, selected based on the lack of measurable nebular emission, usually the [OII] line (e.g., Dressler & Gunn 1983; Zabludoff et al. 1996; Poggianti et al. 1999) orHαline (e.g., Goto et al. 2003; Quintero et al. 2004; Balogh et al. 2005). However, a starburst is not an instantaneous event and, in fact, gas-rich merger simulations (which do not include sig-nificant AGN feedback) point to ongoing star-formation for several hundreds of Myr following the initial starburst (see e.g. Hopkins et al. 2006; Wild et al. 2009). It is therefore reasonable to expect some levels of star-formation to be vis-ible for a while after the onset of the starburst. In light of this, one problem with the traditional definition of post-starburst galaxies is that the strict cut on emission lines excludes galaxies in the early transition stage between star-burst and quiescence. This early phase is important because the characteristics of the transitioning galaxies may con-tain information about the event that triggered the transfor-mation and processes occurring during the transition, and these characteristics may fade by the time the galaxy en-ters the ‘K+A’ phase. For example, Tremonti, Moustakas & Diamond-Stanic (2007) measured high velocity outflows in very young (75-300 Myr) post-starburst galaxies which ap-pear to be caused by extreme starbursts rather than AGN as originally postulated Sell et al. (2014). Moreover, the strict cut on nebular emission lines in the traditional ap-proach does not allow for selection of galaxies with ionisation mechanisms other than star-formation, e.g. AGN or shocks, leading to incomplete samples of post-starburst galaxies(see also Wilkinson, Pimbblet & Stott 2017). More recent stud-ies turned their focus to an alternative broader definition of post-starburst galaxies, in which the condition of quies-cence is relaxed. These studies, (examples discussed below), revealed the existence of galaxies whose optical spectra fea-ture both strong Balmer absorption lines as well as nebular emission lines on a measurable level.
However, it is important to note that the nature of galax-ies with both strong Balmer lines in absorption and nebu-lar emission lines is still under debate. One of the popu-lar interpretations is that emission-line spectra with strong Balmer absorption, known ase(a) spectra, indicate an ongo-ingstarburst with the youngest stellar populations obscured by dust (Dressler et al. 1999; Poggianti et al. 1999). This is supported by some observations which reveal that such spectral characteristics are more common among dusty star-bursts and luminous infrared galaxies compared to normal star-forming galaxies (Liu & Kennicutt 1995; Smail et al. 1999; Poggianti & Wu 2000). Some studies have suggested that these ongoing dusty starbursts may be the progenitors of some quiescent post-starburst galaxies (Poggianti et al. 1999; Balogh et al. 2005).
of the continuum around 4000˚A and the relative strength of Balmer absorption lines to identify post-starburst galaxies without placing a cut on their emission-lines. They selected a sample of 400 local galaxies whose spectral characteristics place them on an evolutionary sequence stretching over 600 Myr following the starburst and, from the decay in theHα
emission, they found a characteristic star-formation decline timescale of ∼ 300 Myr in broad agreement with merger simulations. A morphological analysis of the images of these post-starburst galaxies revealed the presence of asymmet-ric faint tidal features in the outskirts of about half of the youngest subset (tSB<100 Myr) and a clear decline in the incidence and asymmetry of such features with the star-burst age over the following 500 Myr (Pawlik et al. 2016). The same study found that the post-starburst galaxies have generally intermediate structural properties between those characteristic of normal star-forming and quiescent galax-ies, with no significant structural evolution detected during the first 600 Myr following the starburst. Rowlands et al. (2015) studied 11 galaxies atz∼0.03 spanning the age se-quence of ∼1 Gyr from the onset of the starburst, finding a decrease in the molecular gas surface density and effective dust temperature with increasing starburst age. However, the gas and dust fractions were found to be higher than in red-sequence galaxies even 1 Gyr following the starburst. The monotonic trends in the star-formation rate, gas and dust conditions and visual morphology of the post-starburst galaxies with estimated starburst age speak in favour of an evolutionary link between the ongoing starbursts, transition-ing post-starburst galaxies with measurable nebular emis-sion, and quiescent ‘K+A’ galaxies.
A class of transitioning post-starburst galaxies was also studied by Yesuf et al. (2014) who combined the traditional criterion of strong Hδ absorption with a more relaxed cri-terion on the Hα emission line, as well as galaxy colours and flux density ratios in the NUV-optical-IR regime to bridge the gap between starburst and quiescence atz <0.1. They found that at 10.3<log(M?/M)<10.7 the candi-date transitioning post-starburst galaxies (with detectable emission lines) are five times as numerous as quiescent post-starburst galaxies and that their structure and kinematics are intermediate between those of blue cloud and red se-quence galaxies.
Transitioning post-starburst galaxies have also been found at higher redshifts where, similarly to ‘K+A’ galaxies, they are more numerous compared with the local Universe. Using the above described PCA-based selection method, Wild et al. (2009) reported an increase in the mass den-sity of the post-starburst galaxies (both transitioning and ‘K+A’) more massive than log(M?/M) = 9.75 by a fac-tor of 200 betweenz ∼0.07 and z ∼0.7. They found that post-starbust galaxies selected with no emission-line cut are found across all environments with no significant difference in the distribution of local densities compared with con-trol samples at 0.5 < z < 1.0. More recently, Wild et al. (2016) used a Principle Component Analysis of the broad-band optical-NIR SED (supercolours, Wild et al. 2014, see also Maltby et al. 2016) to study the evolution of post-starburst galaxies from even earlier epochs and found that at log(M?/M)>10 their fraction rises from<1% to∼5% of the total galaxy population betweenz ∼0.5 and z∼2. Based on the comparison of the mass functions of the
post-starburst and red-sequence galaxies, they argue that rapid quenching of star formation can account for all of the qui-escent galaxy population, in the case where the timescale for visibility of the post-starburst spectral features in broad band photometry is not longer than∼250 Myr. A similar analysis by Rowlands et al. (2017) using spectroscopic sur-veys at lower redshifts found that the importance of post-starburst galaxies (defined using spectral PCA, as in Wild et al. 2007) in the build up of the quiescent galaxy popu-lation declines rapidly with decreasing redshift and may be insignificant byz= 0.
1.3 AGN and shocks in post-starburst galaxies
Observationally, post-starburst galaxies with emission lines have also been linked with the presence of an AGN and shocks. This was not seen in the early works on post-starburst galaxies which employed emission-line cuts in their selection, as their samples were biased against objects with any kind of ionising sources, including AGN (particularly if the [OII]line was used as the star formation indicator -see Yan et al. 2006). However, the connection was observed in numerous studies of AGN hosts. For example Kauffmann et al. (2003a) argued that strongHδlines in absorption are more common in luminous narrow-line AGN than in star-forming galaxies at 0.02< z <0.3, and Cid Fernandes et al. (2004) found high-order Balmer absorption lines in the nu-clear SED of nearly a third of their local low-luminosity AGN sample. Using a conservativeHαemission-line cut to select quiescent post-starburst galaxies atz <0.1, Yan et al. (2006) showed that most of them have AGN-like emission-line ratios. Goto (2006) selected a sample of over 800 Hδ -strong AGN hosts and used resolved spectroscopy for three such objects at z <0.1 to reveal a spatial connection be-tween the post-starburst region and the AGN. Sell et al. (2014) find evidence for AGN activity in 50% of their ex-treme post-starburst galaxies atz∼0.6.
Wild et al. (2007) used their PCA selection method to show that, at low redshift, AGN reside in over a half of the studied post-starburst galaxies and that, on average, they are the most luminous AGN within their samples. AGN hosts with post-starburst characteristics may be essential to understanding the causal connection between starbursts and AGN activity, and consequently that between star-formation and black hole growth in galactic centres, as well as give a unique insight into the process of star formation quenching. To that end Wild, Heckman & Charlot (2010) measured a delay between the starburst and AGN activity of about 250 Myr at 0.01< z <0.07. A similar time delay was found fol-lowing a different selection technique by Yesuf et al. (2014) who concluded that AGN are not the primary source of quenching of starbursts, but may be responsible for quench-ing durquench-ing the post-starburst phase (see also Goto 2006 and Davies et al. 2007 for time delays between peaks of starburst and AGN activity found in small AGN samples).
‘shocked’ post-starburst galaxies or SPOGs, with emission line ratios indicative of the presence of shocks. Such shocks could be related to a number of physical mechanisms, includ-ing AGN-driven outflows, mergers or proximity to a cluster (for details see Alatalo et al. 2016 and references therein).
1.4 Summary and goals of this work
Many papers interpret post-starburst galaxies as a transition phase between the star-forming blue cloud and the quiescent red sequence blue cloud- the two major stages of galaxy evolution. However, their true importance for red sequence growth remains a matter of debate. The aim of this paper is to investigate the star-formation histories, visual morpholo-gies, structural properties and environments of galaxies with strong Balmer absorption lines, and a range of emission line properties in order to determine their origins. We also aim to ascertain whether the different classes of Balmer strong galaxies are evolutionarily connected or following separate paths entirely.
This paper is organised as follows: Section 2 describes the samples and their selection criteria; Section 3 - the methodology used to obtain star formation histories, mor-phology, structure and environment; Section 4 - the results; Section 5 - a discussion, including the analysis of galaxy merger simulations, and focusing on the likely origin of the different post-starburst families and evolutionary pathways through the post-starburst phase; Section 6 - the summary of conclusions. We adopt a cosmology with Ωm = 0.30, ΩΛ = 0.70 and H0=70kms−1Mpc−1and magnitudes are on the AB system.
2 DATA AND SAMPLE SELECTION
The spectroscopic catalogue of the SDSS (7th Data Release, SDSS DR7, Abazajian et al. 2009), containing the optical spectral energy distributions (SED) of∼90,000 galaxies, is a natural choice for selection of objects as rare as low red-shift post-starburst galaxies. In our study, we made use of both spectroscopic and imaging data provided by the survey. Additionally, we utilised the information regarding several spectral lines available in the SDSS-MPA/JHU value added catalogue1. The measurements of the Petrosian magnitudes and redshifts of the galaxies were taken directly from the SDSS catalogue and the stellar masses of the galaxies were measured from the five-band SDSS photometry (J. Brinch-mann, SDSS-MPA/JHU) using a Bayesian analysis similar to that described in Kauffmann et al. (2003a). Importantly, this method allows for bursty star formation, varying metal-licity and 2-component dust attenuation.
The selection of the post-starburst galaxies as well as control galaxies with ordinary star formation histories was done based on their spectral characteristics. We note the rel-evance of the widely known aperture bias issue. At the low redshifts considered in this work the fixed 300aperture diam-eter of the SDSS fibers probes only the central∼0.6−3 kpc of massive galaxies. This means that the resulting spectra
1 http://www.mpa-garching.mpg.de/SDSS
and all derived quantities may be limited to the central re-gions of our galaxies and further investigation using spatially resolved spectroscopy is required to investigate the spectral characteristics of these galaxies on a global scale. However, the investigation of such “central” post-starburst galaxies is still of significant interest, not least because in merger sim-ulations the funnelling of gas to the central regions of the merger remnants leads to central starbursts which may be exactly the objects we are identifying in the observations. In what follows, we first introduce the basics of the technique adopted for the classification of the galaxy SED and then describe the criteria used to select the galaxy samples.
2.1 Spectral analysis
To distinguish post-starburst galaxies from those with other star-formation histories we used the Principal Component Analysis introduced by Wild et al. 20072 - a multivariate analysis technique that combines features that vary together in a data set, in this case the optical spectra of galaxies. Re-garding a single spectrum - traditionally a 1D array of n
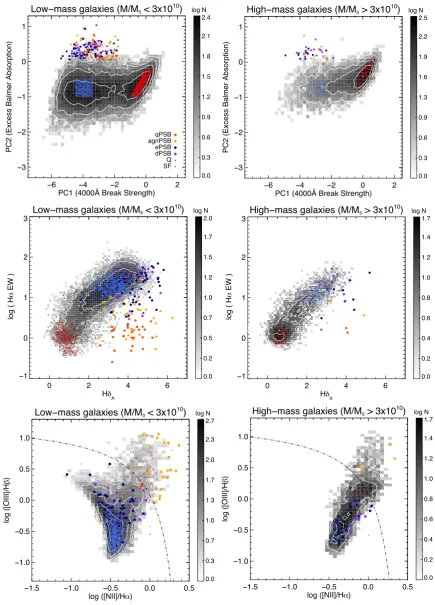
flux values - as a single point in an n-dimensional space, we can visualise a collection of spectra as a cloud of points inn-dimensions. The principal components are the orthogo-nal vectors corresponding to the lines of greatest variance in the cloud of points, and they constitute the new basis onto which the galaxy spectra are projected upon. The compo-nents were calculated using a set of mock spectra created using the Bruzual & Charlot (2003, BC03) spectral synthe-sis code, and therefore contain only stellar light. As this work is focused on post-starburst galaxies, the spectral analysis was limited to the Balmer line region of the galaxy spec-tra, specifically 3175-4150˚A. Within that region the first two principal components contain information about: PC1 - the 4000˚A-break strength, anti-correlated with Balmer absorption-line strength, which gradually increases with in-creasing mean stellar age; PC2 - theexcessBalmer absorp-tion above that expected based on the measured 4000˚ A-break strength, which identifies unusual ‘bursty’ star forma-tion histories.
The position in the PC1-PC2 parameter space depends on the stellar content and therefore the current and past star-formation activity of a galaxy. Galaxies with the high-est specific star-formation rate are located on the left side of the distribution. Moving towards higher values of PC1 we find galaxies dominated by subsequently older stellar pop-ulations and lower specific star-formation rates. PC2 traces the recent star-formation history of the galaxies. Due to the short lifetimes of the most massive O/B stars, the stellar content of galaxies changes rapidly after a starburst, and after about 1 Gyr the galaxy enters an evolutionary sweet spot where A/F stars dominate its energy output. This evo-lution is imprinted on the galaxy SED as the A/F stars are characterised by the strongest Balmer lines among all stellar types. Therefore we can select robust samples of ∼ 1Gyr-old post-starburst galaxies from the ‘bump’ at the top of the distribution in PC1-PC2.
This selection method does not require any emission-line
2
cut and therefore is suitable for the selection of both the tra-ditional post-starburst galaxies in which the star-formation has been quenched, as well as those with detectable emission caused by either ongoing star-formation or other ionisation mechanisms, such as AGN or shocks.
2.2 Sample selection criteria
We began our selection with a sample containing 83634 spec-troscopically confirmed galaxies with Petrosianr-band mag-nitudes 14.5 < mr < 17.7 at 0.01 < z < 0.05. In this redshift range selecting galaxies with stellar masses above M?/M = 109.5 yields samples that are statistically com-plete in red-sequence galaxies, which are defined as galaxies for which the spectral indices PC1 and PC2 (see Section 2.1) satisfy the relation PC26 PC1 + 0.5. Applying this mass criterion reduced the number of galaxies in the sample to 49148. We then applied a cut on spectral per-pixel signal-to-noise ratio: SNR> 8 in theg-band, to ensure accurate measurements of the spectral indices and emission line prop-erties. This removed further 11% of the sample, leaving us with 43811 objects.
Motivated by the bimodal nature of several galaxy prop-erties in the local Universe separating the majority of local galaxies into two distinct families at M?/M= 3×10¹⁰(e.g. Kauffmann et al. 2003a), we split our sample into these two different mass regimes and refer to the resulting subsets as low-mass and high-mass galaxies. The low- and high-mass parent samples contain 33438 and 10373 objects, respec-tively. Before selection of the Balmer-strong galaxies and control samples we applied a further restriction by remov-ing from the parent samples all galaxies observed ‘edge-on’, with projected axis ratio3 greater than 0.32. The purpose of this cut was to minimise potential biases in our measure-ments due to strong attenuation of the stellar light by dust in inclined galactic disks and it resulted in the reduction of the low- and high-mass samples by removing 17% and 13% of the galaxies, respectively. Our final samples from which the Balmer-strong and control samples were drawn contain 27901 and 9001 galaxies in the low- and high-mass regimes, respectively.
2.2.1 Balmer-strong/post-starburst galaxies
We found that placing a cut at PC2 = 0.0 at 1σ works well for selecting galaxies with prominent Balmer absorp-tion lines, yielding 157 and 32 galaxies in the low- and high mass regimes, respectively. Based on the models of top-hat starbursts superimposed on an old stellar population, inves-tigated by Wild et al. (2007), the galaxies selected from this extremum of the PC1-PC2 parameter space are expected
3 We defined the projected axis ratio using two SDSS
param-eters:expAB anddevAB (axis ratios from exponential and de-Vaucouleurs fits, respecively), measured in ther-band. Through careful visual inspection of the galaxy images, we found that the value of 0.32 works well for isolating the ‘edge-on’ objects and, therefore, we required both parameters to have values above that limit. Assuming that the galaxies have a characteristic intrinsic axis ratio of 0.2, the measured value 0.32 corresponds to 75o
in-clination.
to have starburst ages greater than ∼ 0.6 Gyr (see also the measured starburst ages in Wild, Heckman & Char-lot 2010). We then classified these Balmer-strong galaxies based on their emission-line measurements. We used a cut on theHαemission line equivalent width (EQW) to deter-mine whether the galaxies have ongoing star formation at a measurable level (indicated by EQW>3˚A with SNR>3). We further used the BPT diagnostics (Baldwin, Phillips & Terlevich 1981) to identify potential AGN-host candidates. For this purpose we used the condition introduced by Kew-ley et al. (2001), again, requiring that the emission lines have SNR>3. We chose this criterion over that introduced by Kauffmann et al. (2003a) to ensure the selection of galax-ies with AGN-dominated emission only, excluding those in which the contributions from the AGN and star formation are comparable.
A non-negligible number of the emission-line Balmer-strong galaxies were found to have high values of the Balmer decrement, i.e. the flux ratio ofHα to Hβ emission lines measured with respect to the intrinsic ratio of 2.87, indicat-ing considerable dust content. We separate out the ‘dusti-est’ galaxies in both mass regimes, in order to test whether they are a separate class of dust-obscured starburst galax-ies (Dressler et al. 1999; Poggianti et al. 1999). A cut on the Balmer decrement was placed to identify the top 10% of dusty galaxies in the parent samples, corresponding to
Hα/Hβ > 5.2 and Hα/Hβ > 6.6 in the low- and high-mass regime, respectively. Although arbitrary, this provides a good base for determining whether the dust-obscured Balmer-strong galaxies are truly different from the dust-unobscured ones. We find 35% and 42% of the Balmer-strong galaxies with emission lines have Balmer decrements above these cuts in the low- and high-mass samples, respectively. Considering the above criteria, we distinguish between four types of Balmer-strong galaxies:
• ‘Quiescent’ Balmer-strong galaxies (qPSB)- with no measurable Hα emission, equivalent to the traditional definition of post-starburst (or ‘K+A’) galaxies.
• Balmer-strong AGN host galaxies (agnPSB) -located above the Kewley et al. (2001) demarcation line in the BPT diagram.
• Emission-line Balmer-strong galaxies (ePSB) -galaxies with measurable Hα emission line, not classified as dusty or AGN-host candidates. The normal dust content suggests that these are unlikely to be contaminating dust-obscured starbursts. This will be assessed in the paper.
• Dusty Balmer-strong galaxies (dPSB)- with mea-surableHαemission, classified as dusty but not as AGN host candidates; the subset of ePSB with the highest dust content as indicated by the Balmer decrement. These may be dust obscured starbursts, and are the most likely contaminants of post-starburst samples defined without an emission line cut.
In all cases, we use the label ‘PSB’ for conciseness.
2.2.2 Control galaxies
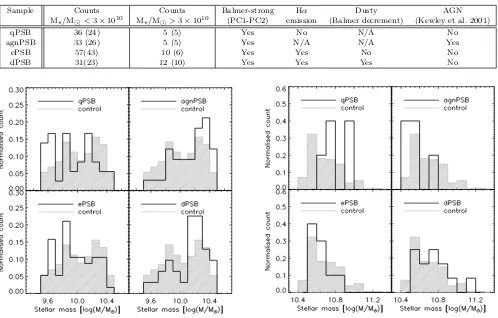
Table 1.Balmer-strong galaxy counts in the final samples and a summary of the sample selection criteria (see Section 2.1 for details). Cuts that were omitted during selection of particular samples are marked as not applicable (N/A) - note this does not mean that a given feature is not present in the resulting sample. The numbers in brackets in columns 2 and 3 correspond to galaxy counts in the reduced ‘clean’ samples, i.e. they exclude galaxies for which the SDSS images are contaminated sue to the presence of a nearby bright source (as explained in Section 4.2). These samples are of particular importance for the interpretation of the results of automated image analysis of the galaxies.
Sample Counts Counts Balmer-strong Hα Dusty AGN
M?/M<3×1010 M?/M>3×1010 (PC1-PC2) emission (Balmer decrement) (Kewley et al. 2001)
qPSB 36 (24) 5 (5) Yes No N/A No
agnPSB 33 (26) 5 (5) Yes N/A N/A Yes
ePSB 57(43) 10 (6) Yes Yes No No
dPSB 31(23) 12 (10) Yes Yes Yes No
Figure 1.Stellar mass distributions of the Balmer-strong galaxy and control samples. As a consequence of pair-matching the control galaxies onto the Balmer-strong samples (see Section 2.2.2), the distributions are the same for the star-forming and quiescent control samples and they match the combined distribution for all Balmer-strong galaxies, in both low-mass and high-mass regime.
control galaxies per Balmer-strong galaxy, from the highest-density regions of PC1-PC2 space coinciding with the blue cloud and the red sequence, respectively. As shown in the top left panel of Figure 2 the star-forming galaxies were selected from regions defined by−1.0<PC2<−0.5 with the PC1 criterion depending on the mass regime:−4.5<PC1<−3.4 (low-mass),−3.5<PC1<−2.4 (high-mass), and the quies-cent galaxies from regions defined by PC2>0.8×PC1−0.2 and PC2 <0.8×PC1−0.6, and by −1.0 <PC1 <−0.2 (low-mass) and−0.8<PC1<0.0 (high-mass). As there are no clear boundaries between the different classes of galaxies in the PC1-PC2 space, we chose to select samples from the regions of highest number density within the blue cloud and the red sequence in order to create clean samples of con-trol galaxies with “typical” properties, and avoid selecting objects with either extreme or intermediate properties.
Additionally, we build a dusty star-forming control sam-ple using the same regions of PC1-PC2 space as the star-forming control samples, with an additional constraint on the Balmer decrement to match the limits used to select the dPSB galaxies.
2.3 Summary of sample properties
Low−mass galaxies (M/MS < 3x10 10)
−6 −4 −2 0 2
PC1 (4000Å Break Strength)
−3
−2
−1 0 1
PC2 (Excess Balmer Absorption)
0.0 0.3 0.6 0.9 1.2 1.5 1.8 2.1 2.4 log N SFQ dPSB ePSB agnPSBqPSB
High−mass galaxies (M/MS > 3x10¹⁰)
−6 −4 −2 0 2
PC1 (4000Å Break Strength)
−3
−2
−1 0 1
PC2 (Excess Balmer Absorption)
0.0 0.3 0.6 0.9 1.3 1.6 1.9 2.2 2.5 log N
Low−mass galaxies (M/MS < 3x10¹⁰)
0 2 4 6
H A −1 0 1 2 3
log ( H
EW ) 0.0 0.2 0.5 0.7 1.0 1.2 1.5 1.7 2.0
log N High−mass galaxies (M/MS > 3x10 10)
0 2 4 6
H A −1 0 1 2 3
log ( H
EW ) 0.0 0.2 0.4 0.6 0.8 1.0 1.2 1.4 1.7 log N
Low−mass galaxies (M/MS < 3x10¹⁰)
−1.5 −1.0 −0.5 0.0 0.5
log ([NII]/H )
−1.0 −0.5 0.0 0.5 1.0 log ([OIII]/H ) 0.0 0.3 0.7 1.0 1.3 1.7 2.0 2.3 2.7
log N High−mass galaxies (M/MS > 3x10
10)
−1.5 −1.0 −0.5 0.0 0.5 log ([NII]/H )
[image:8.595.74.510.102.708.2]−1.0 −0.5 0.0 0.5 1.0 log ([OIII]/H ) 0.0 0.2 0.4 0.6 0.8 1.0 1.2 1.4 1.7 log N
Figure 2.The distribution of various spectral indicators for all galaxies in the parent samples (grayscale) with the final Balmer-strong galaxies (see Section 2.2.1 for selection details) overplotted in orange (qPSB), yellow (agnPSB), dark blue (ePSB) and purple (dPSB). The control samples of star-forming (SF) and quiescent (Q) galaxies are plotted in light blue and red, respectively.Top row- principal component amplitudes, PC1 and PC2, used for the selection of Balmer-strong galaxies;Middle row - the traditionally usedHδA Lick
absorption line index and the equivalent width of theHα emission line;Bottom row- the BPT diagram (Baldwin, Phillips & Terlevich
3 METHODOLOGY
3.1 Star formation histories
The galaxy SED in the UV-to-IR regime is generally dom-inated by the light emitted by its stellar components, re-processed by the surrounding reservoirs of the interstellar medium (ISM). Therefore, it contains information about the galaxy’s star-formation rate and its star formation history, as well as its dust content. The star formation history can be extracted from the SED through the process of spectral synthesis which essentially breaks down the galaxy SED into its base components. In practice, this is done by fitting the SED with a range of models - here we use an unparame-terised approach, meaning that the star formation history is not constrained to be a particular form. We fit a linear combination of starbursts, called simple stellar populations (SSP), spanning a wide range of ages and metallicities.
3.1.1 Spectral synthesis
In this work we utilised the SED fitting code STARLIGHT (Cid Fernandes et al. 2005), to fit an updated version of the BC03 evolutionary synthesis models, with dust attenuation modelled as a single foreground dust screen. The fitting pro-cedure in STARLIGHT is carried out using a sophisticated multi-stage χ2-minimisation algorithm combining anneal-ing, Metropolis and Markov Chain Monte Carlo techniques. Prior to the fitting, the galaxy spectra were sky-residual subtracted longward of 6700˚A, in order to correct the ef-fects of the incomplete subtraction of the OH emission lines by the SDSS spectroscopic reduction pipeline (Wild, Hewett & Pettini 2006)4. All fluxes were corrected for Galactic ex-tinction using the exex-tinction values provided in the SDSS catalogue which are based upon the Schlegel, Finkbeiner & Davis (1998) dust emission maps and the Milky Way extinc-tion curve of Cardelli, Clayton & Mathis (1989). The spectra were moved onto air wavelengths to match the models and nebular emission lines of the star-forming, ePSB and dPSB galaxies were masked using a bespoke mask defined from the stacked star-forming galaxy spectrum.
The processed spectra were fit with a linear combina-tion of 300 SSPs spanning 60 stellar ages, that range from 1 Myr to 14 Gyr, and 5 metallicities: Z/Z= 0.02, 0.2, 0.4, 1 and 2.5, where we have assumed Z = 0.02. The ages were chosen to cover the whole of cosmic time, roughly lin-early spaced in log age between 108 and 1010 years, and with slightly sparser sampling for models younger than 108 years. Although 60 ages bins are far more than can be con-strained from a single optical spectrum, sufficient coverage is required across the main sequence lifetime of A/F stars (be-tween 100 Myr and 2 Gyr) where the strength of the Balmer lines and distinctive shape of post-starburst galaxy spectra change rapidly with time, in principle allowing accurate age dating of the population. We used our star-forming galaxy control sample to test both the standard BC03 population synthesis models which use the Stelib stellar spectral library (Borgne et al. 2003), and a new set of models which com-bine both the Stelib and MILES libraries (S´anchez-Bl´azquez
4 http://www.sdss.jhu.edu/skypca/spSpec/
et al. 2006) to give a total wavelength coverage of 3540.5-8750˚A5. Redwards of 8750˚A both models are based on the theoretical BaSeL 3.1 spectral library (Westera et al. 2002). Additional changes to the model atmospheres used to model the UV are not relevant to this work. Both models are based on thePadova 1994 set of stellar evolution tracks.
The traditional BC03 models caused an artificial peak in the star formation history (SFH) of star-forming control galaxies between 1.6-1.9 Gyr, as well as a smaller peak at 1.3 Gyr; these peaks in star formation histories are a known problem with the models and visible in previous analyses where SFHs from unparameterised fits are presented in a rel-atively unsmoothed format (e.g. mass-assembly in Fig. 8 of Asari et al. 2007, Gonz´alez Delgado et al. 2017). The spikes are particularly visible in our Balmer-strong samples, which have a significant fraction of their mass formed in this time interval. The updated models provide a more continuous stacked star formation history for the control star-forming galaxies around the critical 0.5−2×10⁹year timescale which is relevant for quantifying the burst strength and age in post-starburst galaxies. However, a smaller artificial bump is still evident at∼1.3 Gyr. Unfortunately this feature in the stel-lar population models limits the accuracy with which we can age-date the starburst in older post-starburst galaxies. Further investigation as to how these problems can be miti-gated when fitting post-starburst galaxy spectra is on-going, but for the purposes of this paper we limit our analysis to parameters that are robust to changes in the library i.e. the total fraction of stars formed in the last 1 and 1.5 Gyr, and the star formation history prior to 2 Gyr. Additionally, we use our control sample of star-forming galaxies to ensure that bursts are detected above any artificial signals in the star-forming sample.
During fitting, we adopted the attenuation law for star-burst galaxies of Calzetti (2001). Repeating the analysis with the Milky Way extinction law of Cardelli, Clayton & Mathis (1989) produced quantitatively slightly different SFHs, but did not alter our conclusions when comparing SFHs between samples.
3.2 Morphology and structure
To characterise the morphology and structure of our galax-ies we applied a range of automated measures to their sky-subtracted images in the g, r and i bands of the SDSS. The analysis was performed on 1 arc minute cutouts of the SDSS images, centred on the galaxy of interest as defined by the coordinates provided in the SDSS database. Prior to the analysis all images were inspected visually to identify bright light sources in close proximity to the galaxies of in-terest. Bright nearby sources have the potential to severely contaminate the measures of morphology and structure and, therefore, all images in which such sources had been identi-fied were excluded from the image analysis. This resulted in the reduction of the sample sizes as summarised in Table 1. Our methods follow those presented in Pawlik et al. (2016); here we outline only the most important details. First, we created a binary pixel map which identifies pixels associated with the galaxy, as opposed to the surrounding
sky. The algorithm loops around the SDSS position pixel, searching for connected pixels above a given threshold (1σ
above the median sky background level). Combined with a running average smoothing filter, the algorithm picks out contiguous features in an image down to a low surface bright-ness (∼24.7 mag/arcsec2).
The binary pixel maps were used to estimate the galaxy radius,Rmax, as the distance between the centre (brightest galaxy pixel) and the most distant pixel from that centre within the map. Generally, this definition of galaxy radius agrees well with the commonly used Petrosian radius (Pet-rosian 1976; Blanton et al. 2001; Yasuda et al. 2001); how-ever, it provides an advantage in the case of galaxies with extended faint outskirts, like tidal tails.
We then followed standard procedures to measure the S´ersic index (n)6, the concentration index (C)7, the light-weighted asymmetry (A), the Gini index (G) and the mo-ment of light (M20). We additionally measured the new shape asymmetry (AS), presented in Pawlik et al. (2016), which quantifies the disturbance in the faint galaxy out-skirts. The shape asymmetry is computed using the same ex-pression as the light-weighted asymmetry parameter, under a 180-degree rotation, but with the measurement performed using the binary pixel maps rather than the galaxy im-ages. This approach allows for equal weighting of all galaxy parts during the measurement, regardless of their relative brightness. Finally, we computedAS90to quantify the shape asymmetry under a 90-degree rotation. This can be used in conjunction withAS to indicate whether the features in galaxy outskirts are elongated (e.g. tidal tails) or circular (e.g. shells). Further details of the methods used to measure each of these parameters are given in Pawlik et al. (2016) and references therein.
3.3 Environment
We adopted the projected number density of galaxies in the vicinity of the target galaxy as a measure of the en-vironment. The number density was calculated following the method described in Aguerri, M´endez-Abreu & Corsini (2009), using the projected comoving distance of the target galaxy,dN, to itsNth nearest neighbour:
ΣN =
N πd2
N
. (1)
The nearest neighbours were defined in two ways. The first definition includes all galaxies with spectroscopic red-shifts,zs, within±1000km/s of the target galaxy, and with an absolute magnitude difference of not more than ±2. These criteria are similar to those used by Balogh et al. (2004) and are designed to limit the contamination by back-ground/foreground galaxies even when using projected dis-tances. The second definition uses the SDSS photometric redshift measurements and selects galaxies within ∆zp=0.1 from the target galaxy (see Baldry et al. 2006 for a simi-lar approach). This does not suffer the same incompleteness
6 Computed using the 1D surface-brightness profiles defined by
circular apertures.
7 Here we use the growth curve radii enclosing 20% and 80% of
the total light.
of the spectroscopic samples, but has higher contamination due to the less accurate photometric redshifts.
It is important to realise that the values of Σ5 are ap-proximate estimates of the local number density, with the spectroscopic and photometric measurements representing the lower and upper boundaries8, and the uncertainties as-sociated with Σ5 are expected to be large. To examine the accuracy of the density measurements we also considered the 3rd, 8th and 10th nearest neighbours and found a good agreement with Σ5. Furthermore, we flagged all galaxies withdN greater than the distance to the edge of the sur-vey, as for such locations the density measurements may be unreliable.
To provide one single estimate of local environment, we took the mean Σ5 of the spectroscopic and photomet-ric measurements. We stress that the purpose of the mean is merely to provide a single value which is likely to be closer to the true value than the individual measurements, rather than to serve as any statistical measure. We find that the qualitative results and conclusions remain generally un-changed whether we use the mean Σ5or the individual spec-troscopic/photometric measurements, except for the ePSB sample. For this case we comment on the discrepancies when discussing the results in Section 4.3.
To relate the values of Σ5 to the different types of envi-ronment, we follow the definitions used by previous studies (e.g. Aguerri, M´endez-Abreu & Corsini 2009, Walcher et al. 2014):
• Σ5<1Mpc−2 - very low-density environments, • 1Mpc−2<Σ5<10Mpc−2 - loose groups, • Σ5>10Mpc−2 - compact groups and clusters.
4 RESULTS
In Table 2 we present the recently formed mass fractions es-timated by STARLIGHT (fM1,fM15- within the last 1Gyr and 1.5 Gyr, respectively), the projected galaxy number den-sity (Σ5) and ther-band measurements of several structural and morphological parameters (n,C,A,AS,AS90,G,M20) for all Balmer-strong galaxies studied in this work. Here we present only the top ten rows (galaxies ordered by their specobjid number); the full table is available online.
4.1 Star formation history
Using the output of the STARLIGHT code, we explored both recent and earlier (pre-burst) star-formation histories of the Balmer-strong galaxies and compared them with the control samples. The star-formation histories of the dPSB galaxies and associated dusty star-forming control sample output by the code showed almost 100% of their mass as-sembled at very early cosmic times - inconsistent with their current star forming properties as evident from their nebular
8 The spectroscopic measure is taken as the lower limit because
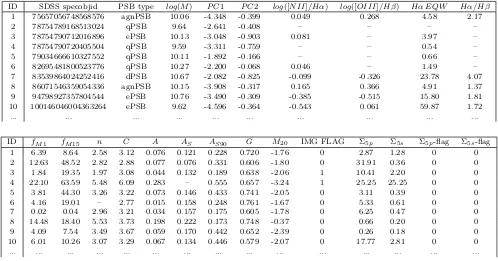
Table 2.Analysis results for the post-starburst galaxies (full table available online as supplementary material). The columns contain: the SDSSspecobjid; the post-starburst type (Section 2.2.1); the logarithmic stellar mass in units ofM; the spectral indices - PC1 and PC2; the line ratios from the BPT diagram; the equivalent width of the Hαemission line; the Balmer decrement (Hα/Hβ); the fractions of recently formed stellar mass -fM1 andfM15 (Section 3.1.1); the indicators of structure and morphology measured in the
r-band -n,C,A,AS,AS90,GandM20(Section 3.2) and the correspondingr-band image contamination flag; the local galaxy density
measurements (photometric and spectroscopic) used to compute Σ5 (Section 3.3) and the corresponding measurement flags related to
the proximity to survey boarders.
ID SDSS specobjid PSB type log(M) P C1 P C2 log([N II]/Hα) log([OIII]/Hβ) Hα EQW Hα/Hβ
1 75657056748568576 agnPSB 10.06 -4.348 -0.399 0.049 0.268 4.58 2.17
2 78754789168513024 qPSB 9.64 -2.641 -0.408 – – – –
3 78754790712016896 ePSB 10.13 -3.048 -0.903 0.081 – 3.97 –
4 78754790720405504 qPSB 9.59 -3.311 -0.759 – – 0.54 –
5 79034666610327552 qPSB 10.11 -1.892 -0.166 – – 0.66 –
6 82695481800523776 qPSB 10.27 -2.200 -0.068 0.046 – 1.49 –
7 83539864024252416 dPSB 10.67 -2.082 -0.825 -0.099 -0.326 23.78 4.07
8 86071546359054336 agnPSB 10.15 -3.908 -0.317 0.165 0.366 4.91 1.37
9 94798927357804544 ePSB 10.76 -3.490 -0.309 -0.385 -0.515 15.80 1.81
10 100146046004363264 ePSB 9.62 -4.596 -0.364 -0.543 0.061 59.87 1.72
... ... ... ... ... ... ... ... ... ...
ID fM1 fM15 n C A AS AS90 G M20 IMG FLAG Σ5p Σ5s Σ5p-flag Σ5s-flag
1 6.39 8.64 2.58 3.12 0.076 0.121 0.228 0.720 -1.76 0 2.87 1.28 0 0
2 12.63 48.52 2.82 2.88 0.077 0.076 0.331 0.606 -1.80 0 31.91 0.36 0 0
3 1.84 19.35 1.97 3.08 0.044 0.132 0.189 0.638 -2.06 1 10.41 2.20 0 0
4 22.10 63.59 5.48 6.09 0.283 – 0.555 0.657 -3.24 1 25.25 25.25 0 0
5 3.81 44.30 3.26 3.22 0.073 0.146 0.433 0.741 -2.05 0 3.11 0.39 0 0
6 4.16 19.01 – 2.77 0.015 0.158 0.248 0.761 -1.67 0 5.33 0.61 0 0
7 0.02 0.04 2.96 3.21 0.034 0.157 0.175 0.605 -1.78 0 6.25 0.47 0 0
8 14.48 18.40 5.53 3.73 0.198 0.222 0.173 0.748 -0.37 0 0.66 0.20 0 0
9 4.09 7.54 3.49 3.67 0.059 0.170 0.442 0.652 -2.39 0 0.26 0.18 0 0
10 6.01 10.26 3.07 3.29 0.067 0.134 0.446 0.579 -2.07 0 17.77 2.81 0 0
... ... ... ... ... ... ... ... ... ... ... ... ... ... ...
emission lines. We therefore believe that the spectral fitting is likely impacted by the high dust contents of these galax-ies, and the fact that STARLIGHT can only fit a single-component dust screen, so we exclude these galaxies from this part of the analysis. Further details on the colours and spectral fits of this sample are given in Appendix A.
4.1.1 Recent star formation
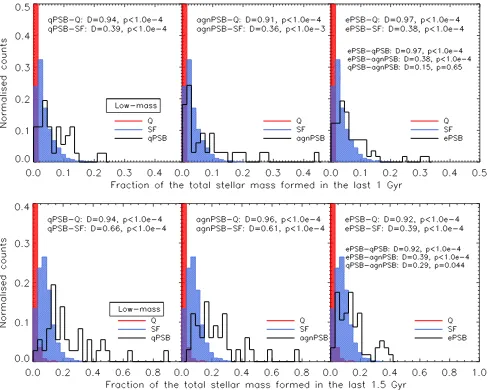
The histograms in Figures 5 and 6 show the distributions of the fractions of recently formed mass for the low-mass and high-mass samples, respectively. The quantities fM1 andfM15correspond to the fractions of mass formed in the last 1 Gyr and 1.5 Gyr, respectively. Each panel shows one Balmer-strong sample (qPSB, agnPSB, ePSB), compared to the control samples of quiescent and star-forming galaxies. Note the change inx-axis range between each row. In both samples, we can immediately see that the distributions of
fM1 and fM15 for the Balmer-strong galaxies are skewed towards higher values compared with the control distribu-tions. For the low-mass samples, we show K-S test results comparing the different distributions. The small numbers of objects in the high-mass samples make such tests less useful so are not shown. Table 3 presents the percentage of galax-ies with very high and very lowfM1 andfM15in each PSB sample and the control star-forming sample.
In both mass bins, the values offM1 and fM15 for the quiescent control samples are consistent with zero and the K-S results clearly show that none of the low-mass
Balmer-strong samples are consistent with matching the quiescent control sample. For the low-mass star-forming control galax-ies we find the majority (∼ 80%) have fM1 < 0.05 and
fM15<0.12, and a very small fraction (less than 1%) have
fM1>0.10 andfM15>0.20. Looking at Table 3, compared to the star-forming galaxies, (1) a much lower fraction of low-mass Balmer-strong galaxies (14%−54%) formed less than 5% and 12% of their stellar mass in the last 1 Gyr and 1.5 Gyr, respectively; 2) a considerably higher fraction of low-mass Balmer-strong galaxies (21%−48%) have more than 10% and 20% of there stellar mass formed in the last 1 Gyr and 1.5 Gyr, respectively. This effect is particularly pronounced in the qPSB and agnPSB samples, pointing to a stronger starburst compared with the ePSB galaxies. The K-S tests additionally show that the distributions of fM1 and fM15 for the agnPSB and qPSB samples are statisti-cally identical, with all other distributions being different from one another.
with∼3% and∼2% of the star-forming galaxies. In con-trast with the low-mass bin, the fractions of recently formed mass are highest for the ePSB sample.
It is clear that a notable number of the Balmer-strong galaxies, particularly in the low-mass ePSB sample, have a fraction of recently formed mass that is consistent with that found in star-forming galaxies. It is of course entirely possi-ble that these are true post-starburst galaxies with weaker bursts than the others, as it is actually the rapid decline in star formation that leads to the distinctive spectral shape of post-starburst galaxies picked up by the PCA selection method, and this is not exactly what is measured by fM1 andfM15. We may expect weaker bursts to fail to use up the entirety of the available gas, thereby accounting for the on-going star formation. However, it does raise the question of whether they are true post-starburst galaxies or interlopers with strong Balmer absorption lines caused by something other than their star formation history. A careful investi-gation showed that the values of fM1 and fM15 are inde-pendent of stellar mass, structure and the environment of the galaxies; however, we found some dependence on the signal-to-noise ratio (SN R) and the dust content. Out of the ePSB galaxies withSN R <15 (20/57), 70% and 55% have the lowest measured fractions of recently formed stellar mass (fM1<0.05 andfM15<0.1), compared with 46% and 24%, respectively, of those with SN R > 15. This suggests that higher SNR spectra than than the typical in SDSS-DR7 are required to reliably identify recent bursts weaker than ∼10% by mass. Furthermore, 76% and 53% of ePSB galaxies with the largest dust content (Hα/Hβ >4.6) coincide with
fM1 < 0.05 and fM15 < 0.1, respectively, compared with 39% and 25% of the less-dusty ePSB galaxies. This could imply either: (a) the assumption of a single dust screen pre-vents STARLIGHT from recovering a recent burst in the dustier ePSB galaxies, but they fundamentally do not differ from the rest of the ePSB sample other than by their dust content, or (b) the stronger than average Balmer absorption lines do not reflect a decaying starburst but actually arise from a dust-star geometry such that the O/B stars being obscured behind more dust than average, i.e. these galaxies are not simply more dusty ePSB galaxies but less extreme versions of the “dusty starburst” galaxies (Poggianti & Wu 2000). Untangling these two possibilities is very tricky, push-ing us to the limits of spectral fittpush-ing techniques, and will be the subject of a future study. We conclude that, while a significant fraction of the ePSB galaxies have had a re-cent burst of star formation in the past in which typically &10% of the stellar mass was formed, the effects of noise and dust on the galaxy spectra may cause some level of contam-ination of post-starburst samples in which only weak bursts are identified by spectral fitting. Higher SNR spectra will be needed in order to understand the cause of strong Balmer absorption lines in the majority of ePSB galaxies from their spectra alone. In the following subsections we turn to other properties to further constrain their origins.
4.1.2 Star formation prior to the starburst
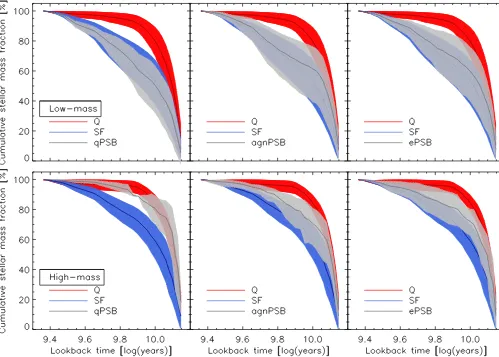
Figure 7 shows the stacked time evolution of the cumulative fraction of the total stellar mass of the galaxies, with the total mass calculated at 2 Gyr in lookback time. This allows us to investigate the star formation history of the
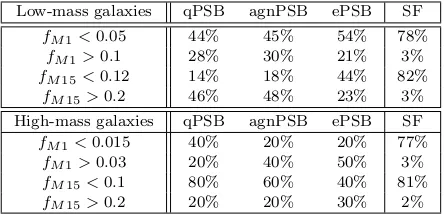
galax-Table 3.The percentage of galaxies in the Balmer-strong samples and control star-forming galaxies that formed a given portion of their stellar mass in the last 1 Gyr (fM1) and 1.5 Gyr (fM15), as
estimated by STARLIGHT.
Low-mass galaxies qPSB agnPSB ePSB SF
fM1<0.05 44% 45% 54% 78%
fM1>0.1 28% 30% 21% 3%
fM15<0.12 14% 18% 44% 82%
fM15>0.2 46% 48% 23% 3%
High-mass galaxies qPSB agnPSB ePSB SF
fM1<0.015 40% 20% 20% 77%
fM1>0.03 20% 40% 50% 3%
fM15<0.1 80% 60% 40% 81%
fM15>0.2 20% 20% 30% 2%
ies prior to the starburst. For each sample, the solid lines represent the mean values and the shaded regions illustrate the spread of values within the sample, quantified by the standard deviation from the mean. As for the recent star formation history, the difference between the quiescent and star-forming galaxies is clear and in agreement with expec-tations: the quiescent galaxies clearly build a higher fraction of their stellar mass at earlier times.
In the low-mass regime, the pre-burst star formation histories of all the three Balmer-strong samples, qPSB, agnPSB and ePSB, are almost indistinguishable from the histories of the star-forming galaxies and clearly distinct from the quiescent galaxies. This is consistent with the low-mass Balmer-strong galaxies originating from gas-rich star-forming, rather than quiescent, progenitors. Interestingly, the same is not true at high-mass. In particular, the pre-burst star-formation histories of the massive qPSB galaxies are distinct from the star-forming control, and overlap with those of the quiescent galaxies. This points to red-sequence progenitors, perhaps rejuvenating through minor mergers with gas-rich dwarfs. For the agnPSB and ePSB samples, the stellar mass build-up prior to the burst falls between the two control samples. More detailed inspection revealed that the star-formation histories of both ePSB and agnPSB split roughly equally between those that resemble the quiescent population and those that look more like the star-forming galaxies.
4.2 Morphology and structural properties
Using the output from the image analysis code described in Section 3.2 we investigated the morphology and structural properties of all galaxies without nearby stars or other im-age contaminants (‘clean’ samples, Table 1). In Appendix B we investigated whether emission from narrow-line AGN affects the measurements of galaxy structure and morphol-ogy in our samples. We found no significant effect on any of the light-weighted parameters (n,C,G,M20,A) measured in ther-band and conclude that we can use these measure-ments to meaningfully compare between galaxies with and without narrow-line AGN. Additionally, in Appendix C we present relations between selected parameters that may be of interest to some readers. These includeA−C,G−M20 andn−log(Σ5).
[image:14.595.314.536.150.257.2]im-Figure 5.The fraction of total stellar mass of the low-mass galaxies formed in the last 1 and 1.5 Gyr (top and bottom, respectively), as estimated by STARLIGHT. The legend shows the results of the K-S test for comparison of the distributions in the given panel. As a value of zero is measured for most of the quiescent galaxies, the y-axis has been shortened to better show the data for the other samples. Note the difference between the x-axis ranges in the upper and lower panel.
ages led to the same conclusions). We additionally visually inspected the 3-colour images of the galaxies for signs of past mergers, which can be difficult to identify with automated measurements. These include tidal features that do not form an asymmetric pattern when observed from a given direction and are therefore not detectable with the shape asymmetry (AS). The images were inspected by only one reviewer as the aim of the visual classification was merely to provide subsidiary information to that inferred from the automated proxies - the main component of our analysis.
4.2.1 Asymmetries and signs of interaction
Both the visual inspection and automated measurements agree that the Balmer-strong galaxies in our samples are not ongoing mergers. In both low- and high-mass sam-ples, the majority have low light-weighted asymmetry val-uesA <0.2, characteristic of normal galaxy types and none haveA >0.35 commonly found in ongoing mergers.
Further-more, they occupy a similar region of theG−M20parameter space as the control galaxies, with only a few ‘outliers’ in the merger region. The light-weighted asymmetry vs. con-centration index and Gini index vs. M20 are presented in Figures C1 and C2 respectively. Given the short visibility timescales for merger signatures (0.2-0.4 Gyr), peaking be-fore coalescence (Lotz et al. 2008), and the estimated ages of the starburst (>0.6 Gyr), it is not surprising to see few ongoing mergers and this does not rule out a merger origin for the Balmer-strong galaxies.
[image:15.595.51.540.106.496.2]signa-Figure 6.Fractions of recently formed mass for the high-mass samples (see the caption of Figure 5) for more information. Note the difference between the x-axis ranges in the upper and lower panel.
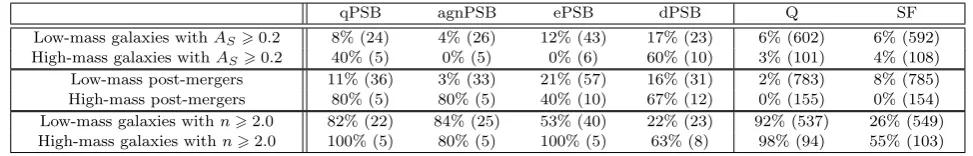
Table 4.The percentage of galaxies in the Balmer-strong samples with given morphology/structure.Top:presence of asymmetric tidal features implied byAS>0.2.Middle:visually identified morphological disturbance signifying a recent interaction.Bottom:steep light
profiles, characterised byn>2.0. The numbers in brackets show the total number of galaxies used to calculate the percentage values in each case. For visual image analysis this equals to the total numbers of galaxies found in our samples but in the case of automated analysis the numbers are lower as they exclude galaxies for which the code failed to obtain a measurement ofASorn).
qPSB agnPSB ePSB dPSB Q SF
Low-mass galaxies withAS>0.2 8% (24) 4% (26) 12% (43) 17% (23) 6% (602) 6% (592)
High-mass galaxies withAS>0.2 40% (5) 0% (5) 0% (6) 60% (10) 3% (101) 4% (108)
Low-mass post-mergers 11% (36) 3% (33) 21% (57) 16% (31) 2% (783) 8% (785)
High-mass post-mergers 80% (5) 80% (5) 40% (10) 67% (12) 0% (155) 0% (154)
Low-mass galaxies withn>2.0 82% (22) 84% (25) 53% (40) 22% (23) 92% (537) 26% (549) High-mass galaxies withn>2.0 100% (5) 80% (5) 100% (5) 63% (8) 98% (94) 55% (103)
tures, such as tidal tails. This is consistent with the results of Pawlik et al. (2016) who found that by 600 Myr following the starburst, the shape asymmetry had largely returned to levels similar to control samples. In the top rows of Table 4 we present the fraction of galaxies in each sample with
AS >0.2. At low-mass, the ePSB and dPSB samples con-tain the highest fractions of objects with AS > 0.2 (12% and 17%, respectively), which is a little higher than found in the control samples (6% for both quiescent and star-forming
galaxies). The proportions of low-mass qPSB and agnPSB galaxies withAS>0.2 are low, consistent with those found in the control samples. At high mass, the qPSB and dPSB galaxies have much higher fractions of post-merger candi-dates than the control samples (40% [2/5] and 60% [6/10], respectively), but the other two samples have no positive detections (0/5).
[image:16.595.49.536.591.669.2]Figure 7. The pre-burst star formation histories of the Balmer-strong galaxies, compared with control galaxy samples. Plotted are the stacked cumulative pre-burst star-formation histories, normalised to unity at 2 Gyr lookback time, obtained for the Balmer-strong galaxies (grey) and of the control star-forming and quiescent galaxies (blue and red, respectively). The top and bottom rows show results for the low-mass and high-mass samples, respectively. For each sample, the solid lines represent the mean values and the shaded regions illustrate the spread of values within the sample (measured by the standard deviation from the mean).
by visual inspection. We stress that the two post-merger definitions are not equivalent, as the visual classification does not rely on a high degree of asymmetry in the mor-phological disturbance and is therefore more inclusive. At low-mass, the fraction of ePSB galaxies visually classified as post-mergers is significantly higher than measured withAS, and at high mass the same is true for qPSB, agnPSB and ePSB samples. At high mass, the measured fractions reach 80% (4/5) in both qPSB and agnPSB. This increase in post-merger fractions is due to features which are not asymmetric enough to be detected by AS. Interestingly, those Balmer-strong galaxies with AS > 0.2 tend to have low/moderate values ofAS90, which also points to tidal features with lit-tle azimuthal asymmetry. Given that some simulations have shown that symmetric tidal feature patterns such as shells may be formed not only through satellite accretion but also in late stages of major mergers (see e.g. Hernquist & Spergel 1992, Pop et al. submitted), it is interesting to speculate that symmetric tidal features are more common in more evolved systems, consistent with the starburst ages of∼1−1.5 Gyr in these samples. However, as minor mergers may lead to
similar signatures, further analysis of simulations would be required to confirm this.
4.2.2 The profile and central concentration of light
In Figure 9 we show the distribution of S´ersic indices, with K-S test results comparing distributions to the control sam-ples and each other. The lower rows of Table 4 show the frac-tion of each sample with steep light profiles, characterised byn>2.0.
The low-mass Balmer-strong galaxies span the whole dy-namic range in S´ersic index, with 0.56n65.5, pointing to a range of structural properties, from highly concentrated single component spheroids to disk-dominated systems. The distributions found for qPSB and agnPSB are comparable to the quiescent control sample (D ∼ 0.2, p = 0.28 and
D ∼ 0.3, p = 0.0065), indicating high central concentra-tion characteristic of massive spheroids (82% and 84% with
n > 2, respectively, compared with 92% of the quiescent galaxies). The ePSB sample has typically lower values ofn
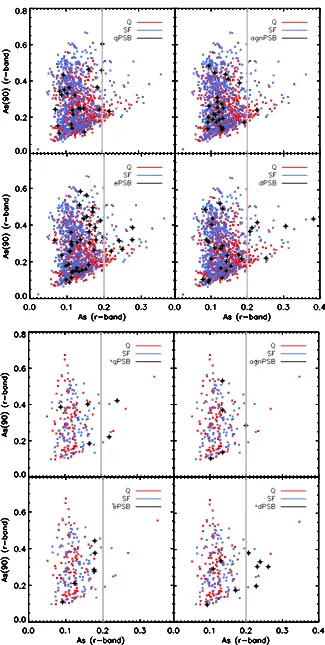
statis-Figure 8.The relation between the shape asymmetry parameters,ASandAS90(measured under 180o- and 900-rotation, respectively)
[image:18.595.129.454.96.741.2]Figure 10. The values of the projected density measured to the 5th nearest neighbour (Σ5) measured for the low-mass (top) and
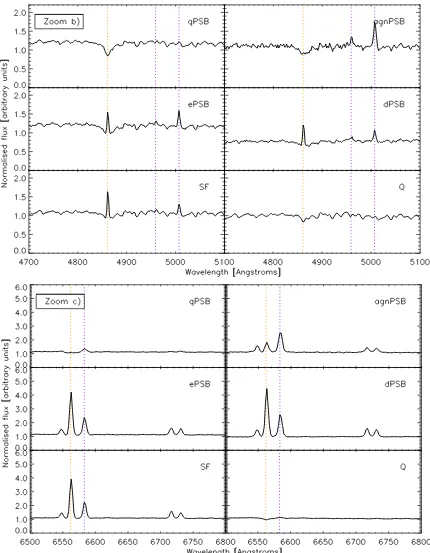
![Figure 3. Top panel: the stacked SED of the different galaxy samples, normalised at 8000lines that of [NII]6583are zoomed-in on in the bottom panel and in Figure 4](https://thumb-us.123doks.com/thumbv2/123dok_us/8984442.395016/9.595.71.516.108.684/figure-stacked-dierent-galaxy-samples-normalised-zoomed-figure.webp)