Energy and Power Engineering, 2011, 3, 34-42
doi:10.4236/epe.2011.31006 Published Online February 2011 (http://www.SciRP.org/journal/epe)
Wavelet Entropy Based Algorithm for Fault Detection and
Classification in FACTS Compensated Transmission Line
Amany M. El-Zonkoly, Hussein Desouki
Department of Electric & Control Engineering, Collage of Engineering & Technology, Arab Academy for Science & Technology, Alexandria, Egypt
E-mail: [email protected]
Received November 3, 2010; revised December 10, 2010; accepted December 15, 2010
Abstract
Distance protection of transmission lines including advanced flexible AC transmission system (FACTS) de-vices has been a very challenging task. FACTS dede-vices of interest in this paper are static synchronous series compensators (SSSC) and unified power flow controller (UPFC). In this paper, a new algorithm is proposed to detect and classify the fault and identify the fault position in a transmission line with respect to a FACTS device placed in the midpoint of the transmission line. Discrete wavelet transformation and wavelet entropy calculations are used to analyze during fault current and voltage signals of the compensated transmission line. The proposed algorithm is very simple and accurate in fault detection and classification. A variety of fault cases and simulation results are introduced to show the effectiveness of such algorithm.
Keywords:FACTS, SSSC, UPFC, Wavelet Transform, Entropy Calculation
1. Introduction
In recent years, it has become more difficult to construct new generation facilities and transmission lines due to energy and environmental problems. Hence, it is required to enhance the power transfer capability of existing transmission lines instead of constructing new ones. Be-cause of all that, it became more important to control the power flow along the transmission lines to meet the needs of power transfer. On the other hand, FACTS de-vices have received more attention in transmission tem operations as they can be utilized to alter power sys-tem parameters in order to control power flow. With FACTS technology, such as static var compensators (SVCs), static synchronous compensators (STATCOMs), static synchronous series compensators (SSSCs) and unified power flow controllers (UPFCs), etc., bus volt-ages, line impedances and phase angles in the power system can be flexibly and rapidly regulated. In addition, the FACTS devices have the capability of increasing transmission capabilities, decrease the generation cost and improve the security and stability of power system [1,2]. During fault, the presence of compensating devices affects steady-state and transient components of current and voltage signals which create problems with relay functionality [3,4].
A. M. El-ZONKOLY ET AL. 35
In [5], authors took advantage of the post-fault voltage and current samples taken synchronously from both ends of the line to build a recursive optimization algorithm to find the distance to fault in a transmission line compen-sated with a series FACTS device. The proposed algo-rithm in [5] is independent of the FACTS device model. However, it aimed only to the location of fault without trying to find its type.
In this paper, we are interested in two of the most im-portant FACTS devices; the SSSC and the UPFC. The SSSCs are FACTS devices for power transmission line series compensation. It is a power electronic-based volt-age source converter (VSC) that generates a nearly sinu-soidal three-phase voltage which is in quadrature with the line current. The SSSC converter block is connected in series with the transmission line by series coupling transformer. The SSSC can provide either capacitive or inductive series compensation independent of the line current [16]. The UPFC, which has been recognized as one of the best featured FACTS devices, is capable of providing simultaneous active and reactive power flow control, as well as, voltage magnitude control. The UPFC is a combination of STATCOM and SSSC which are connected via a common DC link, to allow bidirectional flow of real power between series output terminals of SSSC and the shunt terminals of the STATCOM [2]. These two devices are suggested due to some problems encountered in case of lines compensated with conven-tional compensators such as fixed series capacitor or TCSC. Problems encountered in case of series compen-sated lines are as follows [12]:
1) The steady state current is increased significantly with series compensation and it may be greater than the line-to-ground fault current towards the boundary of the line.
2) In a typical series compensation arrangement, the metal oxide varistor (MOV) is used to protect the ca-pacitor from over-voltages during a fault. However, it acts non-linearly during faults and increases the com-plexity of the protection problem.
3) Voltage and current inversions.
4) The voltage and current signals produced on the transmission line contain different frequency components such as non fundamental decaying as well as decaying DC components due to resonance between the system inductance and series capacitor, odd harmonics due to MOV conduction during faults, sub-synchronous fre-quencies having frequency components varying around half the fundamental frequency value, high frequency components caused by resonance between line capaci-tance and line induccapaci-tance and fundamental components of the steady state fault current.
The proposed algorithm is more general it uses voltage
and current signals recorded at one end of the line with no need for synchronization and is independent of modes of operation of FACTS devices. The proposed algorithm is simple and applied to both symmetrical and unsym-metrical faults with no need for pre-trained NN.
For the purpose of fault identification and classifica-tion, the wavelet entropy theory is applied to produce a simple and accurate algorithm. Wavelet transform (WT) has good time-frequency localization ability so it par-ticularly adapted to analyze the singular signals caused by fault. Wavelet transform provides theory basis for fault detection. The most effective method for fault de-tection is using a universal applicable quantity (UAQ) to describe the system and detect the fault. Shannon entropy is such a UAQ, and wavelet entropy (WE) is formed by combining WT and Shannon entropy together [17]. A combination of wavelet and entropy, could exploit the advantages of both methods to describe the characteris-tics of a signal. This is because wavelet meets the de-mands of transient signal analysis and entropy is ideal for the measurement of uncertainty.
In [18], the proposed algorithm was applied to a non-compensated transmission line. Therefore, current waveforms only are used. In this paper due to the pres-ence of FACTS devices the steady-state and transient components of current and voltage signals are much af-fected which create problems with fault detection, classi-fication and phase selection. The faulted phase couldn’t be determined using current waveforms coefficients only. For this reason, the three phase voltages waveforms are also needed to determine the phase included in fault in case of SLG fault after the compensating device. That is why the proposed algorithm in this paper, although it is simple, it is more detailed and complicated than that in-troduced in [18].
In this paper, a test system is built using SIMULINK. The resulting data under different fault types and posi-tion with respect to the compensating device are ana-lyzed using the modified WE algorithm than that in [18] to consider the system compensation. The test results show the effectiveness of the proposed algorithm.
2. Wavelet Transform and Entropy
Calculations
Lots of fault information is included in the transient components. So it can be used to identify the fault or abnormity of equipments or power system. It can also be used to deal with the fault and analyze its reason. This way the reliability of the power system will be consid-erably improved.
A. M. El-ZONKOLY ET AL. 36
m
capable of revealing aspects of data that other signal analysis techniques miss and it satisfies the analysis need of electric transient signals. Usually, wavelet transform of transient signal is expressed by multi-revolution de-composition fast algorithm which utilizes the orthogonal wavelet bases to decompose the signal to components under different scales. It is equal to recursively filtering the signal with a high-pass and low-pass filter pair. The approximations are the high-scale, low-frequency com-ponents of the signal produced by filtering the signal by a low-pass filter. The details are the low-scale, high- frequency components of the signal produced by filtering the signal by a high-pass filter. The band width of these two filters is equal. After each level of decomposition, the sampling frequency is reduced by half. Then recur-sively decompose the low-pass filter outputs (approxi-mations) to produce the components of the next stage [19,20].
Given a discrete signal x(n), being fast transformed at instant k and scale j, it has a high-frequency component coefficient Dj(k) and a low-frequency component coeffi-cient Aj(k). The frequency band of the information con-tained in signal components Dj(k) and Aj(k), obcon-tained by reconstruction are as follows [21].
1
1
: 2 , 2
1, 2, , : 0, 2
j j
j s s
j
j s
D k f f j A k f
(1)
Where, fs is the sampling frequency.
The original signal sequence x(n) can be represented by the sum of all components as follows [21].
1 1 1 2 2
1
J
j J
j
x n D n A n D n D n A n
D n A n
(2)Various wavelet entropy measures were defined in [19]. In this paper, the nonnormalized Shannon entropy will be used. The definition of nonnormalized Shannon entropy is as follows [21].
log
j jk jk
k
E
E E (3)Where Ejk is the wavelet energy spectrum at scale j and instant k and it is defined as follows.
2jk j
E D k (4)
3. Proposed Algorithm for Transmission
Line Fault Detection and Identification
During fault, the amplitude and frequency of the test signal will change significantly as the system change
from normal state to fault. The Shannon entropy will change accordingly. It becomes incapable of dealing with some abnormal signals while wavelet can. Wavelet combined entropy can make full use of localized feature at time-frequency domains. Wavelet analysis deals with unsteady signal while information entropy expresses information of the signal. That is why wavelet entropy can analyze fault signals more efficiently [17,19,20].
The proposed algorithm detects if there is a fault or the compensated system is under normal conditions. It also determines the position of the fault if it is after or before the compensating device. In addition, the algorithm de-termines the type of fault if it is a single line to ground (SLG) fault, line to line (L-L) fault, double line to ground (DLG) fault or a three line to ground (3LG) fault. Finally, the algorithm selects the phases involved in the fault.
The transient signals of the three phase currents and voltages are produced using the simulation model built with the power block set of the SIMULINK. A discrete wavelet transformation is performed using two level symmetric wavelet for the three phase current signals (ia, ib and ic) and the ground current ig, where
g a b c
i i i i (5)
The entropy of each coefficient of the four currents is then calculated. The sum of absolute entropies of such coefficients for each current is then calculated (suma, sumb, sumc and sumg). The sums related to the three phase currents are then arranged to determine the maxi-mum sum (max1) the minimaxi-mum sum (min1) and the in-termidiate sum (max2).
The wavelet and entropy calculation are performed also for the three phase voltages in case the algorithm detected a single line to ground fault after the compen-sating device. The entropy sums of the three phase volt-ages are used to determine which phase is included in the fault.
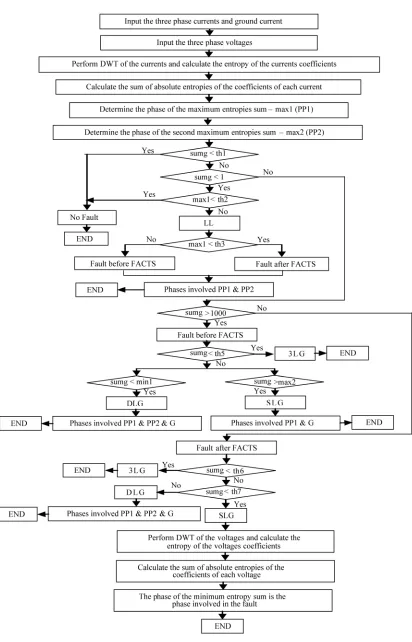
The proposed algorithm is applied in three main steps. First, the fault is detected then its type and position with respect to the compensating device are determined. Fi-nally, the phases included in the fault are identified. A detailed flow chart of the proposed algorithm is shown in Figure 1 which proceeds as follows:
If sumg < th1 a No Fault condition is declared. If sumg > th1 and sumg < 1 then check on max1
If max1 < th2 a No Fault condition is declared Else if max1 > th2 then it is a LL Fault. Further check max1 to determine the fault position with respect to the FACTS device where,
If max1 < th3 then the fault is after the FACTS device
A. M. El-ZONKOLY ET AL. 37
[image:4.595.93.505.70.712.2]
A. M. El-ZONKOLY ET AL.
38
If sumg > th1 but sumg > 1 then check sumg again where,
If sumg > 1000 then the fault is before the FACTS device
Else the fault is after.
To determine the fault type whether it is after or before the FACTS device proceed as in the fol-lowing steps.
For a fault before the FACTS device, If sumg < th5 then it is a 3LG Fault Else if sumg > th5 then check
if sumg > max2 then it is a SLG Fault else if sumg < min1 then it is a DLG Fault. For a fault after the FACTS device,
If sumg < th6 then it is a 3LG Fault Else if sumg > th6 then check
If max1 > th7 then it is a DLG Fault Else it is a SLG Fault.
Finally, after determining the location and type of each fault, the phases involved in each fault is de-termined as follows,
- for a LL fault the phases involved in the fault will be PP1 and PP2.
- for a DLG fault the phases involved in the fault will be PP1 and PP2 in addition to ground. - for a SLG fault before the FACTS device the
phase involved in the fault will be PP1. - for a SLG fault after the FACTS device the
se-lection of the phase included in fault was not possible using sum of currents entropies. There-fore, the sum of entropies of the coefficients of each of the phase voltages were calculated and the phase with the minimum sum was consid-ered as the faulted phase.
4. Test System
Using the power system blockset (PSB) and the SIMU-LINK software, the test system is simulated. The test system is shown in Figure 2 and its data are listed in the Appendix.
5. Simulation Results
As mentioned before the test system was compensated by two different FACTS devices, SSSC and UPFC. In the following the simulation results of the system with the SSSC are given first then the results with the UPFC are given next. The simulation frequency was 10 kHz.
5.1. System Compensated with SSSC
For different fault types before and after the SSSC the
FACTS Device
Vdc
Area 1 Area 2
L 1
L 2 L 3
L 4 L 5
S
Trans 1
Trans 2
T.L. 1 T.L. 2
B1 B2
B3
B4
B5
Figure 2. Power system model.
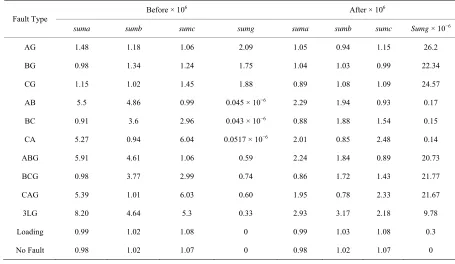
sum of absolute entropies of the coefficients of each cur-rent is given in Table 1.
As shown in Table 1, in case of no fault or in case of connecting extra load (L5) to the system, sumg was less than th1which is equal to 1 × 10⁻⁸ for faults either before or after the FACTS device. It was also noticed that in case of SLG fault after the SSSC the selection of the phase included in fault was not possible using sum of currents entropies as it is in case of fault before the SSSC. For example, for an AG fault before the SSSC, suma is greater than sumb and sumc. However, for an AG fault after the SSSC, suma is greater than sumb but not sumc. Therefore, the sum of entropies of the coefficients of each of the phase voltages were calculated and the phase with the minimum sum was considered as the faulted phase. The sum of entropies of the coefficients of the phase voltages in case of a SLG fault after SSSC are given in Table 2. As shown in Table 2, for an AG fault after the SSSC, suma is less than sumb and sumc.
As a sample, the waveforms of the three phase cur-rents in case of 3 LG fault before the SSSC are shown in Figure 3. The wavelet coefficients (approximate A2, level 1 detail D1 and level 2 detail D2) of phase A cur-rent are shown in Figure 4. In the same way, the wave-forms of the three phase currents in case of 3 LG fault after the SSSC and the wavelet coefficients of phase A current are shown in Figure 5 and Figure 6.
5.2. System Compensated with UPFC
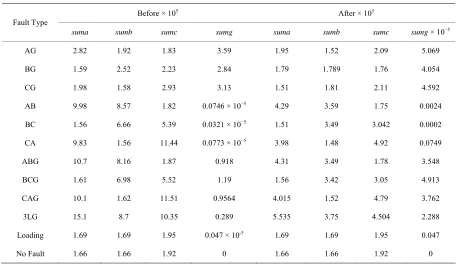
For different fault types before and after the UPFC the sum of absolute entropies of the coefficients of each cur-rent is given in Table 3.
A. M. El-ZONKOLY ET AL. 39
[image:6.595.58.534.85.505.2]
Table 1. The sum of absolute entropies of the coefficients of each current before and after SSSC.
Before × 106 After × 106
Fault Type
suma sumb sumc sumg suma sumb sumc Sumg ×10−6
AG 1.48 1.18 1.06 2.09 1.05 0.94 1.15 26.2
BG 0.98 1.34 1.24 1.75 1.04 1.03 0.99 22.34
CG 1.15 1.02 1.45 1.88 0.89 1.08 1.09 24.57
AB 5.5 4.86 0.99 0.045 × 10⁻⁶ 2.29 1.94 0.93 0.17
BC 0.91 3.6 2.96 0.043 × 10⁻⁶ 0.88 1.88 1.54 0.15
CA 5.27 0.94 6.04 0.0517 × 10⁻⁶ 2.01 0.85 2.48 0.14
ABG 5.91 4.61 1.06 0.59 2.24 1.84 0.89 20.73
BCG 0.98 3.77 2.99 0.74 0.86 1.72 1.43 21.77
CAG 5.39 1.01 6.03 0.60 1.95 0.78 2.33 21.67
3LG 8.20 4.64 5.3 0.33 2.93 3.17 2.18 9.78
Loading 0.99 1.02 1.08 0 0.99 1.03 1.08 0.3
[image:6.595.67.522.96.360.2]No Fault 0.98 1.02 1.07 0 0.98 1.02 1.07 0
[image:6.595.62.285.553.693.2]Figure 3. Three phase current waveforms during 3LG fault before the SSSC.
Figure 5. Three phase current waveforms during 3LG fault after the SSSC.
Figure 6. Approx. and details of phase A current during 3LG fault after SSSC.
[image:6.595.313.536.554.694.2]A. M. El-ZONKOLY ET AL. 40
Table 2. The sum of entropies of the coefficients of the phase voltages in case of a SLG fault after SSSC.
Fault Type sum a sum b sum c
AG 3.4885 × 10³ 3.5568 × 10³ 3.5539 × 10³
BG 3.5476 × 10³ 3.5149 × 10³ 3.5551 × 10³
CG 3.5418 × 10³ 3.5631 × 10³ 3.5022 × 10³
fault before the UPFC, sumb is greater than suma and sumc. However, for an BG fault after the UPFC, sumb is greater than sumc but not suma. For this reason, as i
lated and the phase with the minimum sum was considered as the faulted phase. The f entrop the coefficients of
the phase voltag a af e
given i ble 4 , fo
after t PFC, s th nd
As a sample, rm re
r-nts in case of 3LG fault before the UPFC are shown in n case of SSSC compensation, the phases included in a SLG fault after the UPFC were determined using the voltage entropies. The sum of entropies of the coeffi-cients of each of the phase voltages were calcu
sum o ies of
es in case of SLG fault ter UPFC ar n Ta
he U
. As shown in sumb is les
Table 4 an suma a
r a BG fault sumc. the wavefo s of the th e phase cu re
Figure 7. The wavelet coefficients (approximate A2, level 1 detail D1 and level 2 detail D2) of phase A cur-rent are shown in Figure 8. In the same way, the wave forms of the three phase currents in case of 3LG fault after the UPFC and the wavelet coefficients of phase A current are shown in Figure 9 and Figure 10.
[image:7.595.58.285.105.176.2]Figure 7. Three phase current waveforms during 3LG fault before the UPFC.
[image:7.595.313.534.273.399.2]Figure 8. Approx. and details of phase A current during 3LG fault before UPFC.
Table 3. The sum of absolute entropies of the co
Before × 105
efficients of each current before and after UPFC.
After × 105
Fault Type
suma sumb sumc sumg suma sumb sumc sumg × 10−5
AG 2.82 1.92 1.83 3.59 1.95 1.52 2.09 5.069
BG 1.59 2.52 2.23 2.
CG 1.98 1.58 2.93 3.13
AB 9.98 8.57 1.82 0.0746
BC 1.56 6.66 5.39 0.0321
CA 9.83 1.56 11.44
84 1.79 1.789 1.76 4.054
1.51 1.81 2.11 4.592
× 10−5 4.29 3.59 1.75 0.0024
× 10−5 1.51 3.49 3.042 0.0002
0.0773 × 10⁻⁵ 3.98 1.48 4.92 0.0749
ABG 3.548
BCG 1.61 6.98 1.19 1.56 3.42 3.05 4.913
0.
3LG 15.1 8.7 10.35 0.289 5.535 3.75 4.504 2.288
Loading 1.69 1.69 1.95 0.047 × 10⁻⁵ 1.69 1.69 1.95 0.047
No Fault 1.66 1.66 1.92 0 1.66 1.66 1.92 0 10.7 8.16 1.87 0.918 4.31 3.49 1.78
5.52
[image:7.595.69.528.459.727.2]A. M. El-ZONKOLY ET AL. 41
[image:8.595.58.284.101.333.2]
Table 4. The sum of opies e coe ts of the phase voltages in case of er UP
Fault Type sum a sum b sum c
entr
a SLG fault aft
of th fficien FC.
AG 652.423 673.6073 517 673.
BG 666. 51 674.0677
CG 663. 866 661.2325 0345 662.10
4631 674.5
Figure ree ph t wavefo
after t PFC. 9. Th he U
ase curren rms during 3 LG fault
Figure 10. Approx. and details of phase A current during 3LG fault after U
erg
PFC.
6. Conclusion
As shown in the paper, the proposed algorithm was very accurate and simple in the same time. The algorithm succeeded in detecting the fault, determining its type and position with respect to compensating device and id fying the phases included in fault. Test results showed the effectiveness of the proposed algorithm under any type and position of fault.
7. References
[1] E. Uzunovic, “EMTP Transient Stability and Power Flow
Models and Cont f VSC Based FACTS Controllers,” Ph.D rtation, rsity Waterloo,
200
B. Geethalakshm P. Da of Performance of U withou ink C r,” In-ternational Journal of Electric Power Systems Research, Vol. 78, No. 4, April 2007, pp
epsr.2007.05.019
[3] P. K. Dash and S. R. Samant Phase and Fault Section Identifi ation in T
Compensated Line Using Disc avele ,” International Journal of Electrical Power & Energy Sys-tem . 26, N eptemb 4, pp. doi: 10.1016/j.ijepes.2004.05.005
[4] A. I. Megahed, A. Monem Mo youmy, “Usage of Wavelet Transform in the Protection of Se-ries-Compensated Transmission Lines,” IEEE
Transac-] J. Sadeh and A. Adinehzadeh, “Accurate Fault Location e in the Presence of FACTS Devices,” International Journal of Electrical Power & Energy Systems, Vol. 32, No. 4,
] S. R. Samantray and P. K. Dash, “Pattern Recognition Relaying for Advanced Series Compen-ternational Journal of Electrical Power & Energy Systems, Vol. 30, No. 1, February 2008, pp. 102-
ternational Journal of Electrical Power &
En-d on Wavelet Entropy anEn-d Neural Net
enti- sis Method,” International
Journal of Electrical Power & Energy Systems, Vol. 31, No. 5, June 2009, pp. 213-219
[11] A. A. Eisa and K. Ramar, “Accurate One-End Fault Lo-cation for Overhead Transmission Lines in Intercon-nec
rols o Unive
. Disse of Waterloo, 1.
[2] i, and PFC
nanjayan, “Investigation t DC L apacito
. 736-746. doi:10.1016/j.
ray, “ hyristor Con
Selection trolled Series c
rete W t Transform
s, Vol o. 9, S er 200 725-732.
ussa and A.E.Ba
tions on Power Delivery, Vol. 21, No. 3, July 2006, pp. 1213-1221. doi:10.1109/TPWRD.2006.876981
[5
Algorithm for Transmission Lin ries Connected
May 2010, pp.323-328. doi:10.1016/j.ijepes.2009.09.001 [6] S. R. Samantaray, P. K. Dash and S. K. Upadhyay,
“Adaptive Kalman Filter and Neural Network Based High Impedance Fault Detection in Power Distribution Networks,” International Journal of Electrical Power & Energy Systems, Vol. 31, No. 4, May 2009, pp. 167-172. doi:10.1016/j.ijepes.2009.01.001
[7
Based Digital sated Line,” In
112. doi:10.1016/j.ijepes.2007.06.018
[8] S. Suja and J. Jerome, “Pattern Recognition of Power Signal Disturbances Using S Transform and TT Trans-form,” In
y System, Vol. 32, No. 1, January 2010, pp. 37-53. doi: 10.1016/j.ijepes.2009.06.012
[9] Z. He, S. Gao, X. Chen, J. Zhang, Z. Bo and Q. Qian, “Study of a New Method for Power System Transients Classification Base
work,” International Journal of Electrical Power & Energy Systems, Article in Press, 2010. doi:10.1016/j. ijepes.2010.10.001
[10] P. S. Bhowmik, P. Purkait and K. Bhattacharya,” A Novel Wavelet Transform Aided Neural Network Based Transmission Line Fault Analy
Classifi-A. M. El-ZONKOLY ET AL. 42
ine Using Support
Fault
Classifi-im, M. M. Mansour and H.
d Its Application for Transmission Line
Principle in Fault Classification”, International
e
G. M. Luo, “Wavelet Entropy
R. Y. Liu, “Applications of
En-Voltage: 13.8 kV
Leakage Resistance: 0.002 pu Leakage Reactance: 0.08 pu
ransformer 2 (Y/Y): Rated Voltage: 735/230 kV Rated Power: 300 MVA Leakage Resistance: 0.002 pu
Reactance: 0.0195 pu d
s: 48 pulse Series Coupling Transformer (Y/Y):
Rated Voltage: 138/147 kV
Rated Power: 100 MVA
Leakage Resistance: 0.002 pu
cation Technique for Series Compensated Transmission Defi Line Using Support Vector Machine,” International
Jour-nal of Electrical Power & Energy Systems, Vol. 32, No. 6, July 2010, pp.629-636.
[13] P. K. Dash, S. R. Samantray and G. Panda, “Fault Classi-fication and Section IdentiClassi-fication of an Advanced Se-ries-Compensated Transmission L
tor Machine,” IEEE Transactions on Power Delivery, Vol. 22, No. 1, January 2007, pp. 67-73. doi:10.1109/TPWRD. 2006.876695
[14] A. K. Pardhan, A. Routray, S. Pati and D. K. Pardhan, “Wavelet Fuzzy Combined Approach for
cation of a Series-Compensated Transmission Line,” IEEE Transactions on Power Delivery, Vol. 19, No. 4, October 2004, pp. 1612-1618. doi:10.1109/TPWRD.2003. 822535
[15] A. Y. Abdelaziz, A. M. Ibrah
Faul
E. Talaat, “Modern Approaches for Protection of Se-ries-Compensated Transmission Lines,” International Journal of Electric Power Systems Research, Vol. 75, No. 1, July 2005, pp. 85-98. doi:10.1016/j.epsr.2004.10.016 [16] M. El-Moursi, A. M. Sharaf and K. El-Arroudi, “Optimal
Control Schemes for SSSC for Dynamic Series Compen-sation,” International Journal of Electric Power Systems Research, Vol. 78, No. 4, April 2008, pp. 646-656. doi:10. 1016/j.epsr.2007.05.009
[17] Z. Y. He, X. Q. Chen and G. M. Luo, “Wavelet Entropy
nition an
Short Circuit Capacity: 21000 MVA Area 2: Rated Voltage: 735 kV
Short Circuit Capacity: 30000 MVA Transformer 1 (/Y): Rated Voltage: 13.8/735 kV
Rated Power: 2100 MVA
Fault Detection and Identification (Part II: Fault Detec-tion in Transmission Line),” Proceedings of International Conference on Power System Technology, Chongqing, October 2006, pp. 1-5.
[18] S. El-Safty, and A. M. El-Zonkoly, “Applying Wavelet Entropy
Journal of Electrical Power & Energy Systems, Vol. 31, No. 10, November-December 2009, pp. 604-607. doi:10. 1016/j.ijepes.2009.06.003
[19] Z. Y. He, X. Q. Chen and G. M. Luo, “Wavelet Entropy Definition and Its Application for Transmission Lin
t Detection and Identification (Part I: Definition and Methodology),” Proceedings of International Conference on Power System Technology, Chongqing, October 2006, pp. 1-5.
[20] Z. Y. He, X. Q. Chen and
Definition and Its Application for Transmission Line Fault Detection and Identification (Part III: Transmission Line Faults Transients Identification),” Proceedings of International Conference on Power System Technology, Chongqing, October 2006, pp. 1-5.
[21] Z. M. Li, W. X. Li and
tropy Principles in Power System: A Survey,” IEEE/PES Transmission and Distribution Conference and Exhibi-tion, Dalian, August 2005, pp. 1-4.
Appendix
System Parameters of Figure 2 (Base MVA = 100)
Area 1: Rated
T
Leakage Reactance: 0.15 pu Transmission Lines: Resistance: 0.001 pu
Loads: Loa 1: 100 MW
Loads 2 and 3: 1.32 MW, 330MVAR
Load 4: 250MW Load 5: 300MW
SSSC: Rated Power: 100 MVA
Nominal DC Voltage: 20 kV
Nominal AC Voltage: 138 kV
Number of Pulses: 48 pulse UPFC: SSSC and STATCOM each;
Rated power: 100 MVA
Nominal DC Voltage: 20 kV
Nominal AC Voltage: 138 kV
Number of Pulse
Leakage Reactance: 0.05 pu Shunt Coupling Transformer (Y/Y):
Rated Voltage: 138/735 kV
Rated Power: 100 MVA