Accepted Manuscript
Synthesis, Characterization, X-ray crystallography and DNA binding activities of Co(III) and Cu(II) complexes with a pyrimidine-based Schiff base ligand
Rajesh Pradhan, Milon Banik, David B. Cordes, Alexandra M.Z. Slawin, Nitis Chandra Saha
PII: S0020-1693(15)00569-1
DOI: http://dx.doi.org/10.1016/j.ica.2015.11.015
Reference: ICA 16773
To appear in: Inorganica Chimica Acta
Received Date: 8 August 2015
Revised Date: 6 November 2015
Accepted Date: 12 November 2015
Please cite this article as: R. Pradhan, M. Banik, D.B. Cordes, A.M.Z. Slawin, N.C. Saha, Synthesis, Characterization, X-ray crystallography and DNA binding activities of Co(III) and Cu(II) complexes with a
pyrimidine-based Schiff base ligand, Inorganica Chimica Acta (2015), doi: http://dx.doi.org/10.1016/j.ica.
2015.11.015
Synthesis, Characterization, X-ray crystallography and DNA binding activities
of Co(III) and Cu(II) complexes with a pyrimidine-based Schiff base ligand
Rajesh Pradhan a, Milon Banik b, David B. Cordes c, Alexandra M.Z. Slawin c,Nitis Chandra Saha a,*
a
Department of Chemistry, University of Kalyani, Kalyani-741 235, India
b
Department of Biochemistry & Biophysics, University of Kalyani, Kalyani-741 235, India
c
School of Chemistry, University of St Andrews, North Haugh, St Andrews, Fife, KY16 9ST U.K.
Abstract
A new pyrimidine based ‘NNO’ tridentate ligand
2,4-dihydroxyacetophenone-4,6-dimethyhydrazino pyrimidine (H2MHyP) (complex I) has been synthesized and characterized by
elemental analyses, mass, IR 1H NMR spectra and X-ray crystallographic studies. The
Coordination mode of the synthesized ligand has been established by solid state isolation and
physico-chemical identification of Co(III) and Cu(II) complexes, [Co(HMHyP)2]Cl (complex II),
[Co(HMHyP)2]Br (complex III) and [Cu(HMHyP)]NO3 (complex IV) respectively. All the
reported coordination complexes are 1:1 electrolytic cationic species and the ligand behaves as a
monodeprotonated ‘NNO’ tridentate one in all the complex species. IR spectral data indicate that
the coordination of each of the metal centre of the complexes occurs through the pyrimidine
nitrogen, azomethine nitrogen and hydroxyl oxygen atoms. X-ray crystallographic data have
authenticated a CoN4O2 octahedral coordination for II and III (Triclinic (P-1) and Monoclinic
(P21/n), respectively) and a CuN2O2 square planar coordination for IV (Triclinic (P-1)). All the
synthesized compounds were tested for their DNA binding abilities and their mode of binding with
DNA.Compounds II, III & IV show potential DNA binding activities with Salmon Testis DNA.
Keywords: Pyrimidine, Co(III), Cu(II), Crystal structures, Binding constant, Salmon Testis DNA ________________________________________________________________
1. Introduction
Bioinorganic chemistry is a fast developing field of modern chemistry that uses Schiff bases and
their transition metal complexes for a variety of applications, e.g. in biological, medical, and
environmental sciences [1]. The Schiff base ligands are quite popular because they are easily
prepared by the condensation between carbonyl compounds and amines and also have some
biochemical and analytical importance [2]. Hydroxy acetophenone can be used as primary
compound for the synthesis of chalcones [3], flavones [4] etc. Schiff bases of Hydroxy aldehydes
or, ketones are extensively used as coordinating ligands for the synthesis of metal complexes. Over
the past decade, the syntheses of therapeutically active heterocyclic molecules have become one of
the main areas of interest in synthetic chemistry [5]. These important structures have gained much
consideration, because they are potentially active ligands and as well as of their binding capability
towards various biological targets. Among these heterocycles, pyrimidines and their derivatives
show various biochemical and agricultural applications [6]. Uracil (2,4-dihydroxypyrimidine) and
thiamine (5-methyluracil) have immense importance in metabolism because these derivatives are
basic units for RNA and DNA [7]. Pyrimidine ring systems in nucleic acids, vitamins and
co-enzymes have some effective binding sites for metal ions. The presence of more than one hetero
atom and the higher π acidity of the pyrimidine rings as compared to that of pyridine bases play an
important role in coordination chemistry, and also serve as a better model in biological systems
[8-10].
In the present communication, we have reported the syntheses, spectral and structural
characterizations of a new NNO tridentate Schiff base ligand (H2MHyP) using
details of DNA binding activities and mode of DNA binding of these complexes have also been
reported.
2. Experimental
2.1 Reagents and instrumentation
All the reagents used were of AR grade and obtained from commercial sources and used without
purification. Sodium salt of Salmon Testis DNA was purchased from Sigma-Aldrich. Spectrograde
solvents were used for spectral measurements. Elemental analyses (C, H and N) were done with a
Perkin-Elmer 2400 CHNS/O analyzer. The cobalt and copper contents of the complexes were
determined gravimetrically as anhydrous CoSO4 and iodometrically, respectively. Electronic
spectra were recorded on a Shimadzu UV-2401PC spectrophotometer. IR spectra (4000–450 cm-1)
were recorded on a Perkin-Elmer L120-000A FT-IR spectrophotometer with KBr pellets. The
molar conductance of the complexes in methanol were measured with a Systronics 304 digital
conductivity meter. 1H NMR spectrum of the ligand was recorded in DMSO-d6 with a Bruker AC
400 superconducting FT NMR. High resolution mass spectroscopy (HRMS) was performed with a
waters XEVO G2-S QTof mass spectrometer. A Rigaku FR-X Ultrahigh Brilliance Micro focus
RA generator and Rigaku XtaLAB P200 system diffractometer was used to collect X-ray data of
the complexes. Fluorescence measurements were done with a Perkin Elmer LS 55 Fluorescence
spectrometer. Viscosity measurements were done with a Brookfield DV-II + Pro v6.3 Viscometer.
2.2. Syntheses
2.2.1. Synthesis of the ligand, H2MHyP (Compound I)
2,4-dihydroxyacetophenone-4,6-dimethyhydrazino pyrimidine, H2MHyP [Fig. 1] was synthesized
dihydroxyacetophenone in dry ethanol involving conversion of dihydroxy acetophenone into its
hydrazino pyrimidine derivative. A red crystalline solid was obtained after slow evaporation of the
solvent. Crystals suitable for X-ray diffraction were obtained on slow evaporation of the
compound I in ethanol. Yield of ca. 70–75% (m.p.: 182-183°C). Anal. Calcd for C14H16N4O2: C,
61.7; H, 5.9; N, 20.6. Found: C, 60.8; H, 5.5; N, 19.8%. IR (KBr) (cm-1) : 1625 (CH=N), 3432
(C-OH). 1H NMR (DMSO-d6)δ (ppm): 13.55 (1H, C10-OH), 10.46 (1H, C8-OH), 9.66 (1H, NH-
hydrazine), 6.67 (1H, pyrimidine), 2.31(6H, 2-CH3 pyrimidine), 2.26 (3H, C5-CH3). HRMS m/z:
Calcd. for C14H17N4O2 [M+H]+ 273.136, found 272.1358.
2.2.2 Syntheses of complexes II and III
The reported Co(III) complexes have been prepared by refluxing ethanolic solution of the title
ligand (I) (1.05mM) and CoCl2.6H2O or CoBr2.6H2O (0.525mM) in water bath for ~1 hr in
presence of air. Dark brown coloured solution in both the cases, were obtained. On slow
evaporation of the resulting solutions, the desired Co(III) complex, in each case, was separated out.
The dark brown solids, in both the cases were filtered off, washed with cold ethanol and dried over
anhydrous CaCl2. Dark red crystals, in both the cases, were obtained from ethanol/ hexane mixture
by slow diffusion, found suitable for X-ray crystallography. Anal. Calcd for C28H32N8O5CoCl (II):
C, 51.3; H, 4.9; N, 17.1; Co, 8.9. Found: C, 50.9; H, 4.3; N, 16.8; Co, 8.8%. IR (KBr) (cm-1):
1637 (CH=N), 3515 (C-OH). UV–Visible (DMSO, λmax, nm): 634 ( 1 A1g→3T2g), 375 (1A1g → 1
T1g ),
325(1
A1g → 1
T2g), 265 (n→ π
*
), 219 (π→ π*). DRS (λmax, nm): 653 (1A1g→3T2g), 412 (1A1g →1T1g),
378 (1A1g →1T2g). 1H NMR (DMSO-d6) δ (ppm): 13.06 (1H, OH), 9.654 (1H, NH- hydrazine),
2.506 (6H, 2-CH3, pyrimidine), 2.27 (3H, C5-CH3). HRMS m/z: Calcd. for C28H30N8O4Co [M-Cl]+
Anal. Calcd for C30H36N8O5CoBr (III): C, 49.5; H, 4.9; N, 15.4; Co, 8.1. Found: C, 48.8; H, 4.5;
N, 14.9; Co, 7.9%. IR (KBr) (cm-1): 1639 (CH=N), 3497(C-OH). UV–Visible (DMSO, λmax, nm) :
633 (1A1g→3T2g), 365 (1A1g → 1
T1g ), 310 (1
A1g → 1
T2g), 265 (n → π
*
), 220 (π→ π* ). DRS (λmax,
nm): 650 (1A1g→3T2g), 410 (1A1g →1T1g), 376 (1A1g →1T2g). 1H NMR (DMSO-d6)δ (ppm): 13.0
(1H, OH), 9.52 (1H, NH-hydrazine), 2.504 (6H, 2-CH3, pyrimidine), 2.23 (3H, C5-CH3). HRMS
m/z: Calcd. for C28H30N8O4Co [M-Br]+ 601.19, found 601.1763.
2.2.3 Synthesis of compound IV
The Cu(II) complex reported here, has been prepared by refluxing an equimolar (1.05mM) mixture
of (I) and Cu(NO3)2.3H2O in ethanol for ~1hr. in a water bath. On slow evaporation of the
resulting solution, reddish crystalline solids separated out, were filtered off, washed with cold
ethanol and dried over anhydrous CaCl2. Red brown crystals obtained from acetone/ hexane
mixture were found to be suitable for X-ray diffraction. Anal. Calcd for C14H21CuN5O8: C, 37.3;
H, 4.7; N, 15.5; Cu, 14.1. Found: C, 36.9; H, 4.3; N, 15.2; Cu, 13.8%. IR (KBr) (cm-1): 1611
(CH=N). UV–Visible (DMSO, λmax, nm): 650 (2B1g →2A1g). DRS (λmax. nm): 600 [B2(xy) → A1(x2
-y2)]. HRMS m/z: Calcd. for C14H15N4O2Cu [M-(NO3+H2O)]+ =334.66, found 334.0493.
2.3 Single crystal X-ray diffraction study
Data for compounds I to IV were collected on a Rigaku FR-X Ultrahigh Brilliance Micro focus
RA generator /confocal optics and Rigaku XtaLAB P200 system with Mo-Kα radiation (λ =
0.71073 Å). Intensity data were collected using ω steps accumulating area detector images
spanning at least a hemisphere of reciprocal space. All data were corrected for Lorentz polarization
solved by direct methods (SIR 2004 [14] or SIR 2011 [15]) and refined by full-matrix least-squares
against F2 (SHELXL-2013 [16]). All hydrogen atoms were assigned riding isotropic displacement
parameters and constrained to idealize geometries, except those bound to N or O, which were
located from the difference Fourier map and refined subject to a distance restraint. Hydrogen
atoms could not be located for one of the water solvent molecules in IV. Neutral atom scattering
factors were taken from International Tables for Crystallography (IT), Vol. C, Table 6.1.1.4 [17].
Anomalous dispersion effects were included in Fcalc [18]. All calculations were performed using
the Crystal Structure [19] interface, and figures were drawn using OLEX2 [20].
2.4 DNA binding study
2.4.1. UV-Visible spectroscopic Study
The spectrophotometric studies were performed at 30oC in Shimadzu (UV-2401PC)
spectrophotometer using 1 cm path length rectangular quartz cuvette. To monitor the changes in
absorption spectrum of DNA due to addition of complex II, III and IV, all of them was added
gradually in each of the sample (containing DNA) and reference cuvettes. The absorbance of each
complex (due to scattering) was systematically neglected by the addition of the same amount of
complex in both suspensions of the cuvettes. Thereby, contribution due to scattering of compounds
in DNA spectra was automatically nullified.
The interaction of the complex with the DNA was analyzed by the famous Hill equation [21]
This is stated below, Log (Z / (1-Z)) = Y Log Kb+ Y Log [Cf]---[1],
Where, Z=(A0-Ai)/(A0-Af) where, where A0 is the (absorbance) 260 nm of DNA in the absence of
complex, Ai the (absorbance) 260 nm of DNA at any complex concentration, and Af the
and Kb were the free complex concentration and binding constant respectively. Moreover, Y is the
co-operativity of the interaction of complex with respect to the DNA. The value as well sign both
were important for the determination of the binding nature of the interaction. From the slope, the Y
could be calculated which, was further used to determine the Binding constant using intercept of
the equation. The importance of Y was that it characterized nature of co-operativity, that is, Y <1
signified negative co-operative nature of binding, Y = 1 signified non-co-operative nature of
binding, and Y > 1 signified positive co-operative nature of binding [21].
2.4.2. Spectrofluorimetric study
The fluorescence quenching measurements were done by using Perkin Elmer LS 55 Fluorescence
spectrometer. Both the compounds as well as free DNA have no characteristic fluorescence. But
intercalation of EB increased the fluorescence intensity which was used to observe the binding
behavior of DNA with respect to the compounds. The said Salmon Testis DNA were prepared in
sterile Tris buffer (50 mM, pH 7.5) of 1mg/ ml stock by mild sonication at 40C in presence of ice,
so that the linear DNA was broken into uniform size. Further the DNA was incubated with
saturating amount of EB (10 mg/ ml in sterile water) in dark for another 30 mins where, complete
intercalation of EB took place. Now the EB–DNA was excited at 480 nm and the emission was
monitored in between 500 to 700 nm with an emission maximum at around 600 nm. The emission
slit width (10 nm) and scan rate (200 nm /min) were kept constant for all the measurements.
In order to demonstrate the measure of the threshold DNA concentration and the binding constants,
the fluorescence data were further analyzed according to the simplified form of the Scatchard
equation [22]:
The Scatchard equation was plotted to measure the binding constant between bio-macromolecule
and compounds. Where, r= Cb/CDNA, Cb=Ct-Cf. Cf, Cb and Ct are the compounds
concentrations of free form, bound form and the total form respectively, Kb is the binding constant,
n is the number of binding sites expressed by DNA base pairs.
2.4.3. Viscometric study
In order to understand the mode of DNA complex interaction – intercalation or groove binding – a
viscometric study was carried out as the most authentic test [23]. Viscosity measurements were
carried out with a micro viscometer (Model Brookfield DVII+pro-v6.3) attached to a water-bath at
30oC. The viscosity of DNA in absence of any complex was first quantitated, followed by the
measurements after addition of increasing concentration of compounds (II, III and IV) into the
DNA up to its saturation separately. After each addition of complex, 1.5 min was allowed to attain
thermal equilibrium and then the viscosity was measured individually. The viscometric data was
calculated maintaining viscometric rotor stirring at 100 rpm and each measurement was repeated
three times in order to find out the average of value. The data were plotted as (η/η0)1/3 versus r,
where η and η0 signified the viscosity of DNA in the presence and absence of complex
respectively and r represented the molar ratio of complex: DNA.
3. Result and Discussion
3.1. Crystal structures of H2MHyP (I), [Co(HMHyP)2]Cl (II), [Co(HMHyP)2]Br (III) and
The molar conductance values in MeOH (30oC) indicate 1:1 electrolytic character of the
complexes [24] and conform to the general compositions, [Co(HMHyP)2]Cl (X= Cl and Br) and
[Cu(HMHyP)]NO3.
Views of the X-ray structures of the free ligand (H2MHyP) (I), and its metal complexes-
[Co(HMHyP)2]Cl (II), [Co(HMHyP)2]Br (III) and [Cu(HMHyP)]NO3 (IV) with atom numbering
scheme are shown in Figs 2, 3, 4 and 5, respectively. The crystallographic data and refinement
parameters are summarized in Table 1. The structure of the primary ligand molecule I has an
asymmetric unit comprising an H2MHyP molecule and a molecule of water of crystallization. The
structures of complexes II to IV have asymmetric units comprising a molecule of mononuclear
metal complex, anion and solvent of crystallization. Some selected bond distances and bond angles
of four structures are compiled and compared in Table 2. The structure of ligand (I) (Fig. 2) shows
that the neutral ONN tridentate ligand has a planar arrangement, with O1 and N4 positioned to
interact via an O–H···N hydrogen bond, and with the N3–N4 bond oriented to minimize steric
interactions between the pyrimidyl and N-methyl groups. The structures of compounds II and III
show that they adopt related distorted octahedral geometries, (Figs 3 & 4, respectively). In both
cases the Co(III) centers are coordinated in a N4O2 fashion by two mono-deprotonated ligands,
using pairs of cis pyrimidyl-N, trans-azomethine-N and cis- hydroxyl-O atoms. The two pyrimidyl
nitrogen atoms (N1 and N5) and two hydroxyl oxygen atoms (O1 and O3) are located in the square
plane, with the two azomethine nitrogen atoms (N4 and N8) occupying the axial positions, both
ligands binding in meridional fashion, and retaining a degree of planarity. One of the two ligands
in complex II appears to be showing a tautomeric form. Its C1–N2 bond distance [1.372(3) Å] is
longer than those observed for free ligand [1.3427(14)Å]; additionally, the C1-N3 bond [1.302(3)
changes in bond distances, combined with the inability to locate a hydrogen atom on N3 of one
ligand, instead finding it at N2, is indicative of the presence of double bond character for the
C1-N3 bond, and single bond character for the C1-N2 bond. No such significant bond shortening is
observed in either the second ligand of complex II or in complexes III and IV. The structure of
compound IV (Fig. 5) shows it adopting a distorted square-planar geometry. The Cu(II) centre is
coordinated in an N2O2 fashion by a mono-deprotonated ligand,using pyrimidyl-N, azomethine-N,
hydroxyl-O, as well as a coordinated water molecule. The deviation of Cu2+ from the square plane
is 0.0162(13) Å.
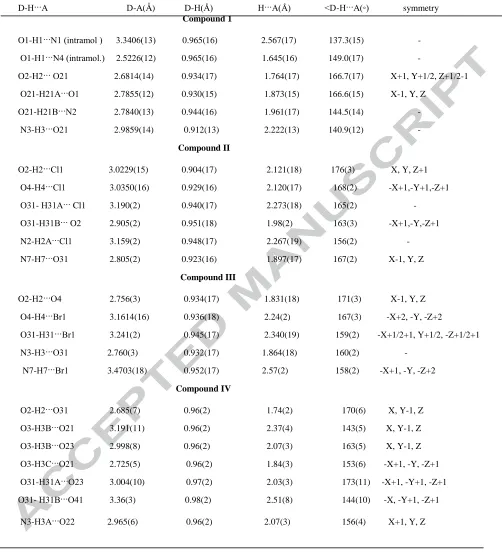
Table 3 gives the details of the hydrogen bonding interactions of the four reported compounds.
Each molecule of compound I is connected via two O–H···O hydrogen bonds to adjacent water
molecules, forming one-dimensional zigzag chains running along the crystallographic c-axis.
These chains are connected into 2D sheets in the ac plane by further O–H···N hydrogen bonds
between the water and one pyrimidine nitrogen (Fig. 6). In compound II, each molecule of the
complex is connected via two O–H···Cl and one Npyrimidyl–H···Cl hydrogen bonds to three adjacent
chloride anions, and via one Nhydrazinyl–H···O hydrogen bond to the adjacent water molecule. Each
chloride in turn is a total of four hydrogen-bonding interactions, two hydroxyl-OH, one
pyrimidyl-NH and one water-OH, while the water molecule acts as donor for two hydrogen bonds, one to
chloride, the other to one hydroxyl-O. This arrangement of interactions results in the formation of
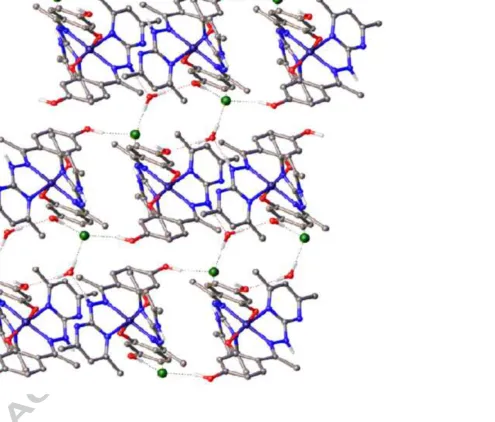
a topologically complex three-dimensional hydrogen-bonded network (Fig. 7). In contrast to
compound II, showing no hydrogen bonds between adjacent complexes, compound III forms
one-dimensional hydrogen-bonded chains propagating along the a-axis via O–H···O interactions
between O2 and O4. These chains are linked into two-dimensional sheets in the ac plane by two
hydrogens bonds (Fig. 8). In compound IV each complex is connected to an adjacent complex by
O-H···O hydrogen bonds between the coordinated water and two bridging nitrate anions, forming
a dinuclear hydrogen-bonded complex. These complexes are linked together by N–H···O
hydrogen bonds to form a double-layer zigzag chain running along the ab-diagonal axis. The two
water molecules are found to hydrogen bond at the periphery of this chain. Due to the inability to
locate hydrogen atoms on one water it is difficult to determine what forth hydrogen-bonding
interactions would arise from it, however its positioning suggests that the two water molecules
could be involved in interactions linking adjacent (Fig. 9).
3.2. DNA Interaction Studies
3.2.1. Stability of the complexes in solution
The solution spectrum (in DMSO) of each reported complex species is similar in nature with the
spectrum obtained in solid state (DRS), indicating no gross electronic or geometric change occurs
on dissolution of the complex in the solvent; the HRMS studies of all the compounds in methanol
showed satisfactory result in each case (data included in the text). Moreover, the stability of the
complex species in solution has been studied by taking UV-Vis spectra of each complex species
immediately after dissolution in the said solvent (zero hr) and after 48 hrs of incubation at RT. It
has been observed that in each case the spectral nature is grossly similar (Figs. S1-S3), indicating
the retention of structure in solution.
3.2.2. UV-Visible spectroscopic study
The absorbance at 260 nm of ST DNA in the presence of 50 mM Tris Buffer decreased gradually
with the increment of the each complex concentration and there was a sign of interaction between
interaction (not shown) represented sigmoidal nature of interaction indicating cooperative nature of
DNA complex bindings. Form the derived log plot by Figs 12(a), 13(a) and 14(a), both the binding
constant as well as Y could be calculated. The binding constant (K) for each case has been
calculated and found to be 16.9 x 10³ M-1, 19.9 x 10³ M-1 and 16.4 x 10³ M-1 for the compounds II,
III and IV, respectively. The Y value of the also was determined from the slope of the straight line
which was found to be 4.4, 3.1 and 3 respectively for the compounds II, III and IV. The positive
sign of the Y indicated that the interaction was highly co-operative.
3.2.1. Fluorescence quenching of EB–DNA by compound II, III & IV
Ethidium bromide (EB) can be used as the fluorescence probe for DNA to study the molecular
interactions between DNA and the compounds in the excited state. Though EB is a moderate
fluorophore, but in presence of DNA it provides powerful fluorescence maximum at 600 nm on
excitation at 480nm due its strong binding power with two nucleotide base pairs in intercalated
state. The enhanced fluorescence of EB-DNA can be reduced by the addition of another interacting
molecule [25, 26]. In the present systems, we have studied the effects of pyrimidine containing
Schiff base ligand (I) and its metal compounds (II, III and IV) on the DNA through fluorescence
emission spectral studies. Compound I didn’t show any fluorescence emission on interaction with
EB-DNA. [Fig. 11(a)-(c)]. It has been observed that the addition of compounds II- IV (suspended
in DMSO solution) to a solution of EB bound DNA resulted in a decrease in fluorescence emission
intensity in each case, which may be due to the quenching of fluorescence takes place upon
interaction between DNA and metal compounds. The fluorescence quenching is quantitated by the
Stern–Volmer relation:
Where, F0 and F are the emission intensities of the fluorophore in absence and in presence of
quencher, respectively. Ksv is the stern-volmer (SV) constant [27]. [Q] is the concentration of the
interacting molecule i.e.; quencher. According to equation (1), we obtained a linear plot for F0/F
against each quencher [Figs. 12(b), 13(b) and 14(b)]. From the slopes of the straight line, we have
calculated the SV constants for the quenchers (KSV = 2.9 x 10³ for II, 3 x 10³ for III and 1 x 10³ M
-1
for IV).
Moreover the relation of Ksv with Kq is Ksv=Kq X Γ where, Kq and Γ were quenching constant and
the lifetime of flour, respectively [28]. The value of Kq determined the nature of quenching, as the
higher value than the limiting value (limiting value of 1 X 10¹⁰ M-1s-1) denoted the static
quenching whereas, the lower value denoted the dynamic ones. It was reported that the Γ value for
DNA-EB was in the range of 23 ns [27]. Thus the observed Kq found to be 12.6 X 10¹⁰ M-1s-1,
13.04 X 10¹⁰ M-1s-1 and 4.31 X 10¹⁰ M-1s-1 for the compounds II, III and IV, respectively. The
obtained bimolecular quenching constant (kq) was much larger than the limiting value of 1 X 10¹⁰
M-1s-1, which was considered the maximum positive value in fluorescence quenching in aqueous
conditions. Thus dynamic quenching may be cancelled for the quenching of EB–DNA
fluorescence by each of the compound.
The binding constant (K) for each case has been calculated according to the Scatchard equation as
mention above and found to be 13.2 X 10³ M-1, 19.9 X 10³ M-1 and 12.8 X 10³ M-1 for the
compounds II, III and IV, respectively [Figs 12(c), 13(c) and 14(c),]. The numbers of binding
sites (n) are obtained as 2.15, 1.56 and 3.57 for II, III and IV, respectively. The values of ‘‘n” was
found to be in the range of 2-4 and existence of multiple binding sites in DNA for all the
compounds. The more than one binding sites was also supported nature of co-operative
structure somehow replaced the EB and might be intercalated between base pairs, thereby,
repelling the EB from the said position causing decrease in fluorescence intensity. The binding
constant of these two types of compounds (both octahedral Co(III) and square planner Cu(II)) are
of the same order. Actually DNA ligand interaction solely depend not only the architecture of the
DNA but also of ligand structure. As both ligands of these two compounds remained same thereby
there are some common strategies to replace the bound EB from the DNA or quenching the
fluorescence of the DNA-EB compounds by metal upon complexation. The latter is true as
EB-DNA interaction are stronger than the EB-DNA ligand interactions (almost comparable), thus the
quenching process are carried out by metal compounds (the contribution of the free ligand DNA
interaction is minimum (data not shown). Thus the both compounds would have almost same range
of binding strength.
3.2.3. Viscometric study
Hydrodynamic method, such as changes in viscosity, which is exquisitely dependent to the change
of length of DNA, may be the most effective means studying the binding mode of compounds to
DNA. To confirm the interaction mode of the complex with DNA, a viscosity study was
performed. Groove-binding typically resulted in only a few changes in structure in the backbone
keeping the DNA essentially in an unaltered in naturally B-form, whereas intercalation resulted in
an increase in the length DNA structure due to insertion of planar ligand moiety between adjacent
base pairs [23, 29]. Thus intercalation of compound inside the DNA base pairs caused lengthening,
stiffening and unwinding of the helix resulting with a pronounced increment of the intrinsic
viscosity. Thus increase in viscosity signified intercalation mode of interaction rather than groove
compound concentrations [Figs 12(d), 13(d) and 14(d)]. This increase in viscosity proved that all
of the metal compounds intercalated inside the DNA base pairs.
4. Conclusion
The present communication provides a general and effective method for the synthesis of
2,4-dihydroxyacetophenone-4,6-dimethylhydrazino pyrimidine, H2MHyP and its Co(III) and Cu(II)
complexes. All the compounds are monomeric in nature and crystallize in either monoclinic (I &
III) or triclinic (II & IV) crystal system; with nearly octahedral and square planar geometries for
Co(III) and Cu(II) complexes, respectively. Compounds II, III & IV show potential DNA binding
activities with Salmon Testis DNA due to their positive metal Centre’s. The order of association
constant all of the compounds are in the range of 104 M-1 at both ground and excited states which is
quite high. The nature of quenching is static with an intercalation mode of bindings in all the
synthesized compounds.
Acknowledgments
One of us (Rajesh Pradhan) is thankful to the University of Kalyani for providing financial support
in the form of University Research fellowship. The financial support received from the
DST-PURSE program and the UGC-SAP DRS-II program, University of Kalyani, is thankfully
acknowledged. We are thankful to Professor Nilmoni Sarkar, Department of Chemistry, Indian
Appendix A.Supplementary material
Crystallographic data for the structures reported here have been deposited with the Cambridge
Crystallographic Data Center, CCDC Nos 1015148, 1015149, 1015150 and 1015151. Copies of
this information may be obtained free of charge from the Director, CCDC, 12 Union Road,
Cambridge, CB2 1EZ, UK (Fax: +44-1223-336-033); E-mail: [email protected] or
http://www.ccdc.cam.ac.uk. Figures S1-S3 are available as supplementary materials.
References
[1] P. Sathyadevi, P. Krishnamoorthy, R.R. Butorac, A.H. Cowley, N. Dharmaraj, Metallomics 4 (2012) 498.
[2] N.E.A. El-Gamel, RSC Advan. 2 (2012) 5870.
[3] Y.S. Nalwar, M.A. Sayyed, S.S. Mokle, P.R. Zanwar, Y.B. Vibhute, W.J. Chem. 4 (2009) 123.
[4] S.S. Mokle, M.A. Sayyed, K. Chopde, Int. J. Chem. Sci. 2 (2004) 96.
[5] S. Nahid, G. Zeinab, H. Saba, Bioinor. Chem. and Appl.2012 (2012) (Article ID 126451)
[6] J. Hung, L.M. Werbel, J. Heterocycl. Chem.21(1984) 741.
[7] R.M. Abdel-Rahman, A.M. Abdel-Halim, Commun. Fac. Scien. Univ., Ankara,B31(1985).
[8] F. Zamora, M. Kunsman, M. Sabat, B. Lippart, Inorg. Chem. 36 (1997) 1583.
[9] M. Louloudi, Y. Deligiannakis, J.P. Tuchagues, B. D, N. Hadjiliadis. Inorg. Chem. 36 (1997) 6335.
[10] F. Jolibois, J. Cadet, A. Grand, R. Subra, N. Rega, V. Barone. J. Am. Chem. Soc. 120 (1998) 1864.
[11] G.M. Kosolapoff, C.H. Roy, J. Org. Chem. 26 (1961) 1895.
[13] Crystal Clear-SM Expert v2.1. Rigaku Americas, the Woodlands, Texas, USA, and Rigaku Corporation, Tokyo, Japan, 2010-2014.
[14] M.C. Burla, R. Caliandro, M. Camalli, B. Carrozzini, G.L. Cascarano, L.D. Caro, C. Giacovazzo, G. Polidori, R.Spagna, J. Appl. Cryst. 38, (2005) 381.
[15] M.C. Burla, R. Caliandro, M. Camalli, B. Carrozzini, G.L. Cascarano, C. Giacovazzo, M. Mallamo, A. Mazzone, G. Polidori, R.Spagna, J. Appl. Cryst. 45 (2012) 357.
[16] G.M. Sheldrick, Acta Crystallogr., Sect. A 64 (2008) 112.
[17] International Tables for Crystallography, Vol.C Ed. A.J.C. Wilson, Kluwer Academic Publishers, Dordrecht, Netherlands, Table 6.1.1.4, pp. (1992) 572.
[18] J.A. Ibers, W.C. Hamilton, Acta Crystallogr. 17 (1964) 781.
[19] Crystal Structure v4.1. Rigaku Americas, the Woodlands, Texas, USA, and Rigaku Corporation, Tokyo, Japan, (2013).
[20] O.V. Dolomanov, L.J. Bourhis, R.J. Gildea, J.A.K. Howard, H. Puschmann, J. Appl. Cryst. 42 (2009) 339.
[21] M. Banik, T. Basu, Dalton Trans, 43 (2014) 3244.
[22] G. M. Howe, K. C. Wu, W. R. Bauer, Biochem. 15 (1976) 4339.
[23] S. Tabassum, A. Asim, F. Arjmand, Md. Afzal, V. Bagchi, Eur. J. Med. Chem., 58 (2012) 308.
[24] W.J. Geary, Coord. Chem. Rev., 7 (1971) 81.
[25] B.C. Baguley, M. LeBret, Biochem., 23 (1984) 937.
[26] J.R. Lakowicz, G. Webber, Biochem., 12 (1973) 4171.
[27] A. Kathiravan, R. Renganathan, Polyhedron28 (2009) 1374.
[28] J.R. Lakowicz, Princ. Fluores. Spectros. , Springer, New York, (2006).
Figure captions
Figure 1. Structural Formulation of the ligand (H2MHyP).
Figure 2. View of the asymmetric unit (crystallographic numbering) of I. Thermal ellipsoids are drawn at the 50 % probability level.
Figure 3. View of the asymmetric unit (crystallographic numbering) of II. Thermal ellipsoids are drawn at the 50 % probability level.
Figure 4. View of the asymmetric unit (crystallographic numbering) of III. Thermal ellipsoids are drawn at the 50 % probability level.
Figure 5. View of the asymmetric unit (crystallographic numbering) of IV. Thermal ellipsoids are drawn at the 50 % probability level.
Figure 6. Views of the two-dimensional hydrogen-bonded sheet formed by I. Hydrogen atoms not involved in hydrogen bonding are omitted. (top) View down the b-axis of the sheet in the ac-plane. (Bottom) View down the a-axis of two adjacent corrugated sheets.
Figure 7. View down the c-axis of the three-dimensional hydrogen-bonded network formed by II. Hydrogen atoms not involved in hydrogen bonding are omitted.
Figure 8. Views of the two-dimensional hydrogen-bonded sheet formed by III. Hydrogen atoms not involved in hydrogen bonding are omitted. (top) View down the b-axis of the sheet in the ac-plane. (bottom) View down the a-axis of corrugated sheet.
Figure 9. View down the ac-diagonal axis of the one-dimensional hydrogen bonded double- layered chains formed by IV, running along the ab-diagonal axis Hydrogen atoms not involved in hydrogen bonding are omitted.
Figure 10. UV-Vis. Absorption titration of Salmon Testis-DNA in the presence of various concentrations
Figure 11. Fluorescence quenching of EB–DNA in the presence of various concentrations (a) compound II( λmax= 480 nm; λemi= 600 nm; [comp. II] = 0-600 µM);
(b) compound III( λmax= 480 nm; λemi= 600 nm; [comp. III] = 0-600 µM); (c) compound IV( λmax= 480 nm; λemi= 600 nm; [comp. IV] = 0-1050 µM).
Figure 12. (a) Hill plot of compound II ([comp. II]= 0-160 µM) with DNA interaction; (b) Stern-Volmer plot of DNA-EtBr with compound II ( λmax= 480 nm; λemi= 600
nm; [comp. II] = 0-530 µM); (c) Derived Scatchard plot of compound II in the excited state range; (d) Viscometric study of compound II with DNA (keeping DNA conc. 300 µM with a gradual addition of varying conc. of compound II with a maximum ratio of 0.5).
Figure 13. (a) Hill plot ofcompound III ([comp. III]= 0-125 µM) with DNA interaction; (b) Stern-Volmer plot of DNA-EtBr with compound III ( λmax= 480 nm;
λemi= 600 nm; [comp. III] = 0-600 µM); (c) Derived Scatchard plot of
compound III in the excited state range; (d) Viscometric study of compound III with DNA (keeping DNA conc. 300 µM with a gradual addition of varying conc. of compd. III with a maximum ratio of 0.7).
Figure 14. (a) Hill plot of compound IV ([comp. IV]= 0-160 µM) with DNA interaction; (b) Stern-Volmer plot of DNA-EtBr with compound IV ( λmax= 480 nm; λemi=
600 nm; [comp. IV] = 0-1050 µM); (c) Derived Scatchard plot of compound III in the excited state range; (d) Viscometric study of compound IV with DNA
(keeping DNA conc. 300 µM with a gradual addition of varying conc. of compd. IV with a maximum ratio of 1.3).
Figure S1.(a) Solid state UV-Vis spectra (DRS) of compound II; (b) UV-Vis spectra of compound II (200-400nm) in DMSO; (c) UV-Vis spectra of compound II (400- 900nm) in DMSO.
Figure S2. (a) Solid state UV-Vis. spectra (DRS) of compound III; (b) UV-Vis spectra of compound III (200-400nm) in DMSO; (c) UV-Vis spectra of Compound III (400-900nm) in DMSO.
Figure S3. (a) Solid state UV-Vis. spectra (DRS) of compound IV; (b) UV-Vis spectra of compound IV (200-400nm) in DMSO; (c) UV-Vis spectra of compound IV (400-900nm) in DMSO.
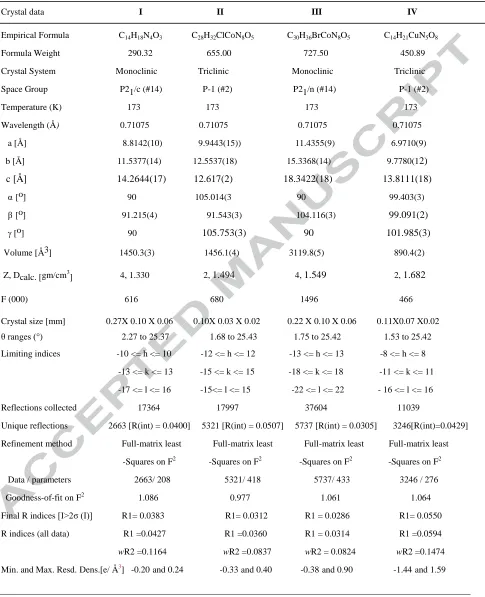
Table 1. Crystal data and structure refinement parameters for C14H18N4O3 (I), C28H32ClCoN8O5 (II),
C30H36BrCoN8O5 (III), and C14H21CuN5O8 (IV)
Crystal data I II III IV
Empirical Formula C14H18N4O3 C28H32ClCoN8O5 C30H36BrCoN8O5 C14H21CuN5O8
Formula Weight 290.32 655.00 727.50 450.89 Crystal System Monoclinic Triclinic Monoclinic Triclinic Space Group P21/c (#14) P-1 (#2) P21/n (#14) P-1 (#2) Temperature (K) 173 173 173 173
Wavelength (Å) 0.71075 0.71075 0.71075 0.71075
a [Å] 8.8142(10) 9.9443(15)) 11.4355(9) 6.9710(9) b [Å] 11.5377(14) 12.5537(18) 15.3368(14) 9.7780(12)
c [Å] 14.2644(17) 12.617(2) 18.3422(18) 13.8111(18)
α[o] 90 105.014(3 90 99.403(3)
β[o] 91.215(4) 91.543(3) 104.116(3) 99.091(2)
[o] 90 105.753(3) 90 101.985(3)
Volume [Å3] 1450.3(3) 1456.1(4) 3119.8(5) 890.4(2)
Z, Dcalc. [gm/cm3] 4, 1.330 2, 1.494 4, 1.549 2, 1.682
F (000) 616 680 1496 466
Crystal size [mm] 0.27X 0.10 X 0.06 0.10X 0.03 X 0.02 0.22 X 0.10 X 0.06 0.11X0.07 X0.02 θ ranges (°) 2.27 to 25.37 1.68 to 25.43 1.75 to 25.42 1.53 to 25.42
Limiting indices -10 <= h <= 10 -12 <= h <= 12 -13 <= h <= 13 -8 <= h <= 8
-13 <= k <= 13 -15 <= k <= 15 -18 <= k <= 18 -11 <= k <= 11
-17 <= l <= 16 -15<= l <= 15 -22 <= l <= 22 - 16 <= l <= 16
Reflections collected 17364 17997 37604 11039
Unique reflections 2663 [R(int) = 0.0400] 5321 [R(int) = 0.0507] 5737 [R(int) = 0.0305] 3246[R(int)=0.0429]
Refinement method Full-matrix least Full-matrix least Full-matrix least Full-matrix least
-Squares on F2 -Squares on F2 -Squares on F2 -Squares on F2
Data / parameters 2663/ 208 5321/ 418 5737/ 433 3246 / 276
Goodness-of-fit on F2 1.086 0.977 1.061 1.064
Final R indices [I>2σ (I)] R1= 0.0383 R1= 0.0312 R1 = 0.0286 R1= 0.0550
R indices (all data) R1 =0.0427 R1 =0.0360 R1 = 0.0314 R1 =0.0594
wR2 =0.1164 wR2 =0.0837 wR2 = 0.0824 wR2 =0.1474
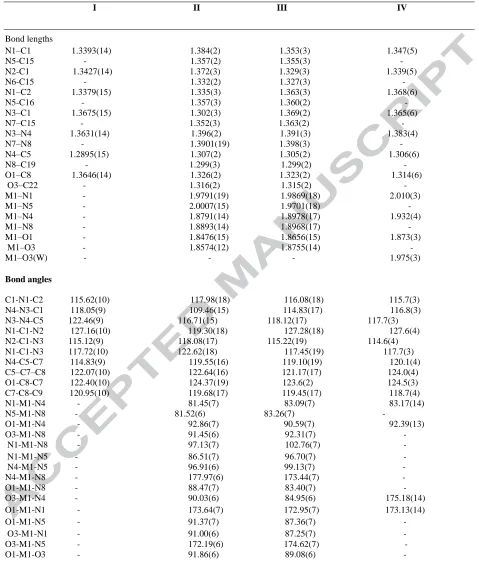
Table 2. Selected bond lengths (Å), bond angles and torsion angles (º) of C14H18N4O3 (I), C28H32ClCoN8O5 (II),
C30H36BrCoN8O5 (III) and C14H21CuN5O8 (IV)
I II III IV
Bond lengths
N1–C1 1.3393(14) 1.384(2) 1.353(3) 1.347(5) N5-C15 - 1.357(2) 1.355(3) -
N2-C1 1.3427(14) 1.372(3) 1.329(3) 1.339(5) N6-C15 - 1.332(2) 1.327(3) - N1–C2 1.3379(15) 1.335(3) 1.363(3) 1.368(6) N5-C16 - 1.357(3) 1.360(2) - N3–C1 1.3675(15) 1.302(3) 1.369(2) 1.365(6) N7–C15 - 1.352(3) 1.363(2) - N3–N4 1.3631(14) 1.396(2) 1.391(3) 1.383(4) N7–N8 - 1.3901(19) 1.398(3) - N4–C5 1.2895(15) 1.307(2) 1.305(2) 1.306(6) N8–C19 - 1.299(3) 1.299(2) - O1–C8 1.3646(14) 1.326(2) 1.323(2) 1.314(6) O3–C22 - 1.316(2) 1.315(2) - M1–N1 - 1.9791(19) 1.9869(18) 2.010(3) M1–N5 - 2.0007(15) 1.9701(18) - M1–N4 - 1.8791(14) 1.8978(17) 1.932(4) M1–N8 - 1.8893(14) 1.8968(17) - M1–O1 - 1.8476(15) 1.8656(15) 1.873(3) M1–O3 - 1.8574(12) 1.8755(14) -
M1–O3(W) - - - 1.975(3)
Bond angles
C1-N1-C2 115.62(10) 117.98(18) 116.08(18) 115.7(3) N4-N3-C1 118.05(9) 109.46(15) 114.83(17) 116.8(3)
N3-N4-C5 122.46(9) 116.71(15) 118.12(17) 117.7(3) N1-C1-N2 127.16(10) 119.30(18) 127.28(18) 127.6(4) N2-C1-N3 115.12(9) 118.08(17) 115.22(19) 114.6(4) N1-C1-N3 117.72(10) 122.62(18) 117.45(19) 117.7(3) N4-C5-C7 114.83(9) 119.55(16) 119.10(19) 120.1(4) C5–C7–C8 122.07(10) 122.64(16) 121.17(17) 124.0(4) O1-C8-C7 122.40(10) 124.37(19) 123.6(2) 124.5(3) C7-C8-C9 120.95(10) 119.68(17) 119.45(17) 118.7(4) N1-M1-N4 - 81.45(7) 83.09(7) 83.17(14) N5-M1-N8 - 81.52(6) 83.26(7) -
Table 3. Hydrogen bonding distances (Å) and angles ( ◦)
D-H···A D-A(Å) D-H(Å) H···A(Å) <D-H···A(◦) symmetry Compound 1
O1-H1···N1 (intramol ) 3.3406(13) 0.965(16) 2.567(17) 137.3(15) -
O1-H1···N4 (intramol.) 2.5226(12) 0.965(16) 1.645(16) 149.0(17) -
O2-H2··· O21 2.6814(14) 0.934(17) 1.764(17) 166.7(17) X+1, Y+1/2, Z+1/2-1
O21-H21A···O1 2.7855(12) 0.930(15) 1.873(15) 166.6(15) X-1, Y, Z
O21-H21B···N2 2.7840(13) 0.944(16) 1.961(17) 144.5(14) -
N3-H3···O21 2.9859(14) 0.912(13) 2.222(13) 140.9(12) -
Compound II
O2-H2···Cl1 3.0229(15) 0.904(17) 2.121(18) 176(3) X, Y, Z+1
O4-H4···Cl1 3.0350(16) 0.929(16) 2.120(17) 168(2) -X+1,-Y+1,-Z+1
O31- H31A··· Cl1 3.190(2) 0.940(17) 2.273(18) 165(2) -
O31-H31B··· O2 2.905(2) 0.951(18) 1.98(2) 163(3) -X+1,-Y,-Z+1
N2-H2A···Cl1 3.159(2) 0.948(17) 2.267(19) 156(2) -
N7-H7···O31 2.805(2) 0.923(16) 1.897(17) 167(2) X-1, Y, Z
Compound III
O2-H2···O4 2.756(3) 0.934(17) 1.831(18) 171(3) X-1, Y, Z
O4-H4···Br1 3.1614(16) 0.936(18) 2.24(2) 167(3) -X+2, -Y, -Z+2
O31-H31···Br1 3.241(2) 0.945(17) 2.340(19) 159(2) -X+1/2+1, Y+1/2, -Z+1/2+1
N3-H3···O31 2.760(3) 0.932(17) 1.864(18) 160(2) -
N7-H7···Br1 3.4703(18) 0.952(17) 2.57(2) 158(2) -X+1, -Y, -Z+2
Compound IV
O2-H2···O31 2.685(7) 0.96(2) 1.74(2) 170(6) X, Y-1, Z
O3-H3B···O21 3.191(11) 0.96(2) 2.37(4) 143(5) X, Y-1, Z
O3-H3B···O23 2.998(8) 0.96(2) 2.07(3) 163(5) X, Y-1, Z
O3-H3C···O21 2.725(5) 0.96(2) 1.84(3) 153(6) -X+1, -Y, -Z+1
O31-H31A···O23 3.004(10) 0.97(2) 2.03(3) 173(11) -X+1, -Y+1, -Z+1
O31- H31B···O41 3.36(3) 0.98(2) 2.51(8) 144(10) -X, -Y+1, -Z+1
Highlights (for review)
Synthesis; X-ray crystallography; Hydrogen bonding interactions; DNA binding activities