Spoken Text Difficulty Estimation Using Linguistic Features
∗Su-Youn Yoon and Yeonsuk Cho and Diane Napolitano
Educational Testing Service 660 Rosedale Rd Princeton, NJ, 08541, USA
Abstract
We present an automated method for estimat-ing the difficulty of spoken texts for use in generating items that assess non-native learn-ers’ listening proficiency. We collected infor-mation on the perceived difficulty of listening to various English monologue speech samples using a Likert-scale questionnaire distributed to 15 non-native English learners. We aver-aged the overall rating provided by three non-native learners at different proficiency lev-els into an overall score of listenability. We then trained a multiple linear regression model with the listenability score as the dependent variable and features from both natural lan-guage and speech processing as the indepen-dent variables. Our method demonstrated a correlation of 0.76 with the listenability score, comparable to the agreement between the non-native learners’ ratings and the listenability score.
1 Introduction
Extensive research has been conducted on the pre-diction of difficulty of understanding written lan-guage based on linguistic features. This has resulted in various readability formulas, such as the Fry read-ability index and the Flesch-Kincaid formula, which is scaled to United States primary school grade lev-els. Compared to readability, research into listen-ability, the difficulty of comprehending spoken texts,
∗We would like to thank to Yuan Wang for data collection, Kathy Sheehan for sharing text difficulty prediction system and insights, and Klaus Zechner, Larry Davis, Keelan Evanini, and anonymous reviewers for comments.
has been somewhat limited. Given that spoken and written language share many linguistic features such as vocabulary and grammar, efforts were made to apply readability formula to the difficulty of spoken texts, rending promising results that the listenabil-ity of spoken texts could be reasonably predicted from readability formula without taking acoustic features of spoken language into account (Chall and Dial, 1948; Harwood, 1955; Rogers, 1962; Denbow, 1975; O’Keefe, 1971). However, linguistic features unique to spoken language such as speech rate, dis-fluency features, and phonological phenomena con-tribute to the processing difficulty of spoken texts as such linguistic features pose challenges at both perception (or parsing) and comprehension levels (Anderson, 2005). Research evidence indicated that ESL students performed better on listening compre-hension tasks when the rate of speech was slowed and meaningful pauses were included (Blau, 1990; Brindley and Slatyer, 2002). Shohamy and Inbar (1991) observed that EFL students recalled most when the information was delivered in the form of a dialogue rather than a lecture or a news broadcast. The researchers attributed test takers poor perfor-mance on the latter two text types to a larger den-sity of propositions, greater than that of the more orally oriented text type (p. 34). Furthermore, it is not difficult to imagine how other features unique to spoken language affect language processing. For example, prosodic features (e.g., stress, intonation) can aid listeners in focusing on key words and in-terpreting intended messages. Similarly, disfluency features (e.g., pause, repetitions) may provide the listener with more processing time and redundant
Source Length (sec.) Number of
passages % in the total sample Set A Set B Set C English proficiency
tests for business purpose
25 - 46 50 25 16 16 18
English proficiency tests for academic purpose
23 - 101 80 40 28 26 26
News 15 - 66 35 18 12 12 11
Interviews 30 - 93 35 18 11 12 12
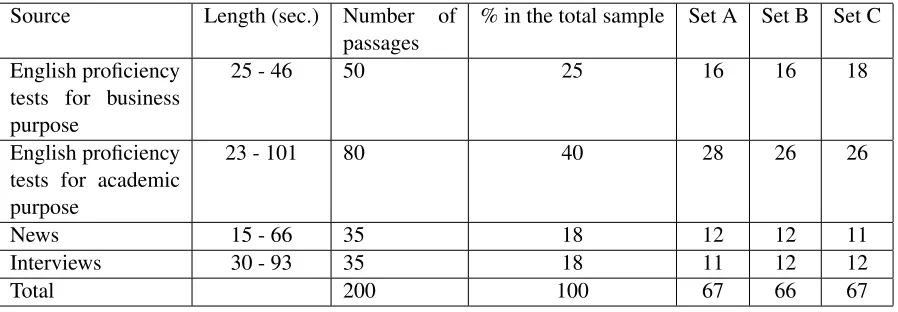
[image:2.612.70.519.57.213.2]Total 200 100 67 66 67
Table 1:Distribution of speech samples
formation (Cabrera and Mart´ınez, 2001; Chiang and Dunkel, 1992). Dunkel et al. (1993) stated that a variety of linguistic features associated with spoken texts contribute to task difficulty on listening com-prehension tests. Thus, for a valid evaluation of the difficulty of spoken texts, linguistic features relevant to spoken as well as written language should be care-fully considered. However, none of the studies that we were aware of at the time of the current study had attempted to address this issue in developing an au-tomated tool to evaluate the difficulty of spoken texts using linguistic features of both written and spoken language. Lack of an automated evaluation tool ap-propriate for spoken texts is evidenced in more re-cent studies that applied readability formula to eval-uate the difficulty of spoken test directions (Cormier et al., 2011) and spoken police cautions (Eastwood and Snook, 2012).
Recently, Kotani et al. (2014) developed an auto-mated method for predicting sentence-level listen-ability as part of an adaptive computer language learning and teaching system. One of the primary goals of the system is to provide learners with lis-tening materials according to their second-language proficiency level. Thus, the listenability score as-signed by this method is based on the learners’ lan-guage proficiency and takes into account difficulties experienced across many levels of proficiency and the entire set of available materials. Their method used many features extracted from the learner’s ac-tivities as well as new linguistic features that account for phonological characteristics of speech.
Our study explores a systematic way to measure the difficulty of spoken texts using natural language
processing (NLP) technology. In contrast to Kotani et al. (2014)’s system for measuring sentence-level listenability, we predict a listenability score for a spoken text comprised of several sentences. We first gathered multiple language learners’ perceptions of overall spoken text difficulty, which we operational-ized as a criterion variable. We assumed that the lin-guistic difficulty of spoken texts relates to four ma-jor dimensions of spoken language: acoustic, lexi-cal, grammatilexi-cal, and discourse. As we identified linguistic features for the study, we attempted to rep-resent each dimension in our model. Finally, we de-veloped a multiple linear regression model to esti-mate our criterion variable using linguistic features. Thus, this study addresses the following questions:
• To what extent do non-native listeners agree with the difficulty of spoken texts?
• What linguistic features are strongly associated with the perceived difficulty of spoken texts?
• How accurately can an automated model based on linguistic features measuring four dimen-sions (Acoustic, Lexical, Grammatical, and Discourse) predict the perceived difficulty of spoken texts?
2 Data
2.1 Speech Samples
news and interviews which are often used as listen-ing practice materials for language learners. Table 1 shows the distribution of the 200 speech samples by source and by random partition into three distinct sets A, B, and C for the collection of human ratings. Each set includes a similar number of speech sam-ples per source.
All speech samples were monologic speech and the length of speech samples was limited to a range of about 23 to 101 seconds. All samples were free from serious audio quality problems that would have obscured the contents. The samples from the glish proficiency exams were spoken by native En-glish speakers with high-quality pronunciation and typical Canadian, Australian, British, or American accents. The samples from the news clips were part of 1996 English Broadcast News Speech corpus de-scribed in Graff et al. (1997). We selected seven television news programs and extracted speech ples from the original anchors. The interview sam-ples were excerpts from interview corpus described in Pitt et al. (2005). They were comprised of uncon-strained conversational speech between native En-glish speakers from the Midwestern United States and a variety of interviewers who, while speaking native- or near-native English, are from unknown origins. We only extracted a monologic portion from the interviewee.
2.2 Human Ratings
A questionnaire was designed to gather participants’ perceptions of overall spoken text difficulty, opera-tionalized as our criterion variable. The question-naire is comprised of five Likert-type questions de-signed to be combined into a single composite score during analysis. Higher point responses indicated a lower degree of listening comprehension and a higher degree of text difficulty. The original ques-tionnaire is as follows:
1. Which statement best represents the level of your understanding of the passage?
5) Missed the main point 4) Missed 2 key points 3) Missed 1 key point 2) Missed 1-2 minor points 1) Understood everything
2. How would you rate your understanding of the passage?
5) less than 60% 4) 70%
3) 80% 2) 90% 1) 100%
3. How much of the information in the passage can you remember?
5) less than 60% 4) 70%
3) 80% 2) 90% 1) 100%
4. Estimate the number of words you missed or did not understand.
5) more than 10 words 4) 6-10 words
3) 3-5 words 2) 1-2 words 1) none 5. The speech rate was
5) fast
4) somewhat fast 3) neither fast nor slow 2) somewhat slow 1) slow
The first three questions were designed to esti-mate participants’ overall comprehension of the spo-ken text. The fourth question, regarding the num-ber of missed words, and the fifth question were de-signed to estimate the difficulty associated with the Vocabulary and Acoustic dimensions. We did not in-clude separate questions related to the Grammar or Discourse dimensions.
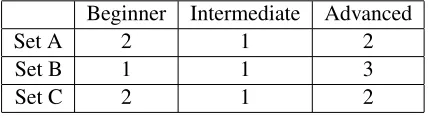
and Turkish. Prior to evaluating the speech samples, participants were classified into one of the three pro-ficiency levels based on the score they received on the TOEFL Practice Online(TPO). TPO is an on-line practice test which allows students to gain fa-miliarity with the format of TOEFL, and we used a total score that was a composite score of four sec-tion scores: listening, reading, speaking, and writ-ing. Each participant rated one set, approximately 67 speech samples. The participants were assigned to one of the three sets of speech samples with care taken to ensure that each set was evaluated by a group representing a wide range of proficiency lev-els. Table 2 summarizes the number of listeners at each proficiency level assigned to each set.
Beginner Intermediate Advanced
Set A 2 1 2
Set B 1 1 3
[image:4.612.76.290.273.332.2]Set C 2 1 2
Table 2:Distribution of non-native listeners
All participants attended a rating session which lasted about 1.5 hours. At the beginning of the rating session, the purpose and procedures of the study were explained to the participants. Since we were interested in the individual participants’ per-sonal perceptions of the difficulty of spoken texts, participants were told to use their own criteria and experience when answering the questionnaire. Par-ticipants worked independently and listened to each speech sample on the computer. The questionnaire was visible while the listening stimuli were playing; however, the ability to respond to it was disabled until the speech sample had been listened to in its entirety. After listening to each sample, the partic-ipants provided their judgments of spoken text dif-ficulty by answering the questionnaire items. The speech samples within each set appear in random se-quence to minimize the effect of the ordering of the samples on the ratings. Furthermore, to minimize the effect of listeners’ fatigue on their ratings, they were given the option of pausing at any time during the session and resuming whenever ready.
Before creating a single composite score from five Likert-type questions, we first conducted correlation analysis using the entire dataset. We created all pos-sible pairs among five Likert-type questions and
cal-culated Pearson correlations between responses to paired questions. The responses to the first four questions were highly correlated with Pearson cor-relation coefficients ranging from 0.79 to 0.92. The correlations between Question 5 and the other four questions ranged between 0.49 and 0.61. The strong inter-correlations among different Likert-type ques-tions suggested that these quesques-tions measured one aspect: the overall difficulty of spoken texts. Thus, instead of using each response from a different ques-tion separately, for each audio sample, we summed each individual participant’s responses to the five questions. This resulted in a scale with a minimum score of 5 and maximum score of 25, where the higher score, the more difficult the text. Hereafter, we refer to an individual-listener’s summed rating an aggregated score.
Since our system goal was to predict the averaged perceived difficulty of the speech samples across En-glish learners at beginning, intermediate, and ad-vanced levels, we used the average of three listen-ers’ aggregated scores, one listener from each pro-ficiency level. Going forward we will refer to this average rating as the listenability score. The mean and standard deviation of listenability scores were
17.3and4.6, respectively. We used this listenability score as our dependent variable during model build-ing.
3 Method
3.1 Speech-Based Features
Dimension Feature Correlation with Average Hu-man Difficulty Rating
Acoustic Speaking rate in words per second −0.42
Number of silences per word 0.25
Mean deviation of speech chunk −0.30
Mean distance between stressed syllables in seconds 0.25
Variations in vowel durations −0.30
Vocabulary Number of noun collocations per clause −0.27
Type token ratio 0.33
Normalized frequency of low frequency words −0.49
Average frequency of word types −0.25
Grammar Average words per sentence −0.38
Number of long sentences −0.39
[image:5.612.66.527.57.251.2]Normalized number of sentences 0.45
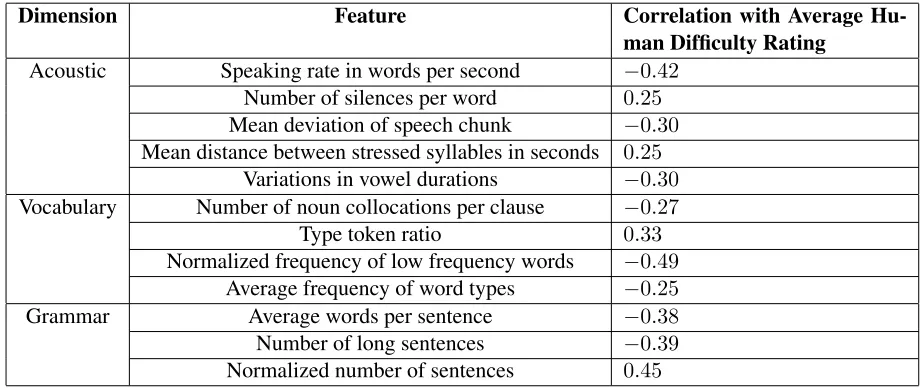
Table 3:Correlation between linguistic features and listenability
such as the mean and standard deviation of both of these at the word and response level. Given the transcriptions with time stamps and descriptive fea-tures of pitch and power, speech proficiency scor-ing system produces around 100 features for auto-mated proficiency scoring per input. However, be-cause speech proficiency scoring system is designed to measure the non-native speaker’s degree of lan-guage proficiency, and a large number of features assess distance between the non-native test takers’ speech and the native speakers’ norm. These fea-tures are not applicable to our data since all audio samples are from native speakers. After excluding these features, only 20 features proved to be useful for our study. The features were classified into three groups as follows:
• Fluency: Features in this group measure the de-gree of fluency in the speech flow; for example, speaking rate and the average length of speech chunk without disfluencies;
• Pause: Features in this group capture charac-teristics of silent pauses in speech; for exam-ple, the duration of silent pauses per word, the mean of silent pause duration, and the number of long silent pauses;
• Prosodic: Features in this group measure rhythm and durational variations in speech; for example, the mean distance between stressed syllables in syllables, and the relative frequency of stressed syllables.
3.2 Text-Based Features
Text-based features were generated on clean tran-scripts of the monologic speech using the text dif-ficulty prediction system system. (Sheehan et al., 2014) The main goal of text difficulty prediction system is to provide an overall measure of text complexity, otherwise known as readability, an im-portant subtask in the measurement of listenability. However, because of the differences between read-ability and listenread-ability, only seven of the more than 200 linguistic features generated by text difficulty prediction system were selected for our model, four of which cover the Vocabulary construct and three of which cover our Grammar construct.
3.3 Model Building
dimension with the highest correlations. The final, overall set of features used in our analysis was se-lected to maximize the coverage of all of the com-bined characteristics represented by the overall con-structs. For instance, if two features showed a cor-relation larger than 0.80, a feature whose dimension was not well represented by other features was se-lected. This resulted in a set of 12 features as pre-sented in Table 3. We did attempt to develop a Co-herence dimension using two features (the frequency of content word overlap and the frequency of casual conjuncts), but both were found to have insignifi-cant correlations with the listenability score and thus were excluded from the model.
Model-building and evaluation were performed using three-fold cross-validation. We randomly di-vided out data into three sets, two of which were combined for training with the remaining set used for testing. For each round, a multiple linear regres-sion model was built using the average difficulty rat-ings of three non-native listeners, one at each profi-ciency level, as the dependent variables and the 12 features as independent variables.
4 Results
4.1 Agreement among non-native listeners
[image:6.612.336.505.56.169.2]In this study, we estimated the difficulty of under-standing spoken texts based on self-reported ratings via Likert-type questions, similar to the approach taken by Kotani et al. (2014). Likert-type ques-tions are effective in collecting the participants’ im-pression for the given item and are widely used in survey research but are highly susceptible. Partic-ipants may avoid selecting extreme response cat-egories (central tendency bias) or may choose the “easy” category more often to inflate their listening comprehension level. These distortions may result in shrinkage of the listenability score’s scale. In ticular, the second bias may be more salient for par-ticipants at low proficiency levels and cause a skew toward higher listenability scores. In order to ex-amine whether any participant was subject to such biases, we first analyzed the distribution of response categories per each participant. Approximately 335 responses were available per participant (67 audio samples, 5 questions per sample). All participants made use of every response category, and 10 out of
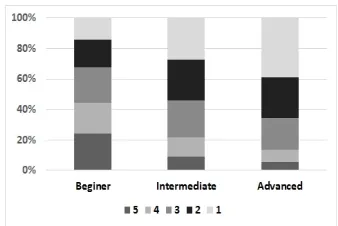
Figure 1:Distribution of Likert-type responses per proficiency group
15 participants used all categories at least 4% of the time. However, four participants rarely used certain response categories; two advanced learners and one intermediate learner used category “5” (most diffi-cult) only 1%. On the contrary, one rater at the be-ginner level used category “1” (easiest) only for 1%. Due to the potential bias in these ratings, we tried to exclude them when selecting three listeners (one lis-teners per proficiency level) to use in calculating the listenability score; these advanced learners and this beginner learner were excluded, but the intermedi-ate learner was included due to lack of an alternative learner at the same proficiency level.
Next, we examined the relationship between dif-ficulty ratings and non-native listeners’ proficiency levels. Figure 4.1 shows distribution of aggregated scores per proficiency group.
Not surprisingly, as proficiency level increased, the listeners were more likely to judge the samples as easy, and the frequency of selecting categories rep-resenting difficulty decreased. The percentages of response category “5” selections were 24% for be-ginners, 9.1% for intermediate learners, and 5.3% for advanced learners.
Finally, we used Pearson correlation coefficients to assess the inter-rater agreement on the difficulty of spoken texts. The correlation analysis results be-tween two listeners at the same proficiency level are summarized in second and third rows of Table 4. For the beginner group, the correlation coefficient for set B was unavailable due to the lack of a second lis-tener. We also analyzed the agreement between all possible pairs of listeners across the different groups by calculating the Pearson correlation coefficient per pair and taking the average for each set (8 pairs for set A and C, 5 pairs for set B). The results are pre-sented in the last row of Table 4.
Table 4 provides Pearson correlation coefficients.
Group Proficiency
Level A B C Mean
Within
Group Beginner 0.56 - 0.60 0.58
Advanced 0.55 0.64 0.64 0.61
Cross-Group 0.61 0.58 0.60 0.60
Table 4:Pearson correlations among non-native listeners’ rat-ings
The non-native listeners showed moderate agree-ment on the difficulty of our selection of spoken texts. Within the same group, the Pearson correla-tion coefficients ranged from 0.55 to 0.64, and the average was 0.58 for the beginner group and 0.61 for the advanced group. The average correlation across groups was also comparable to the within-group cor-relation values, although the range of the coefficients was wider, ranging from 0.51 to 0.7.
Next, we evaluated the reliability of the listenabil-ity scores (the average of three non-native listeners’ ratings) based on the correlation with the second lis-tener’s ratings not used in the listenability scores. Compared to correlations between individual lis-teners’ ratings (Pearson correlation coefficients of within-group condition), there were increases in the Pearson correlation coefficients. The Pearson
cor-relation coefficient with the beginner group listener score was0.65, and that with the advanced group lis-tener score was0.71; there was 0.07 increase in the beginner listener and 0.10 increase in the advanced listener, respectively. This improvement is expected since the listenability scores are averages of three scores and therefore a better estimate of the true score. We will use Pearson correlation coefficients of0.65and0.71as reference of human performance when comparing with machine performance.
4.2 Relationships Between Listenability Scores and Linguistic Features
We conducted a correlation analysis between our set of 12 features used in the model and the average lis-tenability scores. A brief description, relevant di-mension, and Pearson correlation coefficients with the listenability scores are presented in Table 3. Fea-tures in the Acoustic dimension were generated us-ing speech proficiency scorus-ing system based on both a audio file and its manual transcription. Features in both the Vocabulary and Grammar dimensions were generated using text difficulty prediction system and only made use of the transcription.
The features showed moderate correlation with the listenability scores, with coefficients ranging from 0.25 to 0.50 in absolute value. The best per-forming feature was the “normalized frequency of low frequency words” which measures vocabulary difficulty. It was followed by the “normalized num-ber of sentences” which measures syntactic com-plexity and then the “speaking rate of spoken texts” from the Acoustic dimension.
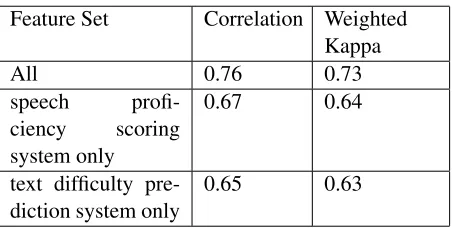
4.3 Performance of the Automated System
and Grammar dimensions). The performance of the model was promising, but there was a substantial drop in agreement: a decrease of approximately 0.1 in the Pearson correlation coefficient from the ob-served for the model with both written and spoken features. Overall, the results strongly suggest that the combination of acoustic-based features and text-based features can achieve a substantial improve-ment in predicting the difficulty of spoken texts over the limited linguistic features typically used in tradi-tional readability formulas.
Feature Set Correlation Weighted
Kappa
All 0.76 0.73
speech
profi-ciency scoring system only
0.67 0.64
text difficulty
[image:8.612.70.296.218.332.2]pre-diction system only 0.65 0.63
Table 5:Correlation between automated scores and listenabil-ity scores based on human ratings
5 Discussion
Due to the limited amount of data available to us, the features used in the scoring models were se-lected using all of our data, including the evaluation partitions; this may result in an inflation of model performance. Additionally, we selected a subset of features based on correlations with listenability scores and expert knowledge (construct relevance) but we did not use an automated feature selection algorithm. In a future study, we will address this is-sue by collecting a larger amount of data and making separate, fixed training and evaluation partitions.
In this study, we used non-native listeners’ impression-based ratings as our criterion value. We did not provide any training session prior to collect-ing these ratcollect-ings which were based on individual participants’ own perceptions of the difficulty. The individual raters had a moderate amount of agree-ment on the difficulty of the spoken texts, but for use in training our model, the reliability of listenability scores based on the average of three raters was sub-stantially higher. However, impression-based rat-ings tend to be susceptible to raters’ biases, so it is
not always possible to get high-quality ratings. Rat-ings from non-native learners covering a wide range of proficiency levels is particularly difficult. Obtain-ing a high-quality criterion value has been a critical challenge in the development of many listenability systems. To address this issue, we explored auto-mated methods that improve the quality of aggre-gated ratings. Snow et al. (2008) identified indi-vidual raters with biases and corrected them using small set of expert annotations. Ipeirotis et al. (2010) proposed a method using the EM algorithm without any gold data: they first initialize the correct rating for each task based on the majority vote outcome, then estimated the quality of each rater based on the confusion matrix between each individual rater’s ratings and majority vote-based answers. Following that, they re-estimated correct answers based on the weighted vote using the rater’s error rate. They re-peated this process until it converged. Unfortunately we found that it was difficult to apply these methods to our study. Both methods required correct answers across all raters (either based on expert annotations or majority voting rules). In our case, the answers varied across proficiency levels since our questions were in regards to the degree of spoken text compre-hension. In order to apply these methods, we would have needed to define a set of correct answers per proficiency level. In the future, instead of applying these automated methods exactly, we intend to de-velop a new criterion value based on an objective measure of a listener’s comprehension. We will cre-ate a list of comprehension questions specific to each spoken text and estimate the difficulty based on the proportion of correct answers.
se-ries of Likert-type questions addressing one aspect, and all questions are designed to create one single composite score. For this type of data, we can use descriptive analysis such as mean and standard devi-ation and linear regression models. In this study, five Likert-type questions were designed to measure one aspect, perceptions of overall spoken text difficulty, and, in fact, responses to different questions were strongly correlated. Based on this observation, we treated our data as a Likert-scale data and conducted various analysis applicable to the interval scale data. Our method was initially designed to assist with the generation of listening items for language pro-ficiency tests. Therefore, we focused on spoken texts frequently used on such tests, so, as a result, the range of text types investigated was narrow and quite homogenous. Interactive dialogues and dis-cussions were not included in this study. Further-more, although effort was made to include a vari-ety of monologues by adding radio broadcasts to our data sample, a significant portion of the speech sam-ples were recorded spoken texts that were designed for a specific purpose, that is, testing English lan-guage proficiency. It is possible that the lanlan-guage used in such texts is more contrived than that of monologues encountered in everyday life, particu-larly since they do not contain any background noise and were produced by speakers from a narrow set of English accents. That having been said, our method is applicable within this context, and predicting the difficulty of monologues produced by native speak-ers with good audio quality is its best usage.
6 Conclusion
This study investigated whether the difficulty of comprehending spoken texts, known aslistenability, can be predicted using a certain set of linguistic fea-tures. We used existing natural language and speech processing techniques to propose a listenability es-timation model. This study combined written and spoken text evaluation tools to extract features and build a multiple regression model that predicts hu-man perceptions of difficulty on short monologues. The results showed that a combination of 12 such features addressing the Acoustic, Vocabulary, and Grammar dimensions achieved a correlation of 0.76 with human perceptions of spoken text difficulty.
References
John R Anderson. 2005. Cognitive psychology and its implications. Macmillan.
Eileen K Blau. 1990. The effect of syntax, speed, and pauses on listening comprehension.TESOL quarterly, 24(4):746–753.
Geoff Brindley and Helen Slatyer. 2002. Exploring task difficulty in esl listening assessment. Language Test-ing, 19(4):369–394.
Marcos Penate Cabrera and Pl´acido Bazo Mart´ınez. 2001. The effects of repetition, comprehension checks, and gestures, on primary school children in an efl situation.ELT journal, 55(3):281–288.
Jeanne S Chall and Harold E Dial. 1948. Predicting lis-tener understanding and interest in newscasts. Educa-tional Research Bulletin, pages 141–168.
Chung Shing Chiang and Patricia Dunkel. 1992. The effect of speech modification, prior knowledge, and listening proficiency on efl lecture learning. TESOL quarterly, 26(2):345–374.
Damien C Cormier, Kevin S McGrew, and Jeffrey J Evans. 2011. Quantifying the degree of linguistic de-mand in spoken intelligence test directions.Journal of Psychoeducational Assessment, 29(6):515–533. Carl Jon Denbow. 1975. Listenability and readability:
An experimental investigation. Journalism and Mass Communication Quarterly, 52(2):285.
Patricia Dunkel, Grant Henning, and Craig Chaudron. 1993. The assessment of an l2 listening comprehen-sion construct: A tentative model for test specifica-tion and development. The Modern Language Jour-nal, 77(2):180–191.
Joseph Eastwood and Brent Snook. 2012. The effect of listenability factors on the comprehension of police cautions.Law and human behavior, 36(3):177. David Graff, Zhibiao Wu, Robert MacIntyre, and Mark
Liberman. 1997. The 1996 broadcast news speech and language-model corpus. InProceedings of the DARPA Workshop on Spoken Language technology, pages 11– 14.
Kenneth A Harwood. 1955. I. listenability and readabil-ity.Communications Monographs, 22(1):49–53. Panagiotis G Ipeirotis, Foster Provost, and Jing Wang.
2010. Quality management on amazon mechanical turk. InProceedings of the ACM SIGKDD workshop on human computation, pages 64–67. ACM.
M Timothy O’Keefe. 1971. The comparative listenabil-ity of shortwave broadcasts. Journalism Quarterly, 48(4):744–748.
Mark A Pitt, Keith Johnson, Elizabeth Hume, Scott Kies-ling, and William Raymond. 2005. The buckeye cor-pus of conversational speech: Labeling conventions and a test of transcriber reliability. Speech Commu-nication, 45(1):89–95.
John R Rogers. 1962. A formula for predicting the comprehension level of material to be presented orally.
The journal of educational research, 56(4):218–220. Kathleen M. Sheehan, Irene Kostin, Diane Napolitano,
and Michael Flor. 2014. The textevaluator tool: Help-ing teachers and test developers select texts for use in instruction and assessment. The Elementary School Journal, 115(2):184 – 209.
Elana Shohamy and Ofra Inbar. 1991. Validation of listening comprehension tests: The effect of text and question type.Language testing, 8(1):23–40.