Eindhoven, September 2011
BSc Industrial Engineering & Management Sciences — TU/e 2009 Student identity number 0592220
in partial fulfilment of the requirements for the degree of Master of Science
in Operations Management and Logistics
Supervisors:
dr.ir. H.A. Reijers, TU/e, IS ir. G.J. Post-Dijkstra, Berenschot, CIFM dr. A. de Jong, TU/e, ITEM
Process Improvement Intelligence:
A framework for measuring alignment
in business process improvement
projects
by
ii TUE. School of Industrial Engineering.
Series Master Theses Operations Management and Logistics
Subject headings: business process improvement, alignment, Key Performance Indicator, best practice, regulative cycle, heuristics, project goal
iii
“When you can measure what you are speaking about, and express it in numbers, you know something about it; but when you cannot measure it, when you cannot express it in numbers, your knowledge is of a meager and unsatisfactory kind: it may be the beginning of knowledge, but you have scarcely, in your thoughts, advanced to the state of science.”
iv
Abstract
While a performance measurement framework (such as the Balanced Scorecard) helps to translate (strategic) objectives into KPIs (which describe the ‘as-is’ situation), it does not provide any guidance to a business process improvement project. There is no framework translating these organizational goals into performance dimensions which can be used to direct a business process improvement initiative.
In this thesis, a Process Improvement Intelligence framework was proposed to measure the alignment between project goals and process improvements. This framework was applied to six cases in the public domain. Results showed that Process Improvement Intelligence could be measured by matching the project goals to the process improvement.
Implementing this framework into the proposed way to process improvement improves the way these projects are undertaken in practice. This will ensure a continual linkage of organizational goals and business processes.
v
Executive summary
While a performance measurement framework (such as the Balanced Scorecard) helps to translate (strategic) objectives into KPIs (which describe the ‘as-is’ situation), it does not provide any guidance to a business process improvement project. The KPIs, defined in the performance measurement framework, are organization specific and often constructed at the start of a business process improvement project, therefore project-specific (see Figure 3.1). Therefore, the following research objective was the goal of this thesis:
Ultimately, by measuring the alignment of business process improvement projects, improving the way these projects are undertaken in practice. To achieve this goal, the selection of process improvement heuristics will be guided the project goals. By examining the statistical relationship between the two, this thesis established that guidance.
Identified as the most important gap in the literature (Jenniskens, 2011), there is no framework translating strategic objectives into performance dimensions which can be used to direct a business process improvement initiative. Such a framework enhances the way business process improvement projects are undertaken. Following the research objective presented above, the main research question for this thesis was formulated as follows:
How can the project goals guide process improvements to ensure the continual tight linkage of organizational goals and business processes?
On a lower level, to examine the relationship between the organizational goals and process improvements, the following sub research question was proposed:
How can the alignment of a business process improvement project be measured?
By providing an answer to this sub research question, this thesis establishes the guidance in selecting the process improvement heuristic(s) as mentioned above in the research objective.
By answering this research question, this thesis extended the current field of research in the following ways. The regulative cycle (van Strien, 1997) was adapted to describe the way business process improvement projects are undertaken in practice. It was proposed to enhance this way by creating a shortlist of process improvement heuristics based on the project goals. Alignment between the project goals and the process improvement heuristics therefore played an important role. Because (project) objectives were translated into performance dimensions using the devil’s quadrangle, this research extended the business performance management literature, as indicated by Neely, Gregory, and Platts (2005). These performance dimensions were proposed to guide a business process improvement initiative, adjoining Reijers and Liman Mansar (2005) research on best practices in business process redesign. This research validated the research of Reijers and Liman Mansar (2005) in the public domain, using business process improvement projects conducted at Berenschot.
vi Quality Time Cost Flexibility Quality Time Cost Flexibility
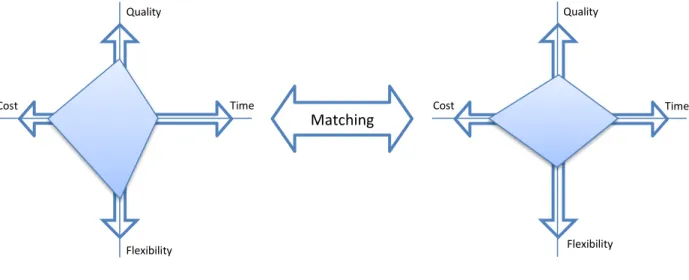
In this thesis, the term ‘Process Improvement Intelligence’ was proposed as a framework for measuring the alignment between project goals and process improvement:
Project goals Process improvements
This framework was applied to six cases from Berenschot, all in the public domain. Therefore, this research validated the research of Reijers and Liman Mansar (2005) in the public domain. The goals of these projects were evaluated by municipality employees, while the process improvements of the projects were evaluated by process experts from Berenschot. Both evaluations involved scoring the item on the four dimensions of the devil’s quadrangle: time, costs, quality and flexibility. Based on the project documentation, the pairs of project goals and process improvement were examined statistically for alignment. It was hypothesized that all pairs aligned significantly.
The results supported this framework, mainly showing significant alignments. In total, eleven misalignments were identified correctly, while it labelled one pair misaligned wrongfully. This process improvement violated one of the properties of the devil’s quadrangle (i.e. it is impossible to improve on all four dimensions), which could explain the failure of the framework. Three misalignments could be explained by misinterpretation of the best practice ‘Order types’ by the process experts. After investigating the alignment scores of the process improvement heuristics, this best practice had the lowest alignment score. This indicated that in practice, there is a serious misalignment between what performance the best practice enhances and what project goal it fulfils. The results were complicated due to the high number of not significant correlations, which could be explained by the very small sample.
In short, the framework showed that Process Improvement Intelligence could be measured by matching the project goals to the process improvement. The framework indicated well aligned projects, as was expected, but was also able to rightfully indicate most misalignments. Implementing this framework into the proposed way to process improvement improves the way these projects are undertaken in practice. This will ensure a continual linkage of organizational goals and business processes. By evaluating their business process improvement projects, Berenschot can improve the alignment of their process improvements to the objectives of a client, thereby improving its service level. Based on the findings of the research, an outlook for future research could be provided.
vii
Preface
This report is the result of my graduation project for the degree of Master of Science in Operations Management and Logistics at Eindhoven University of Technology. The research was conducted from November 2010 to September 2011 in collaboration with Berenschot, a management consulting firm in the Netherlands. This project would not have been successful without the contribution of a number of people, who I would like to express my gratitude to.
First of all, I would like to thank my supervisors. As my mentor during the last two years, I would like to thank Hajo Reijers for his enthusiasm and support during the project. His critical view on my work as well as valuable input contributed significantly to this result. Also, I would like to thank Ad de Jong for his valuable feedback on my work and his help when I could not see the wood for the trees in nonparametric statistics.
Second, I would like to thank Berenschot for giving me the opportunity to conduct this graduation project in a real-life consulting setting. Thanks to the Information Management group and its members for providing the necessary facilities, data, information and the great time I had. Special thanks to Gemma Post, who supervised me during this project and helped me collect the necessary data for the project.
Finally, but most importantly, I would like to thank my family, girlfriend and friends for providing me the support for successfully finishing my graduation project.
Already having one foot in the working life, now it is time to move on, once again in the management consulting industry.
Nick Jenniskens
viii
Table of Contents
Abstract ... iv Executive summary ... v Preface ... vii 1. Introduction ... 11.1. Problem statement and motivation ... 1
1.2. Company profile ... 2
1.3. Research structure ... 3
2. Background ... 4
2.1. Processes ... 4
2.2. Process performance ... 5
2.3. Objectives and targets ... 6
2.4. Strategic alignment of BPM ... 7
2.5. Literature review conclusions ... 8
3. Research design and methodology ... 9
3.1. Business process improvement projects... 9
3.1.1. Process improvement heuristics ...12
3.2. Research objective ...13
3.3. Research questions ...13
3.4. Research model ...14
3.5. Process Improvement Intelligence ...15
3.6. Research methodology ...16
3.6.1. Case selection ...16
3.6.2. Evaluation of project goals and process improvements ...17
3.6.3. Matching pairs of goals and process improvements ...17
4. Experimental design ...19 4.1. Selected cases ...19 4.1.1. P1-P2-P3-P4 ...20 4.1.2. P5 ...20 4.1.3. P6 ...20 4.1.4. P7 ...20
4.2. Scoring procedure of project objectives ...21
ix 4.4. Variables ...24 4.5. Statistical tests ...24 5. Results ...26 5.1. P1–4...26 5.2. P5 ...27 5.3. P6 ...28 6. Discussion ...29
6.1. Categorization of the process improvements ...29
6.2. Evaluation of the projects ...30
6.2.1. P1-4 ...30
6.2.2. P5 ...31
6.2.3. P6 ...32
6.3. Evaluation of the process improvement heuristics...34
6.4. Sample issues ...36
7. Conclusion ...38
7.1. Evaluation of the proposed framework ...38
7.2. Research questions ...39
7.3. Research limitations ...40
7.4. Recommendations for future research ...41
7.5. Summary ...42
References ...43
Appendix A: Overview of the best practices ...46
Appendix B: Case selection: reviewed projects (in Dutch) ...48
Appendix C: Scorelijst versie 1 (in Dutch) ...50
Appendix D: Scorelijst versie 2 (in Dutch) ...52
Appendix E: Scorelijst versie 3 (in Dutch) ...54
Appendix F: Scorelijst versie 4 (in Dutch) ...56
Appendix G: Scorelijst proces experts (in Dutch) ...58
Appendix H: Convergence of process experts’ scores ...64
Appendix I: K-P models ...67
Appendix J: Kendall’s tau results ...70
1
1.
Introduction
In today’s dynamic business environment, the ability to improve business performance is a critical requirement for any organization. So, many enterprises have recently been pursuing process innovation or improvement to attain their performance goals.
To comprehensively support business process execution, the concept of business process management (BPM) has been proposed. The strategic importance of BPM is becoming more important as a means of optimizing business performance. The ultimate goal of BPM, therefore, is performance management, which includes activities that ensure business goals are consistently being met.
Gartner, in their Business Unit (BU) CIO’s 2010 Agenda, showed that, just as in 2009, business process improvement is the top business priority of BU CIOs of large organizations (Meehan, 2010). Linking business and IT strategies and plans ranks second in the top BU CIO Strategies for 2010 and is expected to stay there in 2013.
Hardjono and Bakker (2006) state that business process management requires a clear relationship between process objectives and strategic objectives. Process objectives should be directed by strategic objectives, such that an (operational) process will always be in harmony with the strategy of the organization. The key question in this relationship is:
“What does a strategic choice mean for an operational process?”
Continuously relevant in practice, this topic of Process Improvement Intelligence is proposed in the scientific literature to describe the strategic alignment of a business process and its (strategic) objectives. This research extended the current state of research in this topic. The outline of this introduction is as follows. Firstly, the problem statement is discussed and motivation for this research is given. This research was done in collaboration with Berenschot, which is introduced next. Lastly, the outline of this report is presented.
1.1.
Problem statement and motivation
The literature review (Jenniskens, 2011) revealed a substantial gap in the literature in the topic of strategic alignment of BPM. In short, there is no framework translating strategic objectives into performance dimensions which can be used to direct a business process improvement initiative. As a result, in the diagnosis phase of BPM, it is difficult to decide which process should be improved to achieve a specific performance goal of which performance index is influenced when a specific business process is executed successfully.
Therefore, the following research question was addressed in this thesis:
How can the project goals guide process improvements to ensure the continual tight linkage of organizational goals and business processes?
2
By answering this research question, this thesis extended the current field of research in the following ways. Using the regulative cycle (van Strien, 1997), a Process Improvement Intelligence framework was developed for measuring alignment in business process improvement projects in general. Because (project) objectives were translated into performance dimensions using the devil’s quadrangle, this research extended the business performance management literature, as indicated by Neely et al. (2005). These performance dimensions were proposed to guide a business process improvement initiative, adjoining Reijers and Liman Mansar (2005) research on best practices in business process redesign. This research validated the research of Reijers and Liman Mansar (2005) in the public domain, using business process improvement projects conducted at Berenschot. By evaluating their business process improvement projects, Berenschot can improve the alignment of their process improvements to the objectives of a client, thereby improving its service level. Next, Berenschot’s company profile is introduced.
1.2.
Company profile
The research performed in this thesis has been conducted in collaboration with Berenschot. Berenschot has been an independent organizational consulting firm for over 70 years in both the public and private sector in the Netherlands. Nowadays they are still mainly focused on the Dutch market, but with an office in Brussels and as a partner in the E-I Consulting Group, they are now an independent consulting agency in the Benelux with 500 employees.
This thesis has been written during an internship at Berenschot’s expertise group Information Management, which helps the public sector keeping control of their ICT and related projects, achieving the best results and saving on costs. They are often involved in the computerization of processes, which improves services, makes processes more efficient and in some cases, cuts costs. In the public sector, Berenschot uses a project-based approach. The public sector thereby consists of the Dutch government, provinces, regional water authorities and municipalities. In this thesis, only projects within provinces and municipalities were analysed. These will be referred to as projects within local governments.
Many of these projects can be characterized as business process improvement projects. As laid out in the chapter 3, they therefore follow the Process Improvement Intelligence framework. Using this adaptation of the regulative cycle, this thesis reflected on the way these projects are conducted by Berenschot.
Usually, these projects are done by multidisciplinary teams. These teams consist of experts from various field of expertise. The experts, which were asked to take part in this research, are presented in section 4.3.
3
1.3.
Research structure
The remainder of this report is structured as followed.
Chapter 2 describes the literature review conducted before this research. The literature review methodology is described, the status quo of the performance measurement and strategic alignment literature is addressed briefly and the relevant gaps in the literature are identified.
Chapter 3 discusses the research design and methodology. Using the research objective, a conceptual model for business process improvement projects is adapted from the regulative cycle (van Strien, 1997) and the research questions are derived. Next, the research methodology is described in detail, including the case selection, scoring experiments and the derivation of hypotheses.
Chapter 5 explains the statistical methods used before presented the results obtained. Chapter 6 follows a discussion of those results and the report is concluded in chapter 7 with recommendations, future research and limitations.
4
2.
Background
The research was based on a systematic literature review (Jenniskens, 2011), in which the field of alignment of organizational strategy and business process performance was explored. The literature review consisted of several steps. First, to scope the search of relevant literature, the following research questions were formulated:
How can the effects of a process improvement project be measured?
1) What frameworks for measuring process performance (in general) exist? 2) How to develop a (specific) process performance measurement system?
How can we associate process performance measurements to strategic objectives and stakeholder measures?
1) What frameworks for modelling strategic objectives exist?
2) What links are there between strategic objectives and performance measurements? 3) How can we derive performance measurements from strategic objectives?
The first research question focused on the measurement of business process improvements in general; this research question was divided into two sub questions, focusing on (1) the measures of (process) performance in general and (2) the development of a process performance measurement system. The second research questions focused on the association of process performance measurements to strategic objectives and stakeholder measures; the sub-questions focused on (1) strategic objective frameworks, (2) the relationship between strategic objectives and performance measurements and (3) tools that make this relationship explicit.
The scientific search engines ABI/Inform, Springerlink and Google Scholar were used to generate a long list of potentially useful articles. ABI/Inform was selected for its large availability of journals in numerous fields of research (e.g. business). Springerlink was selected for its availability of journals specifically in computer science. Google Scholar was used to cross-check the references with the other two search engines and to complement the search results. The long list, consisting of 52 articles, was scored on relevance, recentness and quality of the source. The resulting 20 articles served as input to the literature synthesis. A more detailed description of the literature research methodology can be found in Jenniskens (2011).
This chapter summarizes the literature review, beginning with an explanation of the concepts used throughout this report. Then, the results of the literature review are presented.
2.1.
Processes
A process can be identified by four key features (Zairi, 1997): 1) Predictable and definable inputs
2) A linear, logical sequence or flow
3) A set of clearly definable tasks or activities 4) A predictable and desired outcome or result
5
In an organizational context, a process is an approach for converting inputs into outputs. In the context of Berenschot (section 1.2), the process ‘providing subsidiaries’ of a municipality converts subsidy requests (inputs) into accepted or rejected subsidies (outputs). In the next section, this notion of a process is used to evaluate the performance of a process, by using performance indicators related to inputs and outputs.
Specifically, in this report, business processes are the subject of interest. One of the fundamentals of BPM is the following definition of a business process, which is used in this report (Hammer & Champy, 1993):
“A business process is a collection of activities that takes one or more kinds of input and creates an output that is of value to the customer. A business process has a goal and is affected by events occurring in the external world or in other processes”
Next, the performance dimensions used in this report are described and related to the process concept described above.
2.2.
Process performance
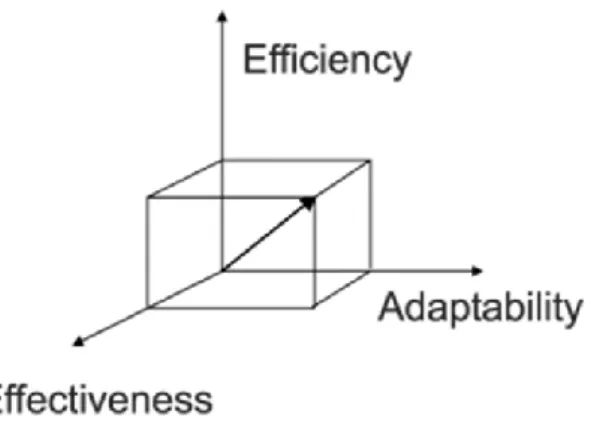
As can be concluded from the literature review (Jenniskens, 2011), there are two classifications of performance dimensions: time, cost, quality and flexibility and efficiency, effectiveness and adaptability. Graphically, these are presented as the devil’s quadrangle (Brand & van der Kolk, 1995) and the three dimensions of performance (Moseng & Bredrup, 1993):
These two functions of performance dimensions are similar in their calculation of the performance of a system. The devil’s quadrangle’s area is a direct function of the measurements in the indicator groups: time, cost, quality and flexibility. The volume of the rectangular prism is a direct function of the measurements in the indicator groups: efficiency, effectiveness and adaptability. However, the two frameworks differ in their application. Because the devil’s quadrangle explicitly states that a trade-off must be made (i.e. it is impossible to improve on all four dimensions at once), it is more suitable to decision-making processes e.g. business process improvement projects (Jansen-Vullers,
Figure 2.1 The devil's quadrangle (adopted from Jansen-Vullers, Loosschilder, Kleingeld & Reijers, 2007)
Figure 2.2 The three dimensions of performance (adopted from Moseng and Bredrup, 1993)
6
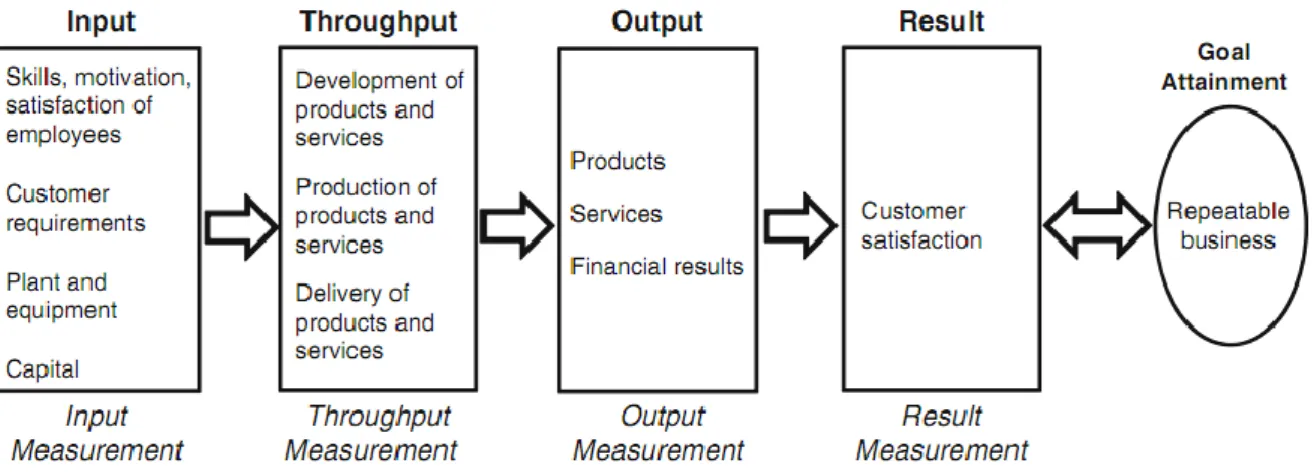
Loosschilder, Kleingeld, & Reijers, 2007). In chapter 3, a conceptual model is proposed to describe these business process improvement projects; the devil’s quadrangle has a key role in this model. Efficiency, effectiveness and flexibility can be used to adopt a process-based perspective on performance, by regarding resources as inputs (cf. efficiency), process results as outputs (cf. effectiveness), and viewing flexibility as an inherent aspect of process execution (cf. adaptability) (Beamon, 1999). This based perspective on performance corresponds to the process-oriented performance framework developed by Brown (1996):
Figure 2.3 Process-oriented framework proposed by Brown (1996) (adopted from Heckl & Moormann, 2010)
Brown adds performance indicators related to the result, which is important because the customer is the ultimate stakeholder of the process. This view is implemented in several current management paradigms such as Lean Management/Kaizen, Michael Porter’s Value Chain and Kaplan & Norton’s Value Proposition. In the example process ‘providing subsidiaries’ subsidy requests are the input of the process; throughput would be the judgement activities of the municipality to decide whether or not to accept the request; outputs are the accepted or rejected subsidies and the outcome would be the customer (who applied for the subsidy) satisfaction.
2.3.
Objectives and targets
In general, an objective can be defined as “something that one's efforts or actions are intended to attain or accomplish”1. It this report, it is used as a synonym to ‘goal’. Organizational objectives can be strategic objectives, for example ‘improve customer satisfaction’ or ‘increase profits’. On a lower level (operational level), these objectives could be translated into ‘decrease error rate’ or ‘decrease throughput time’. Objectives are usually accompanied by targets. Targets are numerical values which are pre-determined as indicators success or failure. Examples of targets for the objectives above could be ‘5% error rate’ or ‘7 week throughput time’.
A key performance indicator (KPI) is a metric that helps you understand how you are doing against your objectives. In the examples above, the corresponding KPIs would be the (current) metrics for ‘error rate’ and ‘throughput time’.
1
7
Performance measurement frameworks provide a categorization of performance indicators (KPIs), similar to the process-oriented framework developed by Brown (1996) discussed above. One potential approach is to think of individual KPIs not just as a single metric, but as a balanced metric that incorporates several alternative dimensions. Most common in practice, the Balanced Scorecard provides a set of measurements from four perspectives: financial, internal business processes, customer and learning & growth (Kaplan & Norton, 1992). By giving information from four perspectives, the number of measures is limited and it forces managers to focus on the handful of measures that are most critical. As a performance management tool, the balanced scorecard is designed to assist management in aligning, communicating and tracking progress against on-going business strategies, objectives and targets. The main weakness of this approach is that it is primarily designed to provide managers with an overall view of performance, but does not direct improvement projects on the business operational level. Thus, the balanced scorecard is primarily designed as a monitoring and controlling tool rather than an improvement tool (Neely et al., 2000). In practice therefore, there is a significant gap between performance indicators and improvement initiatives. This strategic alignment of BPM has become an emerging topic in Business Process Management literature. It is introduced in the next section as well as some tools to make this relationship between strategic goals and business processes explicit.
2.4.
Strategic alignment of BPM
A definition of strategic alignment of BPM is given by de Bruin and Rosemann (2006):
“Strategic alignment of BPM is the continual tight linkage of organizational priorities and enterprise processes enabling the achievement of business goals.” (de Bruin & Rosemann, 2006, p. 4)
‘Alignment’ can be defined as “the act of adjusting or aligning the parts of a device in relation to each other”2. In this case, the device is BPM and the parts are organizational priorities and enterprise processes. Organizational priorities are a function of an organization’s objectives and corresponding KPIs. Strategic alignment of BPM thus examines the alignment of business processes and (strategic) objectives. To align processes with corporate strategy, Brenner and Coners (2010) introduce an instrument known as the Strategic Process Alignment matrix (SPA matrix). The SPA matrix establishes formal, KPI-based relations between strategy and those processes with strategic relevance. A matrix is used to systematically compare the strategic goals. In this way, the contribution of process capital to strategy is assessed based on the criteria of ‘process relevance’ and ‘degree of target achievement’. Process relevance represents a weighting in per cent of how relevant a process is for reaching the strategic goal; degree of target achievement compares the actual value of a performance indicator and a target value.
The SPA matrix, however, does not answer our key question:
“What does a strategic choice mean for an operational process?”
2
8
As a result, in the diagnosis phase of BPM, it is difficult to decide which process should be improved to achieve a specific performance goal of which performance is influenced when a specific business process is executed successfully. Therefore, it is necessary to establish a process-based performance measurement model (Han, Choi, Kang, & Lee, 2010). Their Process-Based Performance Measurement Model (PPMM) therefore holds an integrated view of the KPI model, process model and K-P model, which represents the relationship between KPI and business processes. This correlation scheme between business process and KPIs is not clearly established in the current measurement practices (Han et al., 2010).
2.5.
Literature review conclusions
Process performance can be measured in two classifications performance dimensions, which differ in their application. The devil’s quadrangle (Brand & van der Kolk, 1995) constitutes a trade-off between the indicator groups time, costs, quality and flexibility (i.e. it is impossible to improve on all four dimensions at once); therefore, it is more suitable to decision making processes (e.g. business process improvement projects). On the other hand, efficiency, effectiveness and flexibility can be used to adopt a process-based perspective on performance, by viewing resources as inputs (cf. efficiency), process results as outputs (cf. effectiveness), and viewing flexibility as an inherent aspect of process execution (cf. adaptability) (Beamon, 1999); therefore, it is more suitable to performance measurement systems.
Strategic objectives are high-level goals of an organizational, while targets provide a measurable value for success or failure in reaching those goals. A key performance indicator (KPI) measures your current performance against those targets. KPIs can be categorized in a performance measurement framework. Recalling, the balanced scorecard is a valuable framework suggesting important areas in which performance measures might be useful, but it provides little guidance on how the appropriate measures can be identified, introduced and ultimately used to manage business (Neely et al., 2000). In practice therefore, there is a significant gap between key performance indicators and business process improvement initiatives. This strategic alignment of BPM has become an emerging topic in Business Process Management literature.
Strategic alignment of BPM examines the alignment of business processes and (strategic) objectives. A correlation scheme between business process and KPIs is not clearly established in the current measurement practices (Han et al., 2010). Therefore, they developed a K-P model, which represents the relationship between KPIs and business processes. However, this tool does not include the performance improvement of a business process and its measurable effect on the KPIs.
As a result, in the diagnosis phase of BPM, it is difficult to decide which process should be improved to achieve a specific performance goal of which performance index is influenced when a specific business process is executed successfully.
In short, while a performance measurement framework (such as the Balanced Scorecard) helps to translate (strategic) objectives into (organizational) targets (KPIs), it does not provide any guidance to a business process improvement project. There is no framework translating strategic objectives into performance dimensions which can be used to direct a business process improvement initiative.
9
3.
Research design and methodology
This chapter outlines the research design and approach. First, business process improvement projects are discussed using a conceptual model. A separate section is devoted to business process improvement heuristics, which are part of the conceptual model. Next, the research objective and research questions are presented. Then, the research model which was adopted in this thesis is presented. Lastly, the research methodology used to provide an answer to the research questions is described.
3.1.
Business process improvement projects
In general, a business problem solving project is undertaken to improve the performance of a certain business system or organizational unit. A typical business problem solving project consists of three parts (van Aken, Berends, & van der Bij, 2006):
A design part in which a redesign of the business system or organizational unit is made on the basis of a problem definition, analysis and diagnosis, plus a plan of action for changing the organization to implement the proposed redesign.
A change part in which the redesign is realized through an intervention in the current organizational roles and routines, plus the implementation of new tools or information systems.
A learning part in which the organization evaluates the performance of the business system or organizational unit after the redesign intervention has been undertaken. This performance evaluation can be compared to the project goals.
A logical set-up of the classic problem solving cycle is the so-called regulative cycle (van Strien, 1997). The regulative cycle is designed for business problem solving projects in general. In this thesis, the regulative cycle was adapted to business process improvement projects and used as a framework of reference; presented in this section, this conceptual model improved the understanding of business process improvement projects and the research objective and the corresponding research questions. Contrary to business problem solving projects, which solve a business problem, business process improvement projects involve the improvement of a business process. The scope of these projects is narrow and short-term (Davenport, 1993) (as opposed to business process reengineering projects). The object of improvement is usually a single business process.
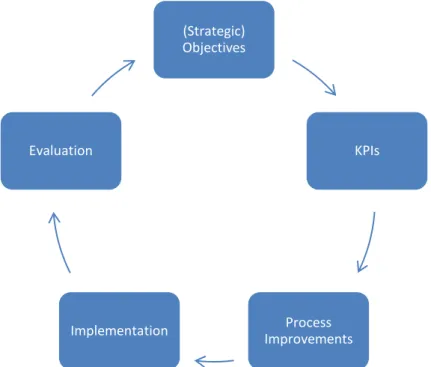
An overview of the adapted regulative cycle is shown in Figure 3.1 below. By explicitly visualizing the relationship between two steps of the regulative cycle, they assist modellers in conducting business process improvement projects. Next, each of steps in the cycle will be reviewed briefly and research gaps will be identified.
(Strategic) objectives are regarded as the starting point of the cycle. An organization wants to improve a business process and chooses to intervene by starting a business process improvement project. The objectives resemble the goals of the project (cf. a problem statement in the regulative cycle). As discussed in section 2.3, objectives can be translated into Key Performance Indicators (KPIs), which reflect the current performance by means of a performance measurement framework (e.g. the Balanced Scorecard). Therefore, the KPIs reflect the performance of the ‘as-is’ situation.
10
Figure 3.1 The regulative cycle adapted to a business process improvement project
The transition from the ‘as-is’ situation to the ‘to-be’ situation constitutes a significant gap in the literature. Or, to put it in the words of Sharp and McDermott (2001): “How to get from the as-is to the to-be isn’t explained, so we conclude that during the break, the famous ATAMO procedure is invoked – And Then, A Miracle Occurs”. Therefore, the focus of this thesis is on that transition (from KPIs to Process Improvements).
Rosemann (2010) provides four ways to process improvement:
Figure 3.2 Four ways to process improvement (adopted from Rosemann, 2010)
(Strategic) Objectives KPIs Process Improvements Implementation Evaluation
New
Process
Derivation (better practices) Innovation (new practices) Utilisation (potential practices) Enhancement (current practices) Analytical Creative11
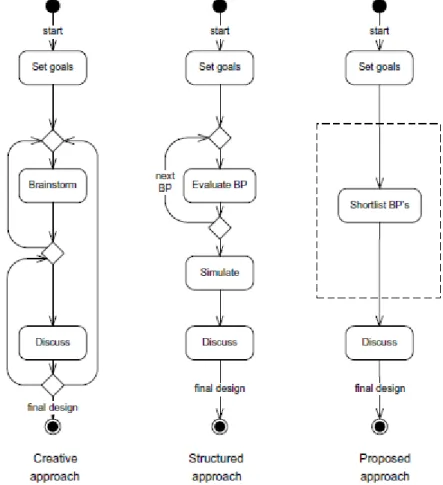
Limam Mansar, Reijers, and Ounnar (2009) provide the following overview of the creative, analytical and their proposed way to process improvement:
Figure 3.3 Overview of the creative, analytical (label 'structured') and proposed way to process improvement
The creative approach corresponds to Rosemann’s creative ways to process improvement, namely innovation and utilisation. Starting from a set of goals, brainstorming sessions and discussions will be held to create an improved process design. As mentioned above, these are more suitable to business process reengineering projects (which require radical innovation). The structured approach corresponds to Rosemann’s analytical ways to process improvement, namely derivation and enhancement. Because business process improvement projects involve incremental improvement taken the current process as starting point, a structured approach is adopted in these projects. This approach builds on an extensive list of potentially effective practices to improve the current process. Key element in this approach is the ‘best practices’ (BP), which are evaluated for their applicability on improving the current process. Simulation can be used to measure the effect of the process improvement. The best practices are a predefined list of process improvement heuristics. These are introduced next, before discussing the proposed approach of this thesis.
12
3.1.1. Process improvement heuristics
Process improvement heuristics prescribe how a process can be improved. These prescriptions are general, so they can be replicated in any situation or setting. These heuristics are applied to the current process to improve its performance. Taking the current process as a starting point contrasts sharply with so-called clean-sheet approaches, i.e. where the process is designed from scratch. The ‘best practices’, as presented in Reijers and Liman Mansar (2005), provide a set of process improvement heuristics which have proved to be useful in improving business processes. To measure the impact of the best practices on performance, they are evaluated qualitatively using the dimensions of the devil’s quadrangle (as described in section 2.2). However, most of the best practices lack the support of an analytical or empirical study. The authors indicate that additional work should point out the conditions or domain validity where a best practice would give the expected results in terms of cost/time reduction or quality/flexibility improvement. Taking this research as an example, in this thesis, the performance impact of the process improvements was scored. Since these business process improvement projects were conducted in the public domain, this thesis validated the research of Reijers and Liman Mansar (2005) in this sector. The best practices are added as appendix A and will be used in the discussion of the results. Contrary to the original paper (Reijers & Liman Mansar, 2005), in this report the effect of the best practices was evaluated qualitatively (instead of the impact of the best practices). Thus, a best practices may have a negative impact on time and costs (i.e. it decreases time and costs of the process); in this thesis, this was reported as a positive effect on time and costs (i.e. it enhances the time and costs dimensions).
Returning to the approaches to process improvement (as displayed in Figure 3.2), in this thesis, an approach was proposed that involved shortlisting the best practices. This shortlisting is done using the goals of project, the (strategic) objectives in the first step of the adapted regulative cycle. It thereby filled the literature gap as identified in chapter 2:
There is no framework translating strategic objectives into performance dimensions which can be used to direct a business process improvement initiative.
The shortlist gives a focus to a set of best practices that could potentially be applied to improve the performance of the current process (Limam Mansar et al., 2009). By providing such a shortlist, it cuts out a number of best practices and narrows the scope for the discussion. The result of this discussion is a decision which process improvement heuristic(s) will be applied to the current process.
The next steps of the adapted regulative cycle (implementation and evaluation) fall outside the scope of this thesis. During the implementation phase, roles and work processes are changed on the basis of the solution design and change plan. A formal evaluation compares the performance after the project to the targeted performance to evaluate if the improvement indeed has been realized. This can be done using the KPIs as discussed in section 2.3. This may lead to another business problem solving project.
13
3.2.
Research objective
While a performance measurement framework (such as the Balanced Scorecard) helps to translate (strategic) objectives into KPIs (which describe the ‘as-is’ situation), it does not provide any guidance to a business process improvement project. The KPIs, defined in the performance measurement framework, are organization specific and often constructed at the start of a business process improvement project, therefore project-specific (see Figure 3.1). Therefore, the following research objective was the goal of this thesis:
Ultimately, by measuring the alignment of business process improvement projects, improving the way these projects are undertaken in practice. To achieve this goal, the selection of process improvement heuristics will be guided the project goals. By examining the statistical relationship between the two, this thesis established that guidance.
In the previous section, the regulative cycle (van Strien, 1997) was adapted to describe the way business process improvement projects are undertaken in practice. To recall, in this thesis it is proposed to enhance this way by creating a shortlist of process improvement heuristics based on the project goals. Alignment between the project goals and the process improvement heuristics therefore plays an important role. In this thesis, the term ‘Process Improvement Intelligence’ is proposed to describe this matching of project goals and process improvement heuristics. The research methodology, presented in section 3.6, describes how this relationship was examined. First, however, the research questions are presented.
3.3.
Research questions
Identified as the most important gap in the literature (Jenniskens, 2011), there is no framework translating strategic objectives into performance dimensions which can be used to direct a business process improvement initiative. Such a framework enhances the way business process improvement projects are undertaken, as illustrated with the adapted regulative cycle in the section 3.1. Following the research objective presented above, the main research question for this thesis was formulated as follows:
How can the project goals guide process improvements to ensure the continual tight linkage of organizational goals and business processes?
In terms of the adapted regulative cycle presented in the previous section, this research question resembles the transition from the KPIs to the process improvements. On a lower level, to examine the relationship between the two, the following sub research question was proposed:
How can the alignment of a business process improvement project be measured?
By providing an answer to this sub research question, this thesis establishes the guidance in selecting the process improvement heuristic(s) as mentioned above in the research objective. The next sections present the research methodology, which was used to provide an answer to this sub research question.
14
3.4.
Research model
To provide an answer to the research questions proposed in the previous section, the following research model is followed.
Figure 3.4 Research model followed by this thesis (between brackets indicate corresponding chapters)
Using the literature as a background and the adapted regulative cycle as a reference model, the next section builds theory about Process Improvement Intelligence, i.e. the alignment between project goals and process improvements.
A powerful research method for theory testing is case research (Voss, Tsikriktsis, & Frohlich, 2002). Case research is the method that uses case studies as its basis. By using case studies, actual data is used from practice (as opposed to a controlled setting), which increases the (practical) relevance of the theory. Furthermore, in the time frame of this thesis, it was not possible to create a controlled setting for a business process improvement project that approaches a real-life scenario.
Using multiple cases has several advantages over using a single case:
Choice Advantages Disadvantages Single
cases Greater depth
Limits on the generalizability of conclusions drawn. Biases such as misjudging the representativeness of a single event and exaggerating easily available data
Multiple cases
Augment external validity, help guard against
observer bias
Less depth per case
Table 3.1 Choice of a number of cases (adopted from Voss et al., 2002)
By using multiple case studies, the theory as presented above could be tested and future outcomes could be predicted, because the generalizability is higher than using a single case. An important prerequisite for generalizable future outcomes is a large-scale sample of population. However, this
1st stage Business process improvement cases Process Improvement Intelligence Scoring experiments Discussion and conclusions
Literature (2) Empirical study (3-4-5) Outcomes (6-7)
2nd stage Performance management literature Strategic Alignment of BPM Process Improvement Heuristics Business process improvement cases Statistical analysis
15 Quality Time Cost Flexibility Quality Time Cost Flexibility
was not available in this thesis and caused a research limitation, as will be discussed in section 6.4 (‘sample issues’).
Importantly, multiple case studies can help guard against observer bias. Because the research performed in this thesis required interpretation of data, observer bias could be a potential problem. As will be discussed in the next chapter, a project member was asked to validate the observations to guard against observer bias. A disadvantage of using multiple cases is that they may reduce the depth of study when resources are limited, which is the case in this time-bound thesis project. However the augmented external validity outweighs this disadvantage.
3.5.
Process Improvement Intelligence
To measure the alignment of project goals and process improvements, a common platform was created to compare the two. The common platform used in this thesis is the devil’s quadrangle, as described in section 2.2, because it requires a trade-off (i.e. it is impossible to improve on all four dimensions at once). Therefore, it is more suitable to decision-making processes such as business process improvement projects. By translating the project goals into the performance dimensions time, costs, quality and flexibility, this thesis created a platform for comparing project goals and process improvements. Thereby, this thesis addressed to following question, as mentioned by Neely, Gregory and Platts (2005):
“Do “generic” performance indicators actually exist?” (Neely et al., 2005, p. 1255)
Neely et al. (2005) use the term ‘generic performance indicators’ to describe performance dimensions.
In this thesis, the following conceptual model to measure Process Improvement Intelligence is proposed:
Project goals Process improvements
Figure 3.5 Measuring the alignment of project goals and process improvements
16
Both the project goals and the process improvements were evaluated using the devil’s quadrangle. Their performance dimensions were matched. There are two possible outcomes:
1) Their scores matched (statistically). This will be labelled ‘alignment’.
2) Their scores did not match (statistically). This will be labelled ‘misalignment’.
3.6.
Research methodology
To test this theory, the following case research approach was followed:
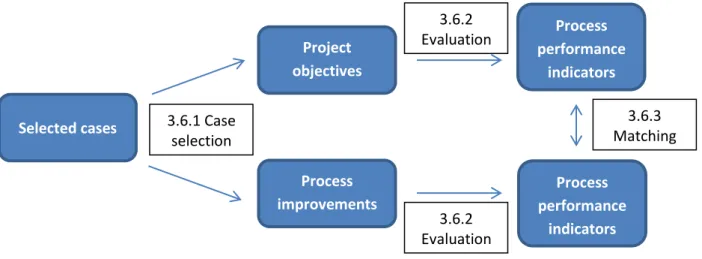
Figure 3.6 Followed case research approach
In the next sections, these steps of the case research approach are discussed extensively.
3.6.1. Case selection
The cases were selected at Berenschot, which was introduced in section 1.2. As Berenschot performs numerous projects every year, a structured manner to select which projects were suitable cases was evidently of importance. A set of criteria (C1 – C6), which was used to facilitate this selection process, is elaborated upon below.
First, the case should involve the improvement of a business process (C1). Recalling from section 2.1, a definition of a process is given by Hammer and Champy (1993):
“A business process is a collection of activities that takes one or more kinds of input and creates an output that is of value to the customer. A business process has a goal and is affected by events occurring in the external world or in other processes”
In the municipality context of Berenschot, an example of a good business process is ‘providing subsidiaries’.
Second, the project had to involve the improvement of a business process (C2). This is opposed to projects which are undertaken purely for documentation purposes. Because the research involved the evaluation of these process improvements, it was required that they were explicitly stated in the project documentation (this also decreased interpretation bias).
Selected cases Project objectives Process improvements Process performance indicators Process performance indicators 3.6.1 Case selection 3.6.2 Evaluation 3.6.3 Matching 3.6.2 Evaluation
17
Third, the project should have one or more goals known beforehand (C3). These objectives should describe a desired future situation. They could also be documented as targets (SMART format). Again, because the research involved the evaluation of the project goals, it was required that they were explicitly stated in the project documentation.
There were a few practical criteria as well. First, at least one of the participants of the project had to be still working for Berenschot or at least contactable (C4). This was absolutely vital because the extracted data had to be verified with one of the project members. In case of disagreement or the necessity of explanation, the project should be fresh in their memory; the second criterion was that the project had been finished in the past five years (C5). Due to limited amount of scoring time of the objectives from the municipality participants, the target amount of extracted project goals was limited to 80 (the set-up of this scoring experiment is explained in section 4.2) (C6). The corresponding amount of process improvements would be scored by the process experts.
To summarize, in order to be included, a project needed to comply with all criteria (C1 – C6) below: 1. The project should involve the improvement of a business process
2. The project should involve the improvement of a business process 3. The project should have one or more objectives known beforehand
4. At least one of the participants of the project was still working for Berenschot or at least be contactable
5. The project should be finished in the past five years
6. The target amount of extracted organizational target was limited to 80
The criteria were applied to a list of projects of Berenschot Information Management group. The list consisted of 67 projects and is added as appendix B. For C1-C3, a scoring system was used (i.e. present, to some extent, not present); for C4-C6, a knockout system was used (i.e. complies, does not comply). In total, seven projects were selected, which are discussed in section 4.1. Using the project documentation of these selected processes, projects goals and process improvements were extracted. Because it was required (C2-C3) that these were stated explicitly in the project documentation, this involved little interpretation.
3.6.2. Evaluation of project goals and process improvements
The extracted project goals and process improvement are evaluated by two different groups of people. On the one hand, the project goals were scored by municipality employees. These represent the clients of Berenschot in a business process improvement project. On the other hand, the process improvements were scored by process experts of Berenschot. Both groups will score their items on the four performance dimensions of the devil’s quadrangle (time, costs, quality and flexibility).
3.6.3. Matching pairs of goals and process improvements
After the goals and process improvements have been evaluated using the devil’s quadrangle, they are matched and pairs are created (see Figure 3.5). To create these pairs, Han et al.’s K-P model was used (Han et al., 2010), which represents the relationship between KPIs and business processes. This P model was adapted to goals (cf. KPIs) and process improvements (cf. business processes). The
K-18 0 1 2 3 4 5Quality Time Flexibility Costs hp1o1 0 1 2 3 4 5Quality Time Flexibility Costs eavgp2i13 P models were added as appendix I (the data in these models is coded, which is explained in section 4.4). In order to reduce observer bias and increase replicability, one project member from Berenschot was asked to verify these pairs.
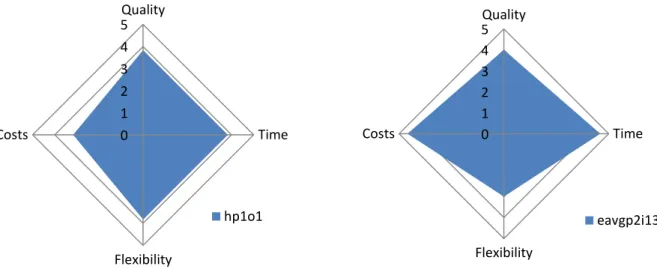
As an example, take in the K-P model of P1-4. This pair matched the project goal ‘all communicating channels should be accessible for customers’ ( ) with the process improvement ‘use electronic forms for subsidy requests’ ( ). The Process Improvement Intelligence drawing becomes as follows (data is taken from the actual data sample):
Figure 3.7 Pair (H17) of matching project goal and process improvement
Recalling the sub research question presented in section 3.3, the alignment of the pairs needed to be measured. Therefore, statistical tests were performed on these pairs to conclude whether they were aligned or misaligned. Specifically, the pair was tested for correlation, which is a measure of the linear relationship between variables (Field, 2005). It was hypothesized that project goals and process improvements correlated positively, which meant that if the project goals would be evaluated higher, the corresponding process improvement would be evaluated higher as well. This indicates alignment between the process goal and process improvement. In case of misalignment, the process improvement was evaluated using the best practices, as described in section 3.1.1. If the misalignment could be explained by one of the best practices (e.g. misinterpretation of effect of a process improvement), the proposed method would still be valid.
In the example above, the project goals and process improvement are negatively correlated i.e. the ‘use of electronic forms for subsidy requests’ has a negative influence on ‘all communicating channels should be accessible for customers’. This can be explained by the loss of flexibility and the expected decrease in costs when using electronic forms. Neither is expected from the project goal. The implementation of the research methodology described in this section will provide an answer to the sub research question.
19
4.
Experimental design
To analyse the data following the research methodology as discussed in the previous chapter, this chapter presents the experimental design. Corresponding to the steps in the case research approach (see Figure 3.6), the following steps are part of the experimental design:
Figure 4.1 Experimental design outlined in steps
Next, each step is discussed in detail.
4.1.
Selected cases
The case selection (section 3.6.1) resulted in the selection of the following seven case studies:
Code Project name (translated) C1 C2 C3 C4 C5 C6 P1 Workshop providing subsidies municipality Landsingerland + + +
P2 Workshop providing subsidies municipality Ouder-Amstel + 0 +
P3 Workshop providing subsidies municipality Eersel + 0 +
P4 Workshop providing subsidies municipality Aalsmeer + 0 +
P5 Information Plan Bureau Verkeersbeheer province
Noord-Brabant + + 0
P6 Granting and maintaining permits province Overijssel + + +
P7 Emergency assistance SOS International + + +
Table 4.1 Overview of the selected projects
Step 4: Statistical analysis (section 4.4)
Using the influence matrix, hypotheses were drawn up in this step and statistical tests were performed on the samples.
Step 3: Scoring procedure of process improvements (section 4.3)
In this step, process experts from Berenschot scored the process improvements of all projects on a five point Likert scale to the dimensions of the devil’s quadrangle.
Step 2: Scoring procedure of project objectives (section 4.2)
In this step, municipality members scored the goals of one project on a five point Likert scale to the dimensions of the devil’s quadrangle.
Step 1: Selected cases (section 4.1)
This step consisted of the extraction of the project objectives, process improvements and their influence matrix from the project documentation.
20
4.1.1. P1-P2-P3-P4
P1, P2, P3 and P4 are four identical workshops (in their set-up) at different municipalities (Landsingerland, Ouder-Amstel, Eersel and Aalsmeer). The workshop involved the modelling of the current process ‘providing subsidies’ as well as some suggestions for improvement (which were not worked out in a to-be model). Because these workshops were held with municipality employees, the projects goals were stated explicitly in the project documentation. Furthermore, the workshops were conducted in 2010-2011 and all project members were still working at Berenschot. Because the project goals and process improvements showed great overlap, these were combined for the four workshops, thereby creating project goals and process improvement of one project, P1-4. This was justified by their relatively small size in comparison to the other projects included and their similarity in project set-up (they were identical).
4.1.2. P5
P5 involved the development of an information plan for the division of a province (Noord-Brabant) that is responsible for traffic management. This involved the modelling of the current and desired business process, based on project goals en recent trends. It also evaluated the IT facilities of the division and created a roadmap for the future. Though the current process and process improvements were present in the project documentation, the project objectives were not stated explicitly. However, because the project was conducted in 2008 and a project member was still working at Berenschot, it could be included in the sample nonetheless.
4.1.3. P6
P6 involved the optimisation of the ‘granting and maintaining permits’ process at a province (Overijssel). This process was documented extensively and both the project goals as the process improvements were stated very clearly in the project documentation (interviewing records were included in the project documentation). The project finished in 2006, but due to the excellent project documentation and the availability of one project member, this project was included in the sample.
4.1.4. P7
P7 redesigned the emergency assistance process of SOS International. Similar to P6, the project was well documented. Therefore, it was included to fulfil C6 (80 organizational targets as will be explained in section 4.2), although the project was finished more than five years ago. However, after the scoring procedure, it was removed from analysis after all, because participants failed to score the project because of a lack of background knowledge (we will return to this in scoring procedure section).
The extracted project goals and process improvements were combined into questionnaires, so they could be scored by the municipality employees and the process experts. These two procedures are described in the next sections.
21
4.2.
Scoring procedure of project objectives
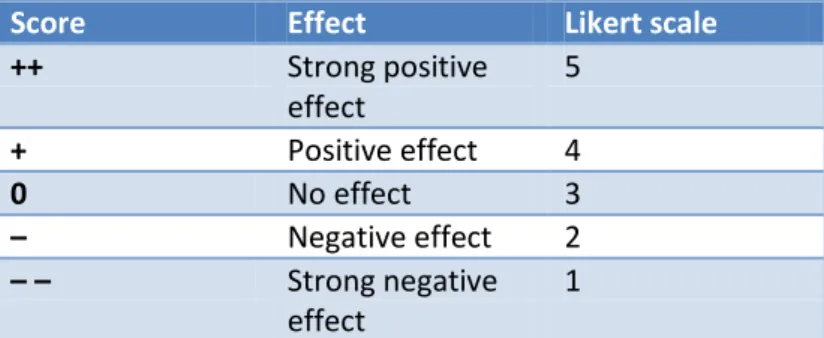
The project objectives were scored by municipality employees. They had to score the selected project objectives on a five point Likert scale to the dimensions of the devil’s quadrangle. The scores resemble the effect of a project objective to the performance dimensions time, cost, quality and flexibility, according to the participant (see Table 4.2 below).
Score Effect Likert scale
++ Strong positive effect 5 + Positive effect 4 0 No effect 3 – Negative effect 2 – – Strong negative effect 1
Table 4.2 Likert scale for scoring the organizational targets and process improvements
In total, 20 municipality employees (head of department of civilians or IT) joined the experiment, which formed a compulsory part of a seminar program. To reduce the time asked of each participant, the target amount of project goals per participant was 20, and it was required that every project goals was scored at least five times. So, the total amount of process goals was limited to 80. The total number of extracted process goals was 76, which meant that at most four questionnaires could be created. As discussed in the previous section, the project goals of P1 to P4 were combined into one questionnaire, while P5, P6 and P7 filled one questionnaire each. The order of the project goals is similar to their order in the project documentation. All four questionnaires are added as appendices.
The procedure was pre-tested by 4 municipality employees before conducting the actual test. Based on the feedback received, two elements were added:
A more elaborate explanation on the four performance dimensions
An obligation to give exactly one score (i.e. not multiple scores or no score)
By shuffling the questionnaires before handing them out to the participants, the four questionnaires were distributed randomly; however, three participants indicated a lack of background knowledge to score P7. Therefore, they were given one of the other questionnaires such that in total, six people scored P1-4, P5 and P6, while only two people scored P7. After a similar situation occurred in the scoring procedure of the process improvements, it was decided to remove P7 from further analysis, because it fell outside the scope of the public sector.
22
4.3.
Scoring procedure of process improvements
The extracted process improvements were scored by process experts from Berenschot, using a Delphi study setup. Following the method of Sánchez, Chaminade, and Escobar (1999), the following figure contains the steps in this study:
Figure 4.2 Phases in the Delphi analysis of the process improvements (adopted from Sánchez et. al, 1999)
All process improvements, which were extracted from the selected case documentation, were combined into one questionnaire (it was still clear which improvements belonged to which project), which is added as appendix G.
Preparation of list of process improvements Selection of experts Sending of scoring list Statistical analysis Consensus Conve rgenc e? Discussion session
23
The following six process experts from Berenschot were prepared to score these process improvements:
Two (managing) consultants in the Information Management expertise (R. Bakker and G. Post-Dijkstra)
Four (managing) consultants in the Business Operational Excellence expertise (C. van der Heyden, M. Hanekamp, W. Dil and N. te Blaay)
Combined with the scoring criteria (see Table 4.2), this questionnaire, which consisted of 76 process improvements, was sent to these six people. As was the case in the scoring by the municipality employees, the process experts’ feedback contained complaints about a lack of expertise in that field. As mentioned above, it was therefore decided to remove P7 from further analysis.
The answers of the process experts were combined and analysed for convergence. Interquartile ranges (IQR) provide a good measure of dispersion for achieving consensus using Likert-type scales for Delphi studies (Triola, 2001). Interquartile range was calculated by taking the difference between the 25th and 75th percentiles. An example scoring of one process improvement was: 3, 4, 4, 4, 5 and 5. The 25th percentile (1st quartile) is 4 and the 75th percentile (3rd quartile) is 4.75. Therefore, the interquartile range was 0.75. Consensus was assumed when interquartile range score of less than 1.2 was achieved (Triola, 2001). The results (added as appendix H) showed that 20 scores did not converge, which is approximately 10% of all scores. This result was considered reasonable. However, in case of a small sample size (n=6 in this case), IQR can inflate heavily because of outliers. Therefore, based on the 80/20 rule, the criterion that consensus is achieved by having 80 per cent of participants’ scores fall within two score-range on the five point Likert scale was applied (Ulschak, 1983). In the example scoring above, 100% of the scores fell within the two score-range. The results (added as appendix H) showed that 13 scores, which is approximately 5% of all scores did not converge. These percentages indicated that there was no reason to doubt the convergence between the process experts. Thus, after the first scoring round, the workshop organized to discuss the main difference between the scores (and give the experts opportunity to score the process improvements again), was cancelled and all scores were statistically analysed.
The sample size in most Delphi studies has been study specific. If experts are selected who have similar training and general understanding of the problem of interest, a relatively small sample can be used (Akins, Tolson, & Cole, 2005). Although the process experts had different years of expertise in this field, they had similar on-the-job training and a common understanding of the problem because they had all been working for Berenschot for a number of years. The consensus scores in appendix H demonstrate their shared line of reasoning.
Both the scores for the project goals and the scores for the process improvement were saved in a dataset. To conduct statistical tests on this dataset, the scores had to be coded into variables.