Imperial College of Science, Technology and Medicine
Department of Computing
Multi-Sensor Fusion for Human-Robot
Interaction in Crowded Environments
Stephen John McKeague
Supervised by Professor Guang-Zhong Yang
Submitted in part fulfilment of the requirements for the degree of Doctor of Philosophy in Computing of Imperial College London, March 2015
Abstract
For challenges associated with the ageing population, robot assistants are becoming a promising solution. Human-Robot Interaction (HRI) allows a robot to understand the intention of humans in an environment and react accordingly. This thesis proposes HRI techniques to facilitate the transition of robots from lab-based research to real-world environments.
The HRI aspects addressed in this thesis are illustrated in the following scenario: an elderly per-son, engaged in conversation with friends, wishes to attract a robot’s attention. This composite task consists of many problems. The robot must detect and track the subject in a crowded environment. To engage with the user, it must track their hand movement. Knowledge of the subject’s gaze would ensure that the robot doesn’t react to the wrong person. Understand-ing the subject’s group participation would enable the robot to respect existUnderstand-ing human-human interaction.
Many existing solutions to these problems are too constrained for natural HRI in crowded environments. Some require initial calibration or static backgrounds. Others deal poorly with occlusions, illumination changes, or real-time operation requirements. This work proposes algorithms that fuse multiple sensors to remove these restrictions and increase the accuracy over the state-of-the-art.
The main contributions of this thesis are:
1) A hand and body detection method, with a probabilistic algorithm for their real-time asso-ciation when multiple users and hands are detected in crowded environments.
2) An RGB-D sensor-fusion hand tracker, which increases position and velocity accuracy by combining a depth-image based hand detector with Monte-Carlo updates using colour im-ages.
3) A sensor-fusion gaze estimation system, combining IR and depth cameras on a mobile robot to give better accuracy than traditional visual methods, without the constraints of tradi-tional IR techniques.
4) A group detection method, based on sociological concepts of static and dynamic interactions, which incorporates real-time gaze estimates to enhance detection accuracy.
Declaration of Originality
I hereby declare that the work presented in this this thesis is my own, except where appropriately referenced.
Stephen John McKeague
©The copyright of this thesis rests with the author and is made available under a Creative Commons Attribution
Non-Commercial No Derivatives licence. Researchers are free to copy, distribute or transmit the thesis on the condition that they attribute it, that they do not use it for commercial purposes and that they do not alter, transform or build upon it. For any reuse or redistribution, researchers must make clear to others the licence terms of this work.
Dedication
For God so loved the world, that he gave his only begotten Son, that whosoever believeth in him should not perish, but have everlasting life
John 3:16
To my family, past and present To Marta
Acknowledgements
First and foremost I would like to thank Professor Guang-Zhong Yang for giving me the oppor-tunity of doing a Ph. D. under his supervision. I am also very grateful for his financial support and his trust in my studies.
I would like to offer my heartfelt gratitude to the members of the Grundy Educational Trust for their generous financial aid during my time at Imperial. To Jindong, who stayed awake till the early hours of the morning drafting my late conference submissions, thank you. Thanks, as well, to Javier, whose friendship, advice and knowledge I found invaluable. Indeed, the friendship I have been shown by all those in the Hamlyn Centre, including Piyamate, Ed, Charence and Alex, has made my time here a rewarding experience. To all the people at Calvary Chapel Westminster, I am very grateful for the kindness you have shown to me.
I wish to recognise the support and love, before and throughout my Ph. D., that I have been shown by my family and by my fianc´ee, Marta. Finally, I would be amiss in not making special mention of my mother, Janice McKeague, and father, Brendan Hugh McKeague, who have invested so much in me. Thank you.
List of Acronyms
HRI Human-Robot Interaction
RGB Red-Green-Blue
LED Light-Emitting Diode TOF Time of Flight
SVM Support Vector Machine
HMM Hidden Markov Model
PCA Principal Component Analysis SVD Singular Value Decomposition BGS Background Subtraction ROS Robot Operating System
RAM Random-Access Memory
KB Kilobyte MB Megabyte GB Gigabyte MHz Megahertz GHz Gigahertz 11
Contents
Abstract 3 List of Acronyms 11 1 Introduction 35 1.1 Background . . . 35 1.2 Thesis Structure . . . 37 1.3 Thesis Contributions . . . 39 1.4 Publications . . . 402 Human-Robot Interaction - A Literature Review 41 2.1 Introduction . . . 41
2.2 People and Group Detection . . . 44
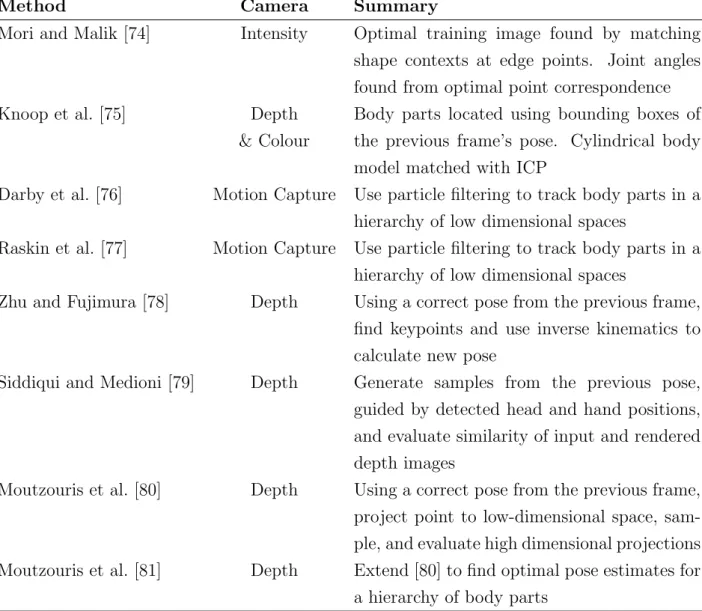
2.3 Localising Body Parts . . . 52
2.3.1 Explicit Hand Detection and Tracking . . . 53
2.3.2 Model Fitting . . . 59
2.4 Gesture Recognition . . . 64
2.5 Gaze Estimation and Human Attention Detection . . . 70
2.6 Conclusions . . . 76 13
3 Hand and Body Association in Crowded Environments for Human-Robot Interaction 79 3.1 Introduction . . . 79 3.2 Method . . . 81 3.2.1 Hand Detection . . . 82 3.2.2 Body Detection . . . 89 3.2.3 Hand-Body Association . . . 92 3.3 Results . . . 94 3.3.1 Algorithm Validation . . . 96
3.3.2 Results in Controlled Environments . . . 99
3.3.3 Results in Crowded Environments . . . 102
3.4 Conclusions . . . 105
4 An Asynchronous RGB-D Sensor Fusion Hand Tracking Framework using Monte-Carlo Methods 107 4.1 Introduction . . . 107
4.2 Method . . . 109
4.2.1 Hand State Prediction and Depth Update . . . 110
4.2.2 Detection-less Monte Carlo RGB Position Update . . . 114
4.2.3 RGB Likelihood Function . . . 117
4.2.4 RGB Colour and Direction Update . . . 119
4.2.5 Asynchronous Measurement Update . . . 121
4.3 Results . . . 122
4.3.1 Velocity Estimation Results . . . 124
4.3.2 Results in Controlled Environments . . . 126
4.3.3 Results in Crowded Environments . . . 127
CONTENTS 15 5 Gaze Estimation using a Long-Range Infrared Eye Tracker with Sensor
Fu-sion 131
5.1 Introduction . . . 131
5.2 Method . . . 135
5.2.1 System Setup . . . 135
5.2.2 Eye Detection . . . 136
5.2.3 Depth-Based Gaze Estimation . . . 138
5.2.4 Sensor Fusion Gaze Estimation . . . 141
5.3 Results . . . 146
5.3.1 Depth-Based Gaze Estimation Results . . . 147
5.3.2 Sensor-Fusion Gaze Estimation Results . . . 150
5.3.3 Results Comparison with State-of-the-Art . . . 154
5.3.4 Gaze Estimation in HRI . . . 156
5.4 Conclusions . . . 157
6 Multi-Modal Gaze Contingent Group Detection 160 6.1 Introduction . . . 160
6.2 Method . . . 161
6.2.1 Sociological Group Concepts . . . 161
6.2.2 Pairwise Group Detection . . . 165
6.2.3 Person-to-Group Merging . . . 173
6.2.4 Recursive Merging Algorithm . . . 177
6.3 Results . . . 177
6.3.1 Feature Evaluation . . . 180
6.3.2 Results Analysis . . . 183
6.3.3 Results in Crowded Environments . . . 188
7.1 Technical Contributions of Thesis . . . 196 7.2 Future Work . . . 197
Bibliography 200
Appendix A Support Vector Machines 217
Appendix B Mobile Robot Navigation Frameworks 222
B.1 Player . . . 222 B.2 Robot Operating System . . . 224
Appendix C Gaze Estimation Circuit Diagram 226
Appendix D Proof of Image Permissions 228
List of Figures
2.1 Timeline of major developments in the history of mobile robots. . . 42 2.2 For any HRI task, one of the most common problems to be solved is that of
detecting people, as shown by the hand-drawn red circles in (a). A related problem is that of segmenting detected people into interacting groups, as shown by the hand-drawn black circle in (b). . . 45 2.3 (a) shows illustrations of certain Haar-like features. The value of each feature
is equal to the difference of the sum of the pixel values in the black and white regions. (b) shows hand-drawn, illustratory results of a people detector trained using these Haar-like features. Image sourced from1. . . 47
2.4 Illustration of an integral image. The summation of all pixel values in rectangle
A is given by P4+P1−(P2+P3). . . 49
2.5 (a) is an illustration of 4 overlapping HOG blocks. The smallest squares represent pixels. These are grouped into 9 cells in total, each containing a default of 8×8 pixels. One HOG block is of default size 2×2 cells, and either has a colour of red or yellow, or one of two patterns. (b) shows hand-drawn, illustratory results of a people detector trained using HOG features. Image sourced from 2. . . 50
2.6 Solving the problem of hand detection, as shown by the hand-drawn blue circle, allows a robot to understand human intentions during HRI. . . 52 2.7 Images from the datasets Plagemann et al. used to evaluate their body part
de-tector [1]. (a) shows the method being evaluated under “laboratory conditions”, whilst (b) shows results from “a significantly more complex scene”. Images are sourced with permission from [1]. . . 57 2.8 Illustration of the depth image descriptor from Shotton et al. [2]. A yellow cross
indicates the pixel,x, being classified. From Equation 2.2, the two offsets from each pixel, x, are denoted in the figure as: θ = (u,v). The offsets are illustrated with red circles. . . 58
2.9 Image of the coloured glove used by Wang and Popovi´c [3]. Image sourced with permission from [3]. . . 63 2.10 Illustrations of two different types of HMMs. (a) depicts a left-right HMM,
whilst (b) shows a fully-connected HMM. S1, S2 and S3 represent the states of
the HMM, and arrows indicate a non-zero transition probability between states. 67 2.11 Gaze estimation techniques allow a robot to know where a detected person is
looking, as illustrated by the hand-drawn red arrows on white background. This can be used in solving many other HRI problems, such as that of group detection or socially aware navigation. . . 70
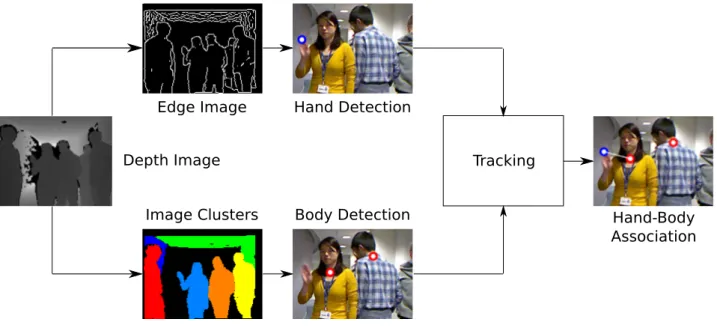
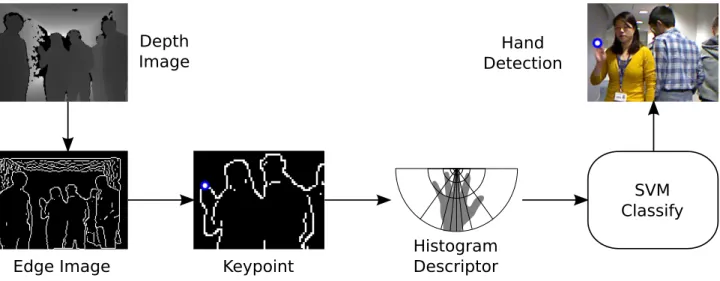
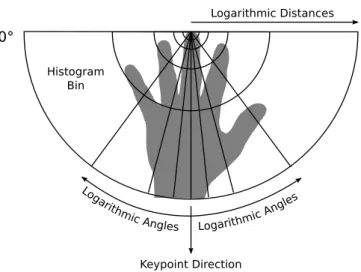
3.1 Illustration of the hand-body association system structure. . . 81 3.2 Illustration of the proposed method for hand detection in crowded environments. 82 3.3 Illustration of the proposed hand descriptor histogram, based on log-polar
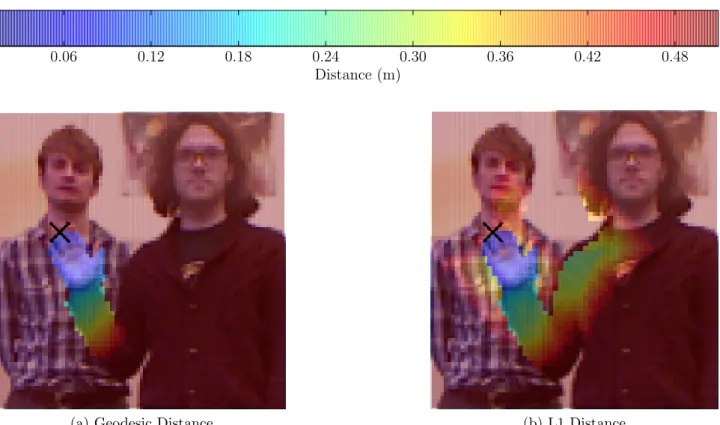
sam-pling. . . 83 3.4 Heat map showing the advantage of using geodesic distances to highlight
impor-tant regions of a hand in crowded environments. Both geodesic and L1 distances within 0.5 m are shown, from a point on the fingertips indicated by a black cross. 84 3.5 Annotated image showing typical results of the connected components algorithm
on the depth point cloud. Separate clusters are coloured differently, with letters indicating the different people in the scene. The gesturing hand, highlighted by the black oval, has been clustered separately from gesturing person “d”. In such crowded scenes, a method of associating hands to the correct person must be devised. . . 90 3.6 Graph showing the SVM classification accuracy of the proposed hand descriptor,
for a range of angle and distance bins. Accuracy clearly increases with the number of angle bins used. Figure similar to the published paper on this work [4]. 96 3.7 Graph comparing sensitivity of the proposed descriptor and the shape context.
The proposed descriptor outperforms the shape context for every number of angle and distance bins. . . 97 3.8 Graph showing the effect of differing per-frame likelihood on posterior
proba-bility. The posterior probability provides stable hand-body association results, during transient periods of incorrectly lower likelihood. Figure similar to the published paper on this work [4]. . . 99
LIST OF FIGURES 19 3.9 Example results showing the accuracy of the proposed hand-body association
method in three different crowded scenes. Each scene has different lighting con-ditions, and features a range of people gesturing towards the robot. Tracked bodies are displayed in red. Tracked hands are displayed in blue. Associations are shown with a connected white line. . . 103
4.1 System structure diagram of the proposed sensor fusion algorithm. Rounded boxes represent functional components. Square boxes denote inputs and outputs. Boxes within the dashed line are components of the proposed tracker. Boxes outside represent the algorithm’s two inputs. . . 110 4.2 Images showing the results of an existing skin colour detection method [5] in
HRI scenes. The varying hand blob sizes and large number of false positives, due to clothing style and illumination conditions, motivates the decision not to perform explicit hand detection in the RGB image. . . 115 4.3 Illustration of the effect of the two likelihood functions, Pd and Pa. Areas of
high probability are coloured red. Pd weighs points along the edge of the hand
with a high probability; Pa weighs points along the hand direction with a high
probability. When combined with skin colour probability, the intersection of all three probability functions lies over the fingertips, which is the tracked point on the hand. . . 119 4.4 Images showing segmented hands from the geodesic distance analysis. The
seg-mentation boundaries are given by the black lines, surrounded by white for vis-ibility. The hue and saturation values of the segmented pixels will be used to update the appropriate tracker’s skin colour histogram. This provides the pro-posed algorithm with illumination invariance and the ability to model various colours of skin. . . 120 4.5 Illustration of the asynchronous measurement problem. Images are generated
at intervals of ∆t, depth updates take ∆d to process and RGB updates take
∆RGB. Performing a standard depth update at t1 + ∆d will cause RGB update
information from images att2andt3 to be lost, as ∆RGB <∆tand ∆d>∆t+∆RGB.122
4.6 Two graphs, each comparing thex-component of a tracked hand’s velocity, where a user waves towards an orthogonal camera. Each graph uses the same experi-mental setup, only with a different recording of the wave. The peaks and troughs of both waves are more accurately represented by the sensor fusion algorithm than the Kalman filter, due to the computationally efficient RGB update step. . 125
4.7 Example results showing the hand tracking performance of the sensor-fusion algorithm in a range of crowded environments. Tracked hands are displayed with a white and blue circle. Tracking is shown to work well despite different subject of different skin colour (a), clothing styles (b)(c), and illumination conditions (d). Figure similar to the published paper on this work [6]. . . 128
4.8 Hand tracking results of the sensor-fusion algorithm in three crowded environ-ments. Tracked hands are centred around three circles of expanding size, coloured red, green and blue. Each circle corresponds to a standard deviation of the hand state’sxcomponent. Monte-Carlo samples, used to update the hand position in the “RGB update step”, will lie within these boundaries. . . 129
5.1 Images, from the robot’s view, of real-world scenarios, in which a gaze estimate solution must function accurately to be of use for HRI. . . 134
5.2 Annotated picture of the hardware setup mounted on the mobile robot that is used for all experiments. The robot can use the proposed gaze detection method to know whether the subjects wish to engage in HRI. The system uses on and off-axis IR LEDs to illuminate and darken the pupil respectively. Resulting information from both an IR and a depth camera are fused to give an accurate gaze estimate. An IR-passing filter is used to reduce the effect of visible light, and a plastic separator is used to reduce the effects of glare. . . 135
5.3 System structure diagram of the eye detection phase. The lighting of the on and off-axis LEDs is inverted in alternate frames. A subject’s pupil can then be segmented using image subtraction on a consecutive pair of images. Connected component labelling should be performed on the resulting thresholded image to find candidate pixel blobs. Finally, anatomic filtering is used to remove false positives. The on and off-axis face images shown were taken at a distance of 1.5 m with the user looking directly at the robot. . . 137
5.4 Two methods of estimating gaze direction, α, shown by the arrow, using informa-tion from a registered depth image. The gaze angle calculated from Figure (a) is termed thevector gaze angle, and that calculated from Figure (b) is termed the
nose gaze angle. Right and left eyes are displayed as black circles and denoted by (xr, zr) and (xl, zl) respectively. . . 138
LIST OF FIGURES 21 5.5 IR images showing the points comprising the planar region of a subject’s
fore-head, when standing at 3 different angles to the camera. These points are coloured white and lie within the green box. As the white points are 2D pixels corresponding to the 3D forehead points, there is a perspective error for the more distant points at ±30°. This, along with sensor noise, accounts for the slightly differing bounding box size at 0°. The darker white points on the face are IR points from the depth camera. As they are low intensity and are mostly static, they have no effect on the thresholded difference image, described in Section 5.2.2.140
5.6 Illustration of how to derive gaze angle by fusing information from both the depth image and an IR pinhole camera. Right and left eyes, (xr, zr) and (xl, zl),
are displayed as black circles with their midpoint, (xm, zm), shown as a white
diamond. Interpupillary distance is denoted asL, camera focal length as f, and −ir and −il denote the x-coordinates of the right and left eyes relative to the
centre of the image plane. The sensor fusion algorithm aims to robustly calculate gaze angle, α, shown by the arrow between the eyes. . . 142
5.7 Six graphs off(α), with roots marked in red, and the corresponding RGB image of the subject that generated the graph. (a) to (c) show graphs for three different gaze angles with a subject positioned in the centre of the camera. (d) to (f) show graphs for the same angles, but with a subject standing at various locations in the image. For a gaze angle of exactly 0°,f(α) should have only one root, at 0°. For gaze angles of ±30°, f(α) should have two roots. At 30°, the positive-most root of f(α) is a stable value of 30°. At −30°, the negative-most root is a stable value of−30°. The other root in both cases is unstable. . . 144
5.8 Diagrams of the 3 different scenarios used to evaluate gaze estimation accuracy. “r” denotes the robot position, and “s” denotes the subject position. As ex-plained in the text,α= (−40°,−30°, . . . ,30°,40°),d= (1.5 m,2.0 m,2.5 m). (a) evaluates how gaze accuracy is affected by distance and angle to a static subject. (b) tests how accuracy depends on a subject moving throughout the camera’s 35°field of view. This scenario is performed with both one and two simultaneous people. (c) evaluates how accuracy is affected by a robot moving towards and away from a subject, using the same gaze angles in (a). . . 148
5.9 A bar chart of the gaze angle generated by each of the 3 depth methods consid-ered, vector, nose and forehead, for the static scenario distances of 1.5 m, (a), 2.0 m, (b), and 2.5 m, (c). The bar value equates to the mean gaze angle for the particular method and distance-angle combination. The first standard deviation is displayed with an error bar. Especially with greater distances, the forehead
method has a generally more accurate mean, and a much smaller standard de-viation than the other two methods. . . 149
5.10 A bar chart of the gaze angle generated by each of the 3 depth methods consid-ered, for the single moving person scenario (a), and the moving robot scenario (b). Similar to the static scenario results (Figure 5.9), the mean of theforehead
method is generally more accurate than the other two methods. The standard deviation of the forehead method, especially in the moving robot experiments, is also much smaller. . . 150
5.11 Box plots comparing gaze angles generated for the static scenarios using both the proposed sensor fusion algorithm and the forehead method. For each discrete ground truth angle, the forehead results are shown to the left and the sensor fusion results are shown to the right. Boxes extend from the upper and lower quartiles of the data, with the median shown as a line in the box. Whiskers extend to the most extreme data point within 1.5 times the interquartile range. Results for distances of 1.5 m, (a), 2.0 m, (b), and 2.5 m, (c), are shown. At virtually every distance-angle combination thesensor fusion algorithm has both a closer median and a smaller interquartile range than the forehead method. . . 152
5.12 Box plots comparing the sensor fusion gaze angle to that generated from the
forehead method, for the single moving person scenario (a) and the moving robot scenario (b). Under depth camera noise from a moving person (a), both methods exhibit more noise than the results for the static scenario. However, the median of the sensor fusion method is closer to the ground truth for most gaze angles, being at most around 8° away. With sensor noise from a moving robot (b), the small interquartile range of thesensor fusionmethod should be noted, along with its consistently more accurate median value than theforehead method. The only exception to this is at−10°, which can be explained by the sign of the forehead
method alternating between positive and negative values. This will cause the wrong root of the sensor fusion method to be chosen, resulting in a gaze angle of approximately 15° for the given experiment. . . 153
LIST OF FIGURES 23 5.13 A graph of estimated angle against time for the moving robot scenario at −10°
(a) and−40°(b). The sensor fusion algorithm’s anomalous results at −10° can be explained by the fluctuating sign of the forehead method. As its sign is used by the sensor fusion algorithm, if it is continuously wrong for longer than the low-pass filter window, then thesensor fusion result will also be wrong. This is the only experiment of all 46 to exhibit this problem, and it can be contrasted with the algorithm’s accuracy and stability at−40°. . . 154
5.14 Box plots comparing gaze angles generated by the proposedsensor fusion method and a state-of-the-art RGB gaze detection method [7] for the static scenario. At every ground truth angle, the results from the comparison method are plotted in blue to the left, whilst the sensor fusion results are plotted in red to the right. For every distance-angle combination, the sensor fusion method has a more accurate median value and a smaller interquartile range. . . 155
5.15 Box plot of the sensor fusion gaze angle for two simultaneously moving people. The corresponding results are displayed at either side of each ground truth angle. Due to the fast velocity of the subjects in these experiments, some inaccuracies arise as a result of the greater depth camera noise than in previous experiments. However, the results are still more accurate than the comparison RGB method in the more noiseless static scenario (Figure 5.14). Additionally, the distance of 2.5 m at which the more inaccurate values occur, exceeds the range of other IR gaze estimation methods. . . 156
5.16 Images, from the robot’s view, of the sensor fusion algorithm’s performance in typical HRI scenes. Gaze estimates are displayed with a red arrow, that has been projected into an RGB image for visualisation purposes. By estimating the gaze of everyone in the scene, the subject gesturing towards the robot can be correctly identified as wanting to initiate HRI. . . 157
5.17 Images from the robot’s view, showing the estimated sensor fusion gaze angles in real-world scenarios, including those originally shown in Figure 5.1. Gaze estimates are displayed with a red arrow on a white background, that has been projected into an RGB image for visualisation purposes. For people looking into the camera, this arrow will naturally appear quite short. . . 158
6.1 (a) and (b) show images of circular F-formations that static groups of people nat-urally adopt when interacting, and especially when conversing. Images of static pairs in (c), show a different arrangement called the vis-a-vis F-formation. As shown in images from (d), dynamic pairs of people also form a different structure, termed the side-by-side arrangement. As dynamic group size increases, (e), the side-by-side arrangement sometimes separates, but generally the participants’ gaze still maintains a common focus. . . 162
6.2 Image of robot equipped with an infrared gaze detector and a depth camera for people detection. The proposed group detector can reduce disruption by enabling the robot to either move around, not through, the group or wait until the conversation has finished before interacting with a participant. . . 164
6.3 A flowchart of the proposed group detection algorithm. . . 165
6.4 Illustration of the gaze features,θsandθd, for generating thepairwise interaction
probability. In each illustration, gaze features are calculated for the person given by the green circle, with the other pair participant represented by the red circle. The unmarked arrow extending from the green person denotes their gaze direction.167
6.5 Image of a pair moving towards the camera. Each participant’s gaze is approxi-mately half way between the direction of motion, and the other person. This is due to the need to look where they are going, whilst maintaining interaction. . . 168
6.6 A graph of how the model-based,pairwisedistance likelihood varies with distance between two people. Likelihood is maximal at personal distances, and decreases exponentially as the candidates move further apart. This graph was generated using the optimal model-based parameters, as defined in Section 6.3.2. Thus,
ud= 0.296 and σd= 0.397. . . 169
6.7 A polar plot of how the model-based, pairwise gaze likelihood, varies with a pair candidate’s gaze angle. Gaze difference,θ, is the angular difference between the person’s detected and expected gaze directions, as defined in Figure 6.4. A difference of 0° thus gives a maximal likelihood. As the person’s gaze deviates from its expected direction, likelihood decreases appropriately. This graph was generated using the optimal model-based parameters, as defined in Section 6.3.2. Thus,τ = 8.7. . . 170
LIST OF FIGURES 25 6.8 A plot of how the model-based, pairwise velocity likelihood for two candidates
varies with their speed. Plotted values assume that they are both facing in the same direction. Velocity likelihood is maximal when their speeds are similar, and above a threshold. The more the candidates’ speed differs, the more the interaction likelihood decreases. This graph was generated using the optimal model-based parameters, as defined in Section 6.3.2. Thus, σv = 0.267 and
uv = 0.549. . . 171
6.9 Illustration of the gaze features, θs and θd, for generating person-to-group
in-teraction probability. In both illustrations, gaze features are calculated for the unassigned person given by the green circle. Members of the existing group are denoted by red circles. The unmarked arrow extending from the unassigned green person denotes their gaze direction. . . 175
6.10 Images of static and dynamic groups used as positive samples for the group detection methods. . . 178
6.11 Images of static and dynamic ungrouped persons used as negative samples for the group detection methods. Note that in order to evaluate the person to group merging stage, some images show scenes where a group is present, as well as an ungrouped person. . . 179
6.12 Normalised histograms for distance feature values, k∆xk, between two people, both for when they are interacting as a pair, shown in blue, and when they are not, shown in red. As can be seen, the distance feature alone does not provide enough information to separate the two classes. . . 180
6.13 Normalised histograms of the static gaze feature, cos (θs), for when the gaze
detector captures a person’s gaze, (a), and when it fails to detect a person’s gaze, (b). When the gaze detector fails, a person is assumed to be looking directly away from the camera. Good class separation is achieved when a person’s gaze is detected. . . 181
6.14 Normalised histograms of the dynamic gaze feature, cos θd, for when the gaze
detector successfully detects a person’s gaze, (a), and when it fails, (b). Like the static gaze feature, good class separation can be achieved with cos θd values
6.15 Normalised 2D histograms for the two velocity features, µv and ∆v. Features
from pairs of people are shown in (a). Features from unpaired people are shown in (b). The large number of samples at the origin of both graphs represents static subjects. Outside this area, the two histograms are visually separable. This suggests that, for moving subjects, accurate classification of interactions can be made using both features. . . 183 6.16 Figure showing ROC curves for both the logistic classifier and the model-based
method. (a) shows pairwise group detection results. (b) shows results for the person to group merging stage. The logistic classifier has superior performance for both detection stages, especially pairwise group detection. . . 185 6.17 ROC curves that present logistic classification results with, and without,
infor-mation from the gaze detector. (a) shows pairwise group detection results. (b) shows person to group merging results. In both cases, the inclusion of gaze information greatly increases the group detection results. . . 186 6.18 Images of group detection results, using logistic classification, on a recording of
students exiting a crowded lecture theatre. Each subfigure has an RGB image and a rotated point cloud from the same time instance. A white ellipse is overlaid on the detected groups, so that the the outermost participants lie on its edges. Note that in (d) and (e), the use of the gaze detection method from Chapter 5 means that the subjects looking down are correctly separated from the nearby groups. When one of the subjects then looks at the people in front of him, shown in (f), he is then included in the group. . . 189
6.19 Images from publicly available group detection datasets, used to compare the logistic group classifier against the state-of-the-art. The “CoffeeBreak” scenario, (a), was published in [8], and the “CocktailParty” scenario, (b), was published in [9]. All images kindly supplied by the authors. . . 190
A.1 Illustration of a SVM classifier, in 2D space, trained on two classes, shown by black and white data points. In the presented hand detection application, hands are represented by white circles, and non-hands are represented by black circles. The decision boundary is a solid line, mid-way between two margin hyperplanes, shown by dashed lines. The dashed margin hyperplanes intersect the nearest data points from each class, termed “support vectors”, such that the distance between them is maximised. . . 218
B.1 Screenshot of a two tools used in this thesis, that were written in Python using the ROS libraries. (a) shows a ground truth annotation tool, used for manually tagging people, hands and gestures. (b) shows a teleoperation tool, that allows a user to remotely control the robot using a web interface. A live map, showing robot and detected people positions, along with a video feed from the robot are displayed in real-time on the client’s screen. The robot’s movement can be controlled with on-screen controls, keyboard commands or a joystick. . . 223 B.2 Implementation code of sample player driver. . . 223 B.3 Illustration graph of the ROS communication infrastructure for the hand and
body association method described in Chapter 3. . . 225 C.1 Circuit diagram of the hardware used to alternate power to the on and off-axis
LEDs. Screw terminal J1 is connected to the on-axis LEDs and screw terminal J3 is connected to the off-axis LEDs. Screw terminal J2 is connected to a square wave oscillator with frequency equal to half the camera’s frame rate. As shown, the two pins propagate waves that have a 50% duty cycle and are separated by phase shifts of 180°. In this way only one set of LEDs is observable in each frame, and in the subsequent frame only the opposite set of LEDs is observable. The 633 nm wavelength LEDs provide a visual means of detecting if power is supplied to their connected set of IR LEDs. . . 227
List of Tables
2.1 Select summary of previous people detection methods. . . 46 2.2 Select summary of previous hand detection methods. . . 54 2.3 Select summary of previous hand tracking methods. . . 54 2.4 Select summary of previous full body pose estimation methods. . . 60 2.5 Select summary of previous hand pose estimation methods. . . 62 2.6 Select summary of previous gesture recognition methods. . . 65 2.7 Brief description of some previous gaze estimation methods. . . 71 2.8 Advantages and disadvantages of previous gaze estimation methods. Calibration
refers to instance or user-specific calibration, and not to one-time calibration, such as generating internal camera parameters. . . 72
3.1 Confusion matrix of the optimal SVM classifier for the proposed descriptor. Rows represent the ground truth class. Columns represent the predicted class. . . 97 3.2 Table showing the improved performance of an SVM trained on the proposed
descriptor, compared to one trained on the shape context. . . 98 3.3 Table showing the performance of the proposed body detection algorithm, in a
single subject environment. Performance was compared with four alternative methods, at three different distances. Acc. is the percentage of accurately detected bodies. FP is the average number of false positives per-frame. FPSis the average number of frames-per-second that each method can process. . . 100
3.4 Table showing hand detection performance of the proposed algorithm, compared to two alternatives, in a single subject environment. Scenarios are divided into three distance and three gesture motion range categories, each using a wide range of gesture angles. Each method is evaluated on all nine scenarios. Results are shown of both the percentage of accurately detected hands, and the average number of false positives. The best result for each scenario is shown in bold. . . 101
3.5 Table showing hand-body association results for the three crowded scenarios. . . 104
4.1 Table showing the percentage of correctly tracked hands, for the sensor-fusion algorithm (S) and Kalman filter (K), in nine controlled scenarios. Scenarios are divided into three distance and three gesture motion range categories, each using a wide range of gesture angles. Results are shown for three different depth-based hand detectors, with the best results for each scenario shown in bold. The average percentage increase of correctly tracked hands, when using the sensor-fusion algorithm, is shown in the bottom row. . . 127
4.2 Table showing the percentage of correctly tracked hands, for the sensor fusion algorithm (S) and the Kalman filter (K) in three crowded environments. The average percentage increase, when using the sensor-fusion algorithm, is shown in the bottom row. Each scenario has gesturing subjects with varying skin colour, different styles of clothing, and varying illumination conditions. . . 129
6.1 Categories of groups recorded for use as positive samples when evaluating group detection methods. . . 178
6.2 Categories of ungrouped persons recorded for use as negative samples when eval-uating group detection methods. The categories were selected to test both the pairwise group detection and person to group merging stages. . . 179
6.3 Group detection accuracy for the logistic classifier, with and without gaze infor-mation, and the model-based method. As shown, for both the pairwise group detection, and the people to group merging classifiers, the threshold of each al-gorithm was set to produce a false positive rate of 0.1. The best results are emboldened, and are produced by the logistic classifier using gaze information. . 187
6.4 A breakdown of the group detection accuracy for the categories of groups recorded as positive samples. Results are displayed for the logistic classifier, with and without gaze information, and the model-based method. The threshold of each algorithm was set to produce a false positive rate of 0.1. The best results are emboldened, and are mainly produced by the logistic classifier using gaze infor-mation. . . 188 6.5 Table comparing the precision and recall of the proposed method to four
state-of-the-art techniques, using four publicly available datasets. The largest values in each category are emboldened. The logistic group detector gives accurate results for all but one of the datasets. . . 191
List of Algorithms
1 Pseudocode of a modified version of Dijkstra’s algorithm, where depth image pixels are dynamically added as nodes to visit,Q, if their Euclidean distance to an existing node is less thanmind and their geodesic distance from the keypoint
is less than maxd. . . 85
2 Overall group detection algorithm,detectGroups, which uses a recursive
pro-cess to merge unassigned people into existing groups. getPairwiseGroups is
the function described by Section 6.2.2 and mergePeopleIntoGroupsis the
function described by Section 6.2.3. . . 177
Chapter 1
Introduction
1.1
Background
In the modern world, robots are used in a wide range of environments for a diverse number of applications. Currently, the most successful robotic applications are in industrial plants, laboratories and other highly structured environments. Autonomous mobile robots have not yet reached a level of maturity, where they can operate effectively in unconstrained, real-world environments. Many complications exist in developing mobile robots with autonomous opera-tion in such settings; Human-robot interacopera-tion (HRI), robot navigaopera-tion, and robot-environment interaction are all complex research topics with many unsolved difficulties. However, as mobile robot complexity increases, so does the range of applications that they can perform.
Human-robot interaction can be defined as the study of natural and effective communication between robots and humans. Through HRI techniques, a robot can understand the inten-tion of humans in an environment and react accordingly. There are many research areas that compose this multidisciplinary field: people detection, body part localisation, face recognition, facial expression recognition, socially aware navigation, gesture recognition, audio recognition, human-activity detection, human attention detection and group detection, to name but a few. Many of these problem areas have been researched in the context of general computer vision. However, HRI requirements of a moving camera, potentially distant subjects, and
tionally efficient algorithms, necessitate specific solutions that are discussed in this thesis. For seamless interaction between autonomous mobile robots and humans, many problems need to be solved. Most notably, for the introduction of robots in real-world environments, compu-tationally efficient sensing techniques must be developed so that HRI is unimpeded by crowds and dynamic environments. Crowded environments are challenging for many HRI solutions. To simplify the problem, many current techniques make assumptions, such as the number or placement of people within a scene, unoccluded poses, static cameras or requirements of worn devices for gaze estimation and audio recognition. Practical HRI systems do not have this luxury, as real-world demands are entirely variable in nature.
One of the major challenges that the modern world faces is in healthcare. Whilst the quality of healthcare solutions obviously improves over time, the continuing problem of global ageing populations [10] with improved survival rates due to medical advances, will place increasing strain on healthcare providers. This demographic shift will not only place greater demands on a smaller number of eligible healthcare providers, but will actually change the nature of the care that is provided to patients. Most notably, elderly patients and those with chronic diseases will require increasing support from assistive technology and patient monitoring. With the ever increasing demand on improving quality of life, new innovations in technology are required to help future populations receive adequate care.
The introduction of autonomous mobile robots into the healthcare environment could provide a way of alleviating future problems in global health [11]. Capable of performing simple, tedious tasks on a continuous basis, these robots could serve as a valuable tool in freeing up the working time of nurses. Alternatively, robots could provide a convenient way of providing patient monitoring and assistance in houses or nursing homes. The development of HRI solutions, capable of operating in crowded and dynamic environments, is necessary for autonomous mobile robots to operate in these healthcare environments.
To this end, the aim of this thesis is to provide mobile robots with sensing methods, which are capable of operating in crowded and dynamic environments, in order to facilitate HRI. Specifically, the problems of detection and tracking of people and their associated hands, human
1.2. Thesis Structure 37 attention detection through gaze estimation, and group identification are addressed in the following work. To achieve the required robustness, accuracy and computational efficiency, information from multiple input sensors is used. Amongst them, depth cameras are employed, which produce images whose pixel values are not colour, but the distance to the closest object in the relevant direction. RGB-D cameras are those that produce both colour and depth images from the same device. Furthermore, when the Microsoft Kinect is referenced in this thesis, only the physical depth camera is being specified and not any gesture or pose recognition software that is supplied with the camera.
Most traditional HRI systems rely on information from colour cameras. Robot perception in colour images is complicated by issues such as lighting variances, depth ambiguity and differing skin colours. As such, many previous methods simplify the problem, with techniques such as background modelling, specific user initialisation poses or assumptions of unoccluded upright poses. This limits the potential adoption of such methods in an effective HRI framework, particularly one for use in crowded healthcare environments, elderly care, for wheelchair users or those requiring walking aids. However, through a combination of modern sensors, including RGB-D and infrared (IR) cameras, this thesis proposes techniques that are not subject to such constraints.
1.2
Thesis Structure
Chapter 2 reviews the current state-of-the-art in HRI techniques. Particular focus is given to HRI problems that overlap with the methods proposed in this thesis. A history of the significant developments in mobile robotics is first presented. Due to their importance to almost every HRI system, people and group detection methods are then reviewed, followed by the related problem of localising individual body parts. Hand detection is usually a prerequisite for classifying gestures, so recent gesture recognition systems are also presented. Finally, methods for human attention detection and gaze estimation are surveyed.
environments. A hand detection method is initially presented that uses a novel histogram descriptor, with geodesic distances from depth images used to filter background noise in crowded environments. A computationally efficient body detection method is then described, which also employs geodesic distances. Finally, a Bayesian algorithm for associating hands and bodies is presented, for when multiple people and hands are detected in a crowded environment. The method is evaluated in nine controlled environments, and three crowded environments, with results compared to two competing techniques.
Chapter 4 presents an RGB-D sensor-fusion algorithm for tracking hands in crowded and dy-namic environments. Firstly the tracked hand state is formulated, together with the process of incorporating depth-image based hand detections and Monte-Carlo updates from colour im-ages. Colour updates use dynamically learned, per-subject skin colour information. A method is then described to combine asynchronous depth and colour updates that have different com-putational speeds. Hand tracking accuracy is evaluated using nine controlled environments, and three crowded environments. Results are compared against the Kalman filter, when using three different depth-image based hand detectors.
Chapter 5 proposes a sensor-fusion gaze estimation system that uses IR and depth cameras on a mobile robot. The hardware setup is firstly described, including the IR LEDs and camera employed. Using this setup, an IR pupil detection method is presented. Resulting eye positions are used to generate a noisy gaze estimate using depth image information. Finally, a more accurate gaze estimation method is described that uses both IR and depth information. This is confirmed through experiments using a moving robot and multiple moving people, with results compared to the current state-of-the-art.
Chapter 6 presents a group detection algorithm that incorporates real-time gaze estimates to enhance the detection accuracy of static and dynamic interactions. A pairwise group detection process is first defined, with a subsequent recursive algorithm used to fully specify group mem-bership. A novel set of features is extracted, based on sociological concepts of group structure. Group detection accuracy is evaluated using two approaches: a custom model-based method and a logistic regression classifier.
1.3. Thesis Contributions 39 Chapter 7 concludes the work in this thesis, summarising the technical contributions and dis-cussing its limitations. Potential future work is reviewed, with possible applications of the presented methods considered.
1.3
Thesis Contributions
The main technical contributions of this thesis can be summarised into the following aspects:
1. A hand and body association algorithm designed for crowded and dynamic environments.
The proposed method combines a hand detector, robust to noise in crowded environments, with a computationally efficient body detector; a subsequent Bayesian hand and body association algorithm is presented for when multiple people and hands are detected in a crowded environment.
2. An RGB-D sensor-fusion algorithm for tracking hands in crowded and dy-namic environments.
The proposed method increases position and velocity accuracy by combining a depth-image based hand detector with Monte-Carlo updates using colour depth-images.
3. A sensor-fusion gaze estimation system, combining IR and depth cameras on a mobile robot to give better accuracy than traditional visual methods, without the constraints of traditional IR techniques.
The proposed calibration-free method uses IR eye detection with depth image analysis, to produce accurate gaze estimates of multiple dynamic people on a moving robot, at a longer range than traditional IR techniques.
4. A group detection algorithm that uses gaze estimates to enhance the detection accuracy of static and dynamic interactions.
A novel set of features, based on sociological concepts of group structure, is used to classify groups based on tracked subjects’ position, velocity and gaze estimates.
1.4
Publications
This thesis includes material from the following peer-reviewed publications:
1. S. McKeague, J. Liu, A. Vicente, and G.-Z. Yang, “Human gaze estimation using a sensor-fusion based long range infrared eye detector on a mobile robot,” inSubmission, Feb. 2015
2. S. McKeague, J. Liu, and G.-Z. Yang, “Hand and body association in crowded environ-ments for human-robot interaction,” in Robotics and Automation (ICRA), IEEE Inter-national Conference on, May 2013, pp. 2161–2168
3. S. McKeague, J. Liu, and G.-Z. Yang, “An asynchronous rgb-d sensor fusion framework using monte-carlo methods for hand tracking on a mobile robot in crowded environments,” inSocial Robotics, ser. Lecture Notes in Computer Science. Springer International Pub-lishing, 2013, vol. 8239, pp. 491–500
4. J. Correa, S. McKeague, J. Liu, and G.-Z. Yang, “A study of socially acceptable movement for assistive robots concerning personal and group workspaces,” in Proccedings of the 7th Hamlyn Symposium on Medical Robotics, 2014
5. C. Wong, S. McKeague, J. Correa, J. Liu, and G.-Z. Yang, “Enhanced classification of abnormal gait using bsn and depth,” inWearable and Implantable Body Sensor Networks (BSN), International Conference on, May 2012
6. C. Wong, Z. Zhang, S. McKeague, and G.-Z. Yang, “Multi-person vision-based head detector for markerless human motion capture,” inWearable and Implantable Body Sensor Networks (BSN), International Conference on, May 2013
7. J. Liu, J. Correa, S. McKeague, E. Johns, C. Wong, A. Vicente, and G.-Z. Yang, “A healthcare mobile robot with natural human robot interaction,” inProccedings of the 5th Hamlyn Symposium on Medical Robotics, 2012
Chapter 2
Human-Robot Interaction - A
Literature Review
2.1
Introduction
In 1920, science fiction author Karel Capek wrote a play, entitled R. U. R, which popularised the word “robot”. The term is derived from “Robota”, meaning forced labour in the author’s native Czech. The first electronic autonomous robots were created in Bristol between 1948 and 1949, and were called “Machina Speculatrix” by their inventor, W. G. Walter. These robots, shown in Figure 2.1a, were designed to move towards light sources, using analogue electronics and light sensors.
Between 1966 and 1972, research was conducted in Stanford University on the first digital robot that incorporated planning algorithms. Named “Shakey the robot”, and shown in Figure 2.1b, it was equipped with a camera, range finder and bump sensors. The robot was able to solve tasks requiring navigation, such as, “push the block off the platform”. In accomplishing this, the project introduced multiple techniques, such as the A∗ search algorithm, which are still
used to this day. In the wake of these early successes, public interest in robotics grew rapidly. One of the first commercially available mobile robots was called “HERO 1”, shown in
(a) 1948 (c) 1982 (e) 2000 (g) 2008 (i) 2011
(b) 1966 (d) 1993 (f) 2004 (h) 2010 (j) 2012
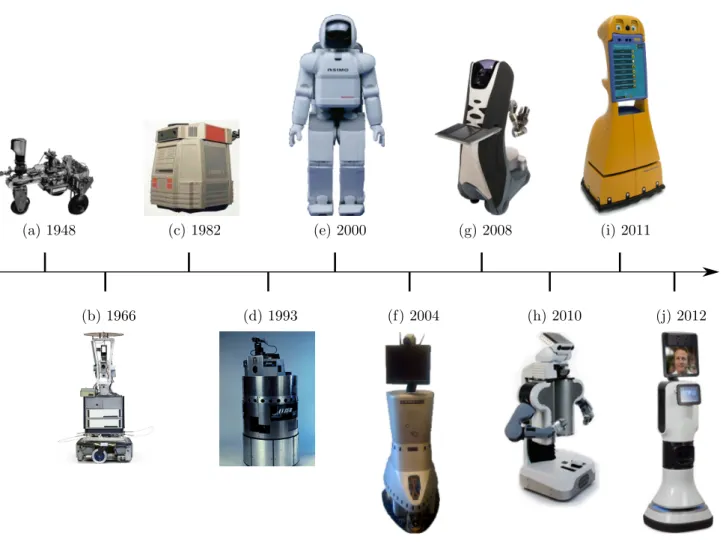
Figure 2.1: Timeline of major developments in the history of mobile robots. Details of the robots and their images sources are as follows: (a) is a “Machina Speculatrix” robot, designed by W. G. Walter in Bristola. (b) is “Shakey the Robot”, developed at Stanford Universityb.
(c) is “HERO 1”, a robot sold by Heathkitc. (d) is the “Xavier” robot, developed at Carnegie
Mellon University [17]. (e) is the famous Honda “ASIMO” robotd. (f) is the “RP-7”, made
by InTouch Health [11]. (g) is the “Care-O-Bot 3” built by Fraunhofer IPAe. (h) is the “PR2”
robot from Willow Garagef. (i) is the “Scitor G3” robot, manufactured by Metralabs [18]. (j)
is the “RP-Vita”, the updated model of the “RP-7” from InTouch healthg.
a http://www.extremenxt.com/walter.htm- Accessed 21/09/2014 b http://www.computerhistory.org/revolution/artificial-intelligence-robotics/13/289/1229? position=0- Accessed 21/09/2014 chttp://commons.wikimedia.org/wiki/File:Hero1.jpg- Accessed 21/09/2014 d http://world.honda.com/news/2000/c001120_5.html- Accessed 28/09/2014 ehttp://wiki.ros.org/Robots/Care-O-bot?action=AttachFile&do=view&target=Care-o-bot_3.jpg -Accessed 28/09/2014 fhttp://wiki.ros.org/Robots/PR2?action=AttachFile&do=view&target=pr2Image.png - Accessed 21/09/2014 ghttp://www.intouchhealth.com/products-and-services/products/rp-vita-robot/ - Accessed 28/09/2014
2.1. Introduction 43 ure 2.1c, and sold by Heathkit in 1982. Designed for education purposes, the robot featured light, sonar, motion and sound sensors. Computation was performed using the Motorola 6808 processor, 4 kB of RAM and compact cassettes for data storage. The rapid increase in compu-tation power through the 1980s and 1990s naturally led to increases in robot complexity. In 1993, the “Xavier” robot was developed at Carnegie Mellon University. Shown in Figure 2.1d, it was the first mobile robot that could be teleoperated via the Web, and contained twin cameras for stereo vision, a range and sonar sensor, and bump sensors. With further developments in mobile robotic capabilities, the possible applications of teleoperation grew. Around 2004, InTouch Health released the “RP-7” remote presence robot, shown in Figure 2.1f. The robot was designed to allow clinicians to remotely see and interact with patients. To do this, the robot features two cameras, a microphone and infrared collision avoidance sensors. A video input jack on the back of the robot allows for the connection of an endoscopic or fluoroscopy camera. This allows a remote physician to directly view the same images as the medical team performing the examination. In 2012, InTouch Health released an updated model to the “RP-7”, called the “RP-Vita”, shown in Figure 2.1j.
In 2000, Honda released the famous “ASIMO” humanoid robot, which stands for “Advanced Step in Innovative Mobility”. “ASIMO”, shown in Figure 2.1e, is designed to be a multi-functional robot assistant, especially for those suffering from reduced mobility. Initially capable of walking at 1.6 kilometres per hour (km/h), newer models have demonstrated speeds of 2.7 km/h.
The “Care-O-Bot 3” is shown in Figure 2.1g and was released by Fraunhofer IPA in 2008. The robot is primarily designed to assist people in their homes. Targeted at supporting the independence of elderly and handicapped people, the “Care-O-Bot” operates autonomously, unlike robots such as the “RP-7”. It can perform fetch and carry tasks using its built-in tray, and can play music and games using its interactive touch screen. To facilitate this, the robot is equipped with stereo cameras, time of flight cameras and two laser range finders.
In 2010 the successful “PR2” robot, shown in Figure 2.1h was released by Willow Garage. The “PR2” serves as the company’s exemplar robot platform for their open source Robot
Operating System (ROS). More information on ROS is given in Appendix B, as it is the main software platform used in this thesis. The “PR2” has a large number of actuators and sensors, including multiple stereo cameras, multiple colour cameras, an inertial measurement unit, two accelerometers, two laser range finders, and two hand gripper pressure sensors.
With the continuing problem of global ageing populations [10], elderly care will be an increas-ingly important motivation for mobile robotic research. The holistic systems required for this application are, however, are still in their infancy. In one of the first long-term user studies of its kind, Schroeter et al. [18], under the “CompanionAble” project, combined the 2011 “Scitor G3” robot from Metralabs, shown in Figure 2.1i, and a smart environment to support elderly dementia patients. The system was evaluated in six user experience trials, where a patient and an informal care giver lived normally for two days in a test home with the system. The robot provided services such as appointment reminders, storing offered items and notification of missed calls. Questionnaires and interviews were used to evaluate user experience, acceptance and societal impact results. Whilst nearly all participants valued the robot for its embodied interaction possibilities, it was noted that neither speech recognition, nor people detection were robust enough.
The research in this thesis aims to extend the state-of-the-art HRI components of such holistic systems. The following section reviews existing literature in a variety of HRI topics, which strongly overlap with the subject matter of the methods proposed in this thesis. Techniques by which people and groups can be detected are described in Section 2.2. Methods for localising body parts, such as hands, are reviewed in Section 2.3. Gesture recognition techniques, for commanding and controlling robots, are discussed in Section 2.4. Finally, gaze estimation methods for human attention detection are described in Section 2.5.
2.2
People and Group Detection
Arguably the single most important precursor to human-robot interaction is the problem of detecting people, as shown in Figure 2.2. Solutions to this problem have applications in many
2.2. People and Group Detection 45
(a) People Detection (b) Group Detection
Figure 2.2: For any HRI task, one of the most common problems to be solved is that of detecting people, as shown by the hand-drawn red circles in (a). A related problem is that of segmenting detected people into interacting groups, as shown by the hand-drawn black circle in (b). other areas of robotics, including navigation [19], human intention detection [20] and face recognition [21]. Advances in sensor quality, visual features and machine learning techniques have helped bring about mature solutions to this problem. Until the recent introduction of depth cameras, most approaches used a single monocular camera. The low cost of digital cameras, their ability to work in sunlight, and the intuitive appeal vision provides from a human perspective, have all helped to drive this research.
Human detection is a relatively difficult task from a computer vision perspective. The lack of explicit models in most methods leads to the use of machine learning techniques, where an implicit representation is learned from examples. Changing articulated pose, clothing, illumi-nation and background can all further complicate the problem. Most practical vision systems thus make good use of features rather than pixel values directly, as a way of encoding ad hoc domain knowledge that would otherwise be difficult to learn from the raw training data. Ta-ble 2.1 lists some of the most relevant methods to this thesis, with expanded explanations given below.
A recent survey into monocular people detection [22] concluded that from a number of state of the art systems, the two most promising approaches were those that used Haar-like features [23–25] and those that used Histograms of Orientated Gradients [26, 27]. Reviewed methods were evaluated based on their computational efficiency and detection accuracy when tested on
Table 2.1: Select summary of previous people detection methods.
Method Camera Feature Classifier
Haritaoglu et al. [28] Intensity Curvature of
silhouette vertices
Thresholding
Papageorgiou and Poggio [23] Colour Haar-Like SVM
Viola et al. [24] Intensity Temporal Haar-Like AdaBoost
Viola and Jones [25] Intensity Haar-Like AdaBoost
Porikli [29] Colour Histogram Nearest Neighbour
Dalal and Triggs [26] Colour HOG SVM
Zhu et al. [27] Colour HOG AdaBoost
Tuzel et al. [30] Colour Region Covariance Nearest Neighbour
Tuzel et al. [31] Colour Region Covariance LogitBoost
Chen et al. [32] Colour Shape, Colour &
Temporal Statistics
AdaBoost Mosberger and Andreasson [33] Infrared Local Descriptors Random Forest
Choi et al. [34] Depth HOD SVM
a large and varied test set of upright poses, more commonly known as a pedestrian data set.
Haar-like image features are so called because of their similarity to Haar wavelets. The value of a Haar-like feature is specified as the difference between the sum of the pixel values within two rectangular regions. These regions have the same size and shape, are horizontally or vertically adjacent, and are usually computed at a large number of locations and scales. Although very coarse, they are sensitive to the presence of edges, bars and other simple image structures. Within any image, the number of possible permutations of Haar-like features will be far larger than the number of pixels.
The first work to suggest the use of Haar-like features for object detection was by Papageorgiou and Poggio [23]. Contrary to later approaches [24, 25], the generation of Haar-like features was formulated as a two dimensional discrete wavelet transform at multiple scales. A descriptor vector was constructed from the several thousand resulting features for each sample. These vectors were then used to train a support vector machine (SVM) classifier. Object detection was performed by evaluating this SVM using a sliding window at multiple scales over a test image.
2.2. People and Group Detection 47
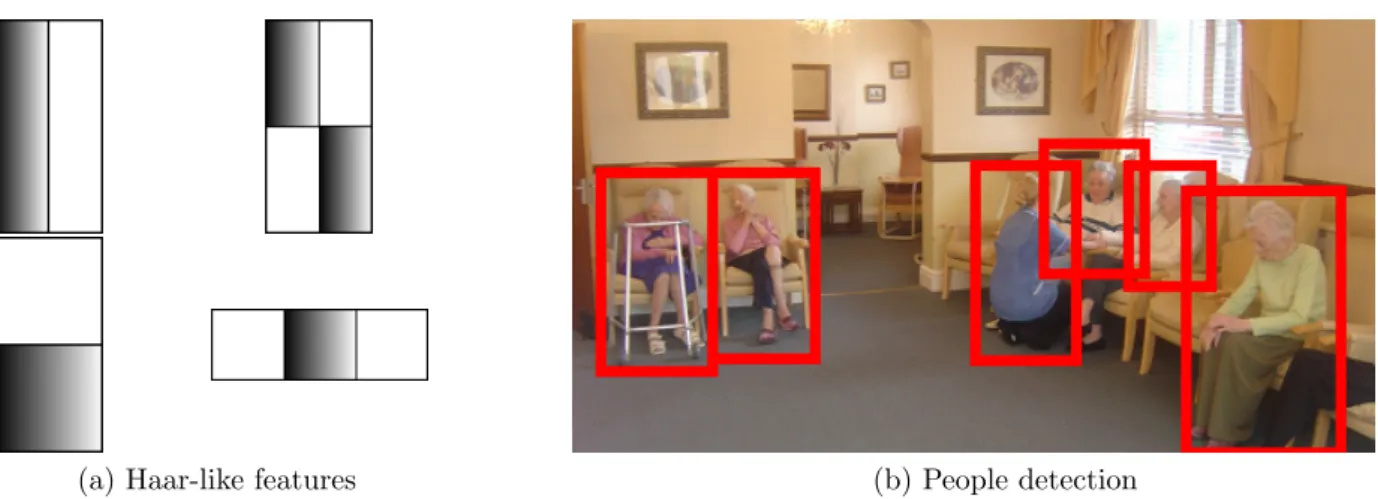
(a) Haar-like features (b) People detection
Figure 2.3: (a) shows illustrations of certain Haar-like features. The value of each feature is equal to the difference of the sum of the pixel values in the black and white regions. (b) shows hand-drawn, illustratory results of a people detector trained using these Haar-like features. Image sourced from 1.
The results highlighted the applicability of this feature in capturing image detail consisting of clear patterns, as shown by the good results for face detection.
To increase the accuracy of human detection in low resolution video, Viola et al. extended the concept of Haar-like features to capture local motion information [24]. Instead of calculating the difference between adjacent regions in the same image, motion information was captured by calculating the difference between the same region in consecutive frames of a video stream. In this way, the Haar-like feature are computed in time, rather than position. Information about the direction of motion was additionally extracted by shifting the previous frame of the video stream in both the horizontal and vertical directions, and re-computing the features. When training an AdaBoost classifier [35] on a pedestrian detection dataset, the use of temporal features provided a greatly reduced false positive rate compared to static Haar-like features. The AdaBoost algorithm combines a collection of weak classification functions to form a stronger classifier. A weak function is so called because it will not give good classification results by itself. With an input training set, the algorithm calls a simple learning algorithm repeatedly in a number of rounds. A set of weights are calculated over the training set, where
1http://www.thehavenresidentialhome.co.uk/images/caring-for-the-elderly.jpg - Accessed
at each round the weights of incorrectly classified examples are increased, so that the simple learning algorithm focuses more on the harder examples in the training set. Every round, the simple learning algorithm will return the weak classification function that minimises the weighted number of misclassified training examples. Good general features are selected in the initial rounds by the algorithm whilst the hardest to classify training cases are dealt with by the features in later rounds.
The use of Haar-like features was further developed in the seminal Viola-Jones face detection framework [25]. As detailed in a recent survey [36], this framework still provides impressive results for forward orientated face detection. Three main extensions to the original object detection algorithm [23] were employed. Firstly, during initial feature generation, integral images were employed to increase the computational efficiency of the process. Secondly, an AdaBoost classifier, rather than an SVM, was employed to classify resulting descriptor vectors. Finally, the AdaBoost classifier was constructed in a cascading approach, allowing a reduction in the classification processing afforded to samples that are decisively negative.
The integral image is a commonly employed technique to speed up calculations involving sum-mations. For any pixel in a greyscale image, i, its equivalent integral image, ii, value is the sum of the pixels above and to the left of it:
ii(x, y) = X
x0≤x,y0≤y
i(x0, y0) (2.1)
Using an integral image, any rectangular sum can be computed in four array references, as shown in Figure 2.4. Any of the Haar-like features in Figure 2.3a can thus be computed in at most 9 operations. It is the extreme computational efficiency of the Haar-like feature that makes it a suitable for people and face detection, as they produce a very discriminative image representation when calculated in large numbers. However, many different techniques have made use of the integral image and its variants [37].
One such variant was presented by Porikli [29], who applied the technique to reduce the com-putational complexity of histogram generation. Porikli applied these “integral histograms” to
2.2. People and Group Detection 49
A
P1 P2
P3 P4
Figure 2.4: Illustration of an integral image. The summation of all pixel values in rectangle A
is given by P4+P1−(P2 +P3).
the problem of pedestrian tracking. With a template histogram of the person to track as input, colour histograms were generated for every possible search space in the image. The author claims that this process is over a thousand times quicker than traditional histogram generation. Tracking was shown to be continuous with a fast moving subject. This was contrasted with the mean-shift algorithm [38], which lost tracking under such a condition.
Histograms of Oriented Gradients (HOG) [26] are a widely used feature for human detection. The descriptors bear much resemblance to those used in the Scale-Invariant Feature Transform [39], using locally normalised histograms of gradient orientations. This descriptor is based on the idea that local object appearance and shape can be characterised by the distribution of local intensity gradients, even without precise knowledge of the corresponding gradient. To generate the HOG descriptor, the image window to be characterised is divided into a number of small spatial regions called cells. For each cell, a histogram of gradient magnitudes and directions is accumulated over the pixels within it. Each cell is then grouped into larger spatial blocks, as shown in Figure 2.5a. A sum of the total histogram values is accumulated for each block and the result is used to normalise all the cells within each block. Presented results [26] emphasised the importance of strong local normalisation; multiple overlapping blocks should cover each cell in the entire image window
Zhu et al. [27] presented two modifications to the original HOG method. First, instead of using a SVM to classify descriptors, the authors used the AdaBoost algorithm, with the same
cascade-(a) HOG descriptor (b) People detection
Figure 2.5: (a) is an illustration of 4 overlapping HOG blocks. The smallest squares represent pixels. These are grouped into 9 cells in total, each containing a default of 8×8 pixels. One HOG block is of default size 2×2 cells, and either has a colour of red or yellow, or one of two patterns. (b) shows hand-drawn, illustratory results of a people detector trained using HOG features. Image sourced from 2.
of-rejectors approach proposed in [25]. At each AdaBoost training level, 250 random blocks were selected. For each block, a separate linear SVM was trained on all positive and negative samples. The weak classifier chosen at each level of the AdaBoost cascade corresponded to the SVM that minimised the weighted number of training examples. The authors additionally used the integral image technique to speed up calculation of the magnitude and orientation of the image pixels. Whilst these modifications resulted in a twenty times speed improvement, detection accuracy of the modified algorithm was slightly decreased.
A recent human detection method, shown to have superior results to the HOG approach, was presented by Tuzel et al. [30]. The authors suggested that regions of an image could be characterised by the covariance of a number of image statistics, such as intensity differentials. The integral image was used to reduce the time to calculate covariance matrices, so that it only depends on the square of the number of image statistics. Pedestrian detection was performed by again matching a template against a multi-scale sliding window over a test image; a detection was defined as the most similar search window to the template. In a later work [31], the authors extended this approach by incorporating covariance descriptors into a machine learning framework. A generalised version of the AdaBoost algorithm was employed for this task, with
2http://www.clsgroup.org.uk/?q=sites/default/files/styles/home_slide/adaptive-image/
2.2. People and Group Detection 51 equations reformulated to operate in non-Euclidean space. Presented human detection results were shown to be superior to the HOG approach.
People detection failure in industrial environments can be disastrous. In these settings, Mos-berger and Andreasson [33] used domain specific knowledge to increase detection robustness; knowing that all employees wear reflective safety vests, active IR illumination was used to ob-tain high intensity reflections. In alternating frames, IR illumination was disabled, giving a normal intensity image. Local STAR features were detected in the IR image and matched to the regular image. A random forest classifier was used to discard features not originating from the reflective vest, and a regressor was used to estimate the distance of reflective vest features from the camera.
As depth cameras become increasingly prevalent, so do the people detection solutions that use them. Choi et al. [34] proposed one such method. The depth image was initially downsampled and segmented into an initial number of regions, based on both distance and normals of neigh-bouring points. Based on heuristics such as height and width, regions not corresponding to training examples were discarded. Regions fulfilling all other criteria but size could be merged with larger regions. The Histogram of Oriented Depths descriptors [40] were calculated for each resulting region, and were classified as humans using SVMs.
With the development of more sophisticated people detection techniques, more complex prob-lems can be tackled. Chen et al. introduced a crowd identification method that employs object classification techniques [32]. Background subtraction and temporal differences of pixels were used to segment objects within a scene. The resulting objects were classified as crowds using a combination of methods: temporal features classified by the AdaBoost algorithm, the object’s self-similarity response, and analysis of its spatio-temporal energies.
Haritaoglu et al. [28] developed a system for detecting and tracking multiple people within a group called “Hydra”. A combination of background subtraction, region-based shape analysis and corner detection was used to segment individuals within a crowd. The resulting heads were then tracked with a dynamic template a second-order motion model. To recover from lost tracking due to camera occlusions, appearance models were constructed for each person.
![Figure 2.7: Images from the datasets Plagemann et al. used to evaluate their body part detector [1]](https://thumb-us.123doks.com/thumbv2/123dok_us/10202775.2923256/57.892.151.747.90.245/figure-images-datasets-plagemann-used-evaluate-body-detector.webp)
![Figure 2.8: Illustration of the depth image descriptor from Shotton et al. [2]. A yellow cross indicates the pixel, x, being classified](https://thumb-us.123doks.com/thumbv2/123dok_us/10202775.2923256/58.892.262.627.81.337/figure-illustration-depth-descriptor-shotton-yellow-indicates-classified.webp)