EXPERIMENTAL RESULTS ON SHOCK-WAVE/BOUNDARY-LAYER INTERACTION
INDUCED BY A MOVABLE WEDGE
Dennis Daub, Sebastian Willems, and Ali G ¨ulhan
DLR, German Aerospace Center, Institute of Aerodynamics and Flow Technology, 51147 Cologne, Germany
ABSTRACT
Experiments on shock-wave/boundary-layer interaction of an impinging shock on a flat panel at Mach numbers of 3 and 4 were conducted in the Trisonic Wind Tunnel (TMK) of the Supersonic and Hypersonic Technologies Department at DLR, Cologne. To obtain high frequency data, the model was equipped with 12 high-speed pres-sure transducers for meapres-surements at 100 kHz and high-speed schlieren photography was used. The experimental setup is designed for quick rotation of the shock gener-ator allowing testing at different ramp angles during one wind tunnel run. The static pressure distribution and high speed pressure fluctuations in the interaction area were analysed with regard to the spatial and temporal distri-bution of occurring frequencies. At the beginning of the separation and near the reattachment, a strong increase of low frequency fluctuations of up to 1 kHz was ob-served, while in the separated area also higher frequen-cies were excited. These results were compared to the frequencies and flow topology found in the high-speed schlieren videos.
Key words: SWBLI, shock-wave/boundary-layer interac-tion, shock unsteadiness, turbulent supersonic boundary layer, shock induced separation.
1. INTRODUCTION
Despite decades of research in this area, the unsteady be-haviour of shock-wave/boundary-layer interaction is not fully understood, but of great importance for the design of future space launch systems [1, 2, 3, 4], for example for air-breathing engines, overexpanded rocket nozzles or other parts of the vehicle exposed to incoming shocks. It can have a major influence on vehicle performance and reliability, for example with regard to structural fatigue. Furthermore, it is a challenging test case for validation of any simulation of turbulent supersonic compressible flow. Shock-wave/boundary-layer interaction occurs in super-sonic flow when a shock wave imposes an adverse pres-sure gradient on a boundary layer that leads to boundary layer separation. Due to propagation in the subsonic part
of the boundary layer a pressure rise occurs upstream of the nominal impingement point of the shock wave which in turn strongly affects the supersonic part of the flow field. This system usually shows low frequency motion of the flow structure on the order of about 1 kHz, while high frequency fluctuations are also amplified. A thor-ough description can be found for example in D´elery and Dussauge [4]. These phenomena can generally be ob-served for two different configurations. The interaction can be obtained due to a shock caused by the geometry of the wall, for a example a compression corner, or by an incident shock on a flat panel. In this paper the latter case is considered.
A comprehensive overview of previous work till 2001 is given by Dolling [5, 6]. With regard to the un-steadiness of the shock-wave/boundary-layer interaction Dolling concludes that no comprehensive theory exists to explain the phenomena observed in a great number of experiments and suggests that new experiments with non-intrusive high-speed instrumentation such as CCD cameras or laser-based techniques might in combination with high-speed pressure transducers lead to a better un-derstanding of the unsteady behaviour of the interaction, perhaps accompanied by high-fidelity Large Eddy Simu-lations (LES). Dussauge et al. [7] compiled results from various experiments to investigate whether there are some common features of the unsteadiness. He shows for ex-ample that the frequencies of the shock oscillations are on the same order of magnitude for some cases possibly yielding at least some general trends. A recent experi-ment on a case with an incident shock wave atM = 2.1
was conducted by Humble et al. [8] using Particle Im-age Velocimetry (PIV). A Direct Numerical Simulation (DNS) of a case with incident shock atM = 2.25was conducted by Pirozzoli and Grasso [3]. They found large-scale low frequency unsteadiness with peaks at discrete frequencies in the interaction zone. A comparison of dif-ferent Large Eddy Simulations can be found in Touber and Sandham [9]. All cases showed low frequency mo-tion of the flow structure.
The Collaborative Research Center Transregio 40 (SFB-TRR40) of the German Research Foundation (DFG) is concerned with the investigation of fundamental tech-nologies for future space launch systems. The results presented in this paper were obtained as preparation for planned experiments on fluid-structure interaction with a
shock impinging on an elastic panel meant to further the understanding of the complex physical phenomena oc-curring in such a configuration, namely turbulent com-pressible flow, flow separation and aeroelasticity, and to serve as a reference case for validation of coupled LES developed within SFB-TRR 40 [10, 11, 12].
2. EXPERIMENTAL SETUP
2.1. Facility
The experiments were conducted in the Trisonic Wind Tunnel (TMK) of the Supersonic and Hypersonic Tech-nologies Department (Esch [13]) at DLR, Cologne. TMK is a blow-down facility with a Mach number range of 0.5 to 4.5. Mach numbers of up to 5.7 are reached by heat-ing the workheat-ing gas and usheat-ing an ejector. For transonic flow, a special test section with perforated walls has to be used. The test section has a rectangular cross section of 0.6x0.6 m. The nozzle contour is variable and can be altered during the wind tunnel run. Typical test condi-tions for the conducted experiments are given in Table 1. The viscosity used for the Reynoldsnumber is calculated using the Sutherland formula with the coefficients as in [14].
Table 1. Typical test conditions M p∞[kPa] T∞[K] v∞[ ms ] Re∞[10 6 m ] 2.5 21.2 126.7 567 37.7 3.0 15.6 97.2 595 49.4 3.5 11.7 83.2 643 55.1 4.0 8.7 64.9 650 70.1 2.2. Model
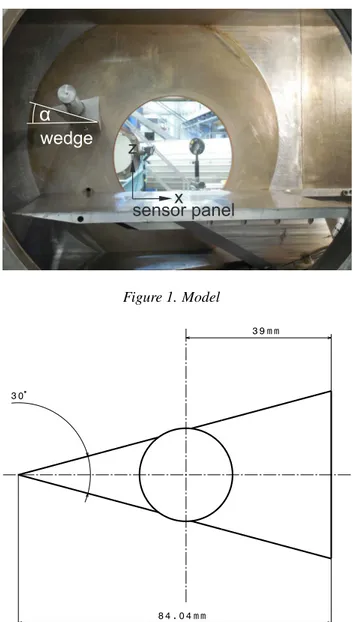
The model consists of a base plate (Figure 1) in which a panel equipped with sensors (Figure 3) can be mounted, and a rotatable wedge (dimensions see Figure 2). The po-sition of the shaft shown in Figure 2 is x = -108 mm and z = 182.5 mm. The coordinate system is shown in Fig-ure 1 and FigFig-ure 3. The movable wedge allowed quick changes of the ramp angleαeven during one wind tun-nel run. αis defined as the angle between the test panel and the lower side of the wedge as shown in Figure 1. The wedge spans the width of the test section to obtain a 2-dimensional flow field. The leading edge of the base plate is located at x = -220 mm and has a wedge angle of
10◦towards the bottom wind tunnel wall (see Figure 1). Boundary layer tripping was applied at the leading edge to obtain a turbulent boundary layer.
2.3. Instrumentation
To measure pressure fluctuations high-speed Kulite pres-sure transducers were used. Two Kulite
XTL-123CEG-wedge
sensor panel
α
x
z
Figure 1. Model Figure 2. Wedge190M with a eigenfrequency greater 175 kHz were used upstream and downstream of the test panel and another 10 high speed pressure sensors (Kulite XCQ-062) with a eigenfrequency greater 240 kHz on the test panel. Fur-thermore 48 Pressure Systems, Inc. (PSI) pressure ports for precise steady state pressure measurement with higher resolution were used. National Instruments 24-bit high speed bridge modules PXIe 4331 were used for data ac-quisition for the Kulite pressure transducers at a sampling rate of 100 kHz. Figure 3 shows the position of the sen-sors on the instrumented panel.
A Photron Fastcam SA-X was used for high speed schlieren photography at 20 kHz with a resolution of 1024x200 pixel, and 90 kHz with a resolution of 512x176 pixel to allow high-speed recording of the shock posi-tion and flow structure in the separaposi-tion area. The video analysis was conducted with the OpenCV Library using a Gaussian filter and the Canny edge detection algorithm [15]. This approach is similar to the one described by
Es-Figure 3. Instrumentation
truch et al. [16]. To compensate the vibration of the op-tical setup, a software image stabilization algorithm was used.
3. RESULTS AND DISCUSSION
3.1. Incoming Flow
ram pressure [kPa]
d is ta n c e [ m m ] 0 50 100 150 200 0 1 2 3 4 5 6 TAU turbulent TAU laminar Pitot rake - tripped
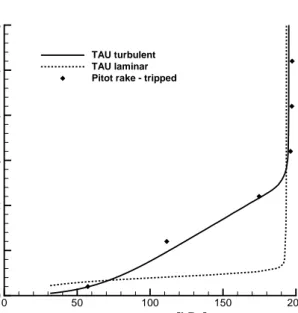
Figure 4. Boundary layer characterisation atM = 3and x=−70mm
Laser-2-Focus Velocimetry [17, 18] was used to ana-lyze the incoming flow field. The air flow was seeded with aerosol particles to measure the turbulent intensity and velocity in the incoming flow as also described in Willems et al. [19]. The turbulent intensity was found to be 1.9 % in direction of the flow and 2.3 % in
or-thogonal direction. The method could not be used to fully resolve the boundary layer. A small pitot rake was used instead and the boundary layer profile shown in Fig-ure 4 was measFig-ured and compared to turbulent (Wilcox k-ωturbulence model) and laminar calculation with DLR TAU [20].
3.2. Average Pressure Distribution
X [mm] P re s s u re [ P a ] 0 50 100 150 200 250 300 0 10000 20000 30000 40000 50000 60000 70000 22.5° 25° (a)M = 4 X [mm] P re s s u re [ P a ] 0 50 100 150 200 250 300 10000 20000 30000 40000 50000 60000 70000 80000 17.5° 20° (b)M = 3
Figure 5. Static pressure distribution
Figure 5 shows the static pressure distribution on the test panel forM = 4andM = 3at the considered anglesα measured with the PSI system. A separation of consid-erable size is obtained which is suitable for the study of the unsteady phenomena. The data shown were measured on the centerline of the instrumented panel. Further mea-surements were also conducted aty=−90 mm(see Fig-ure 3) to assFig-ure two-dimensional behaviour of the flow field. The pressure distributions show good agreement
making for example a LES of a ”slice” of the test panel a reasonable approximation.
3.3. Unsteady Behaviour - Pressure
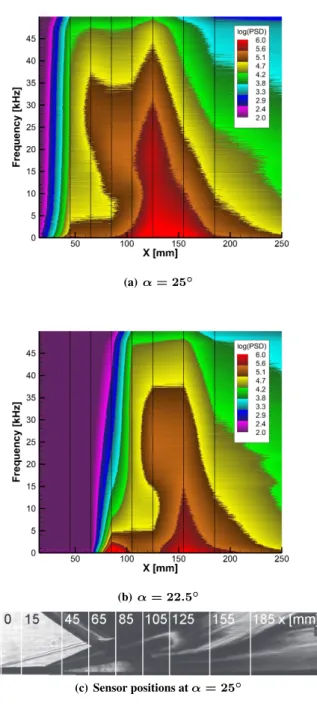
(a)α= 25◦
(b)α= 22.5◦
(c) Sensor positions atα= 25◦
Figure 6. PSD atM = 4
The Kulite pressure transducers provide a high-speed pressure signal that was recorded with 100 kHz. Figure 6 and Figure 7 show the spatial distribution of the Power Spectral Density (PSD) of the signal. To obtain the PSD the signal was divided into several blocks with 50 % over-lap, the Hann function was applied and the PSD was com-puted (Welch [21]). Then the blocks were averaged.
(a)α= 20◦
(b)α= 17.5◦
Figure 7. PSD atM = 3
Figure 6(c) shows the sensor positions in the schlieren image atM = 4,α = 25◦. The shock position in this image appears slightly forward of the shock position on the test panel due to side wall effects in the wind tunnel. It can be seen that for all cases there is a distinct rise in low frequency fluctuations in the vicinity of the separa-tion shock as well as at the reattachment, for Figure 6(a) and Figure 7(a) at aboutx= 45 mm, for Figure 6(b) and Figure 7(b) at aboutx = 85 mm. These positions cor-respond to the positions of the initial pressure rise seen in the static pressure distribution in Figure 5. A small change in position is caused by the lower spatial reso-lution of the high speed measurements compared to the PSI ports. The pressure fluctuations in this area can be attributed to the movement of the separation shock. The resolution of the sensor placement can also lead to a de-creased maximum amplitude of the pressure fluctuations as the sensor might not be exactly positioned at the point of maximum pressure fluctuations. Downstream in the
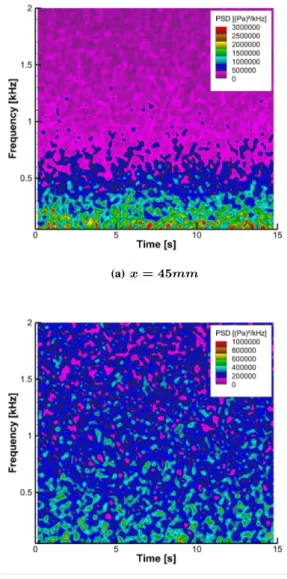
(a)x= 45mm
(b)x= 65mm
Figure 8. PSD atM = 3,α= 20◦, vicinity of the sepa-ration shock
separated area the fluctuation decreases by several orders of magnitude. This position roughly corresponds to the areas with nearly constant pressure seen in Figure 5, for example forM = 4at25◦ (Figure 6(a)) in Figure 5(a) from aboutx = 60 mmtox = 90 mm. A second rise of low frequency fluctuations can be observed in the reat-tachment area beginning for example atx= 100 mmfor M = 4at25◦ at about the same position as the second rise in pressure occurs in Figure 5(a). Downstream the fluctuations again decrease strongly. For high frequencies the PSD starts to rise in the separated area. ForM = 3at α= 20◦in Figure 7(a) the rise in power spectral density for high frequencies of up to about 30 kHz starts at about x= 75 mmwith a peak at aboutx= 100 mm. Down-stream the power spectral density quickly decreases. This behaviour is similar to observations made for ex-ample for a ramp configuration by Selig et al. [22] and Ringuette et al. [23].
(a)x= 105mm
(b)x= 155mm
Figure 9. PSD atM = 3,α= 20◦, vicinity of the reat-tachment
Figure 8 and Figure 9 show the temporal distribution of the Power Spectral Density of the signal at the sensor positionx = 45,65,105,155 mmfor frequencies up to 2 kHz at M = 3 at α = 20◦. Averaged in time the results shown in Figure 8 and Figure 9 can be found in Figure 7(a). As described in the previous paragraph, a strong rise in low frequency pressure fluctuations for fre-quencies below 1 kHz can be observed in Figure 8(a) at x = 45 mm, followed by much lower values in Fig-ure 8(b) atx = 65 mm. Again low frequency fluctua-tions rise atx = 105 mm Figure 9(a) and decrease at x= 105 mmFigure 9(b). What is remarkable about this is the great changes of PSD over time. If only a short time span is considered the resulting frequency spectra might look completely different. This should be taken into ac-count for any comparison to short duration DNS or LES calculations.
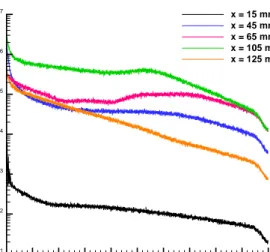
sig-Frequency [kHz] P S D [ P a ²/ k H z ] 5 10 15 20 25 30 35 40 45 50 101 102 103 104 105 106 107 x = 15 mm x = 45 mm x = 65 mm x = 105 mm x = 125 mm
Figure 10. PSD for pressure signals atM = 3,α= 20◦
nal of the sensors upstream of the interaction. Figure 10 shows the PSD atx= 15 mmand at the positions shown in Figure 8 and Figure 9. The sensor atx = 15 mmis located well ahead of the separation shock. The signal at this position shows no distinct features. The characteris-tic frequencyuinf/δof the boundary layer ([6]) for about u = 600 m/sandδ = 4.5 mmis about 130 kHz which could not be resolved with the sampling rate used.
Frequency [kHz] P S D [ P a ³/ k H z ] 10-1 100 101 0 1E+07 2E+07 3E+07 4E+07 5E+07 α=19.2° α=19.3° α=19.4° α=19.5° α=19.6° α=19.7° α=19.8°
Figure 11. PSD for pressure signals atx= 45 mm,M = 3,α= 19.2−19.8◦
Figure 11 shows the change of the power spectral den-sity for the sensor atx= 45 mmduring an experiment at M = 3with various wedge anglesα = 19.2◦−19.8◦. This sensor position is closest to the position of the sep-aration shock. The wedge angle is changed in intervals of 0.1◦ to show the effect of the sensor position on the resulting pressure signal. It can be seen that even a small
change in shock location leads to a significant difference in the recorded pressure signal. A maximum is reached forα= 19.6◦−19.7◦. For lower and higher wedge angle the PSD decreases.
3.4. Unsteady Behaviour - Flow Field
Figure 12. Example of a schlierenimageM = 3,α= 20◦
Frequency [kHz] P S D 0.2 0.4 0.6 0.8 1 0 50 100 150 200 M = 3 α =20° M = 4 α =25°
Figure 13. Schlieren atM = 4,α = 25◦ andM = 3, α= 20◦
To gain some insight into the dynamics of the flow field an edge detection algorithm was used to track the position of the separation shock. Figure 12 shows an example of a schlieren image atM = 3,α = 20◦. As previously noted, the shock position seen by the schlieren system does not completely agree with the shock position on the test panel due to side wall effects in the wind tunnel. The results obtained are shown in Figure 13. Especially for the case at M = 4, α = 25◦ a strong rise in low fre-quency fluctuations can be observed. Again no distinct peaks can be found but a rather broadband oscillation of the shock position. ForM = 3,α= 20◦the changes in shock position are much smaller.
4. CONCLUSION
Experiments on shock-wave/boundary-layer interaction with an impinging shock have been conducted at the Trisonic Wind Tunnel (TMK) of the Supersonic and Hy-personic Technologies Department at DLR, Cologne at M = 4andM = 3at various incident shock angles.
Using high speed pressure transducers some insight into the spatial and temporal distribution of the low frequency unsteadiness of the interaction could be gained. Espe-cially with regard to comparison to relatively short dura-tion LES or DNS calculadura-tions the strong temporal vari-ation of the occurring frequencies should be considered. The experiments yielded no discrete frequencies for low frequency movement of the interaction but rather a broad-band rise for frequencies below 1 kHz. With regard to the spatial distribution of the unsteady behaviour a strong rise in low frequency pressure fluctuations was observed in the vicinity of the separation shock. Within the separated area these fluctuations reduce by several orders of mag-nitude followed by a strong rise near the reattachment. In the separated area there is a strong rise in power spectral density of the pressure signals around 25-30 kHz. These results do not by themselves allow a full understanding of the dynamics of the shock-wave/boundary-layer interac-tion, they yield some insight into the occurring phenom-ena and provide a data set that numerical simulation or any other kind of model needs to be able to reproduce. For future experiments it would be desirable to achieve a higher resolution of high speed pressure measurements along the wall and to have improved measurement tech-niques to obtain data from the flow field such as an im-proved schlieren system or Particle Image Velocimetry.
ACKNOWLEDGMENTS
This project is financially supported by the German Re-search Foundation (Deutsche Forschungsgemeinschaft, DFG) within the Collaborative Research Center Tran-sregio 40 (Sonderforschungsbereich TranTran-sregio 40). We gratefully acknowledge the help and advice of the techni-cal staff of the Supersonic and Hypersonic Technologies Department in Cologne.
REFERENCES
[1] Robert Schmucker. TUM-LRT Bericht TB-10: Str¨omungsvorg¨ange beim Betrieb ¨Uberexpandierter D¨usen chemischer Raketentriebwerke. Technical report, Technische Universit¨at M¨unchen - Lehrstuhl f¨ur Raumfahrttechnik, M¨unchen, 1973.
[2] P Pozefsky. Identifying Sonic Fatigue Prone Struc-tures on a Hypersonic Transatmospheric Vehicle (ATV). In AIAA 12th Aeroacoustics Conference, San Antonio, TX, 1989. AIAA.
[3] Sergio Pirozzoli and Francesco Grasso. Di-rect numerical simulation of impinging shock wave/turbulent boundary layer interaction at M=2.25. Physics of Fluids, 18(6):065113, 2006. ISSN 10706631. doi: 10.1063/1.2216989. URL
http://scitation.aip.org/content/ aip/journal/pof2/18/6/10.1063/1. 2216989.
[4] Jean D´elery and Jean Paul Dussauge. Some physical aspects of shock wave/boundary layer interactions. Shock Waves, 19:453–468, 2009. ISSN 09381287. doi: 10.1007/s00193-009-0220-z.
[5] D. S. Dolling. Fluctuating Loads in Shock Wave/Turbulent Boundary Layer Interaction: Tu-torial and Update. In 31st Aerospace Sciences Meeting & Exhibit, Reno, NV, 1993. AIAA. doi: 10.2514/6.1993-284.
[6] D. S. Dolling. Fifty Years of Shock-Wave/Boundary-Layer Interaction Research: What Next? AIAA Journal, 39(8):1517–1531, Au-gust 2001. ISSN 0001-1452. doi: 10.2514/2.1476.
URL http://arc.aiaa.org/doi/abs/
10.2514/2.1476.
[7] Paul Dussauge, Pierre Dupont, and Jean-Franc¸ois Debi`eve. Unsteadiness in shock wave boundary layer interactions with sepa-ration, March 2006. ISSN 12709638. URL
http://linkinghub.elsevier.com/
retrieve/pii/S1270963805001495.
[8] R. A. Humble, F. Scarano, and B. W. van Oud-heusen. Unsteady aspects of an incident shock wave/turbulent boundary layer interaction. Journal of Fluid Mechanics, 635:47, September 2009. ISSN 0022-1120. doi: 10.1017/S0022112009007630.
URL http://www.journals.cambridge.
org/abstract\_S0022112009007630.
[9] Emile Touber and Neil D. Sandham. Comparison of three large-eddy simulations of shock-induced turbulent separation bubbles. Shock Waves, 19: 469–478, 2009. ISSN 09381287. doi: 10.1007/ s00193-009-0222-x.
[10] Muzio Grilli, Lin Strobio Chen, Stefan Hickel, Nikolaus Adams, Sebastian Willems, and Ali G¨ulhan. Experimental and numerical investi-gation on shockwave/turbulent boundary layer interaction. In 42nd AIAA Fluid Dynamics Con-ference and Exhibit, pages 1–15, 2012. URL
http://arc.aiaa.org/doi/pdf/10.
2514/6.2012-2701.
[11] Muzio Grilli, Stefan Hickel, and Nikolaus Adams. Large-eddy simulation of a supersonic turbulent boundary layer over a compression-expansion ramp. International Journal of Heat and Fluid Flow, 42:79–93, August 2013. ISSN 0142727X. doi: 10.1016/j.ijheatfluidflow.2012.12.006. URL
http://linkinghub.elsevier.com/
retrieve/pii/S0142727X13000052.
[12] Vito Pasquariello, Muzio Grilli, Stefan Hickel, and Nikolaus Adams. Large-eddy simulation of passive shock-wave/boundary-layer interaction control. International Journal of Heat and Fluid Flow, 49:116–127, October 2014. ISSN 0142727X. doi: 10.1016/j.ijheatfluidflow.2014.04.005. URL
http://linkinghub.elsevier.com/
retrieve/pii/S0142727X14000460.
[13] Helmut Esch. Die 0,6-m X 0,6-m-Trisonische Meßstrecke (TMK) der DFVLR in K¨oln-Porz
(Stand 1986). Technical Report 86-21, DLR, K¨oln, 1986.
[14] E. H. Hirschel. Basics of Aerothermodynamics. Springer-Verlag Berlin Heidelberg New York, 2005. ISBN 3-540-22132-8.
[15] John Canny. A Computational Approach to Edge Detection. IEEE Transactions on Pattern Analysis and Machine Intelligence, PAMI-8(6): 679–698, November 1986. ISSN 0162-8828. doi: 10.1109/TPAMI.1986.4767851. URL http:// ieeexplore.ieee.org/lpdocs/epic03/
wrapper.htm?arnumber=4767851.
[16] D Estruch, N J Lawson, D G MacManus, K P Garry, and J L Stollery. Measurement of shock wave unsteadiness using a high-speed schlieren sys-tem and digital image processing. The Review of scientific instruments, 79(12):126108, Decem-ber 2008. ISSN 1089-7623. doi: 10.1063/1. 3053361. URLhttp://www.ncbi.nlm.nih.
gov/pubmed/19123599.
[17] Richard Schodl. Entwicklung des Laser-Zwei-Fokus-Verfahrens f¨ur die ber¨uhrungslose Messung der Str¨omungsvektoren, insbesondere in Turbo-maschinen. PhD thesis, RWTH Aachen, 1977. [18] Alain Boutier, Guy Fertin, and Jean Lefevre. Laser
Velocimeter for Wind Tunnel Measurements. IEEE Transactions on Aerospace and Electronic Systems, AES-14(3):441–455, 1978.
[19] Sebastian Willems, Burkard Esser, and Ali G¨ulhan. Shock induced fluid structure interaction on a flex-ible wall in supersonic turbulent flow. InProgress in Flight Physics - Volume 5, volume 5, pages 285– 308, 2013. doi: 10.1051/eucass/201305.
[20] D. Schwamborn, T. Gerhold, and R. Heinrich. The DLR TAU-Code: Recent Applications in Research and Industry. Invited Lecture in Proceedings on CD of the European Conference on Computational Fluid Dynamics ECCOMAS CDF 2006, pages 1– 25, 2006.
[21] P. Welch. The use of fast Fourier transform for the estimation of power spectra: A method based on time averaging over short, modified periodograms. IEEE Transactions on Audio and Electroacoustics, 15(2):70–73, 1967. ISSN 0018-9278. doi: 10.1109/ TAU.1967.1161901.
[22] M. S. Selig, J. Andreopoulos, K. C. Muck, Jean-Paul Dussauge, and a. J. Smits. Turbulence structure in a shock wave/turbulent boundary-layer interaction. AIAA Journal, 27(7):862–869, July 1989. ISSN 0001-1452. doi: 10.2514/3. 10193. URL http://arc.aiaa.org/doi/
abs/10.2514/3.10193.
[23] Matthew J. Ringuette, Patrick Bookey, Christopher Wyckham, and Alexander J. Smits. Experimental Study of a Mach 3 Compression Ramp Interaction at Re{theta}= 2400.AIAA Journal, 47(2):373–385, February 2009. ISSN 0001-1452. doi: 10.2514/ 1.38248. URLhttp://arc.aiaa.org/doi/