1
A National Projection Model for the Denomination in the US
The United Methodist Church in the US has been in decline since the 1960s. Today, there is a sense of urgency throughout its leadership that significant changes must be adopted in order to improve its future prospects.1 To fully consider proposals for change, it is useful to develop a portrait of the future. Exactly what will our denomination look like in the future if no changes are implemented?
Toward that end, a projection model for the denomination has been constructed. This model provides portraits of what the United Methodist Church in the US might look like as time passes until the year 2030. The model does not cover everything. However, it does project several meaningful metrics, among others: worship attendance, total expenditures, elders appointed to the local church, and elders seeking appointments in the local church. The most significant question it answers is that of worship attendance. Most understand that a declining worship attendance hinders our ability to make disciples of Christ—our declared mission. The size of the recent decline is alarming. Will it continue its present path or will there be a better day ahead? Are there changes that can be implemented that will improve our plight? Are such changes within our reach?
There are many other parts of the church literature that provide insights and recommendations for church growth.2 This projection model is based upon economic research of historical patterns of changes in worship attendance at the local church level. An examination of projections supports recommendations for reversing the downward trend in worship attendance in the US.
I. A Simple (Hopefully Unreliable) Projection
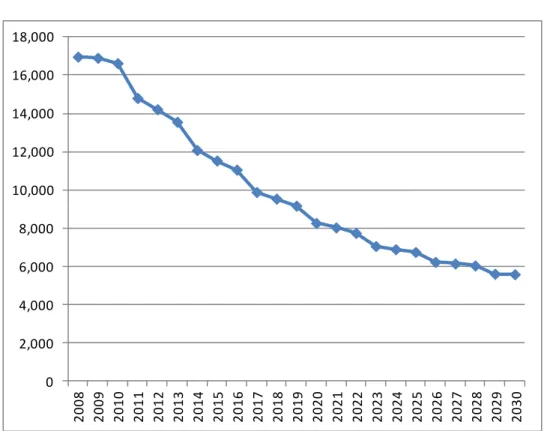
Our ability to continue mission and ministry at current levels requires large numbers of vital congregations, and worship attendance is a principle measure of church vitality. We have suffered through decades of declining worship attendance. But recently, the decline has become steeper. Figure 1 presents the annual change in worship attendance in our denomination in the US since 1980.
1
The Council of Bishops, in its November 2011 meeting, voted overwhelmingly to endorse the recommendations of the Interim Operations Team. The report from this team seeks to “… redirect the flow of attention, energy, and resources to an intense concentration on fostering and sustaining an increase in the number of vital congregations effective in making disciples of Jesus Christ for the transformation of the world.”
2
See, for example, David A. Roozen and C. Kirk Hadaway, Church Denominational Growth: What Does and Does
Not Cause Growth and Decline, Abingdon Press, Nashville, Tennessee, 1993 and Roger Finke and Rodney Stark, The Churching of America, 1776-2005, Rutgers University Press, New Brunswick, NJ, 2006.
2 Figure 1
Annual Changes in Worship Attendance
The shaded area highlights the rapid decline. Since records have been kept, we have never seen nine consecutive years of decline in worship attendance. The accumulated loss over these nine years reaches almost 0.5 million attendees--a 13.9% decrease in worship attendance. The annual average loss in attendance over these nine years equals 54,774. If this annual loss in worship attendance continues into the future, we will have to close all of our churches. The last worship service, according to this simple projection, will be held in the year 2065. The infants we baptized in 2010 will no longer attend a United Methodist worship service by the time they reach the age of 55.
The last United Methodist church in the US would likely close sooner than 2065 because of the earlier loss of the infrastructure required to support the denomination. With this annual decline, the closure of the last United Methodist church would more likely occur fifteen years earlier—by 2050—less than forty years away. Our predecessor denomination was established in 1784 at the historic Christmas Conference. None of our members were there. Yet, if this simple projection were accurate (which is unlikely), many of our current members will be around to see its demise. The method used in this projection is far too simplistic to be useful. But it does demonstrate the urgency of the day. II. A More Sophisticated and (Hopefully) More Accurate Projection
A more sophisticated projection model has been constructed for the purpose of painting a more accurate portrait of our future. It is sophisticated in that it makes use of extensive data collections and appropriate statistical tools of analysis. It required the use of data from end-of-year local church reports, clergy pension records, demographic information about the US population, physical addresses
-80,000 -60,000 -40,000 -20,000 0 20,000 40,000 60,000 80,000 1980 1981 1982 1983 1984 1985 1986 1987 1988 1989 1990 1991 1992 1993 1994 1995 1996 1997 1998 1999 2000 2001 2002 2003 2004 2005 2006 2007 2008 2009 2010
3
of our churches, measures of inflation, records of mergers of annual conferences, life expectancy tables, and attendance patterns among other mainline denominations. It required the use of completed studies of new church starts, the impact of debt upon the local church, drivers of church growth, and local church spending patterns.
The projection model includes several working components. A worship attendance component incorporates the known drivers of worship attendance. This component incorporates new church starts and predicts church closures. The clergy component identifies every elder and provisional elder in the denomination. The component “ages” each elder and predicts the time of retirement and death. It incorporates new elders into the denomination, each having his or her own assigned age and gender. It separates elders into two groups: those seeking appointments in the local church and those seeking employment beyond the local church. A local church component identifies local churches seeking elders as appointed clergy.
Spending Components3
The spending component projects several key spending variables: program expenditures, compensation for non-clergy staff, facility expenditures from both savings and loans, and total debt. Churches are separated into three groups: churches with complete histories (1990-2009)—Group 1, churches with incomplete histories (new churches with less than 15 years operating history by 2009)— Group 2, and new churches yet to be established (new churches established 2010 to 2030)—Group 3.
Each local church is assigned spending levels among components based upon changes observed over the 1990 to 2009 time period. Annual changes (not percentages) are calculated for each
component and added annually to the 2009 starting year. All figures are adjusted for inflation. Limits are placed upon each projection based upon a maximum percentage—the maximum percentage being a percentage of total net spending. Total net spending projections are based upon historic changes in net spending per attendee times projected attendance.
Worship Attendance
Worship attendance projections come from several regression equations.4 Each equation lags explanatory variables one year. This means that program expenditures are expected to have their impact on worship attendance the following year. The explanatory variables include each of the spending components, age and gender of the senior pastor, years the senior pastor has been in the appointment, affinity population, and a “decay” variable. The decay variable is a time trend that decreases worship attendance as time passes. The magnitude of the decay variable is based upon
3
The spending components are identified in a series of studies. For example, see Donald R. House and Lovett H. Weems, Jr., “Local Church Indebtedness and Local Church Vitality: Will the Increase in Local Church Indeptedness Over Past Decades Pay Dividends?”, Texas Methodist Foundation, September 2011.
4
Regression equations are part of a statistical analysis used by economists and others to identify relationships among variables and measure their magnitudes. With regression analysis it is possible to separate multiple forces
at work and examine each individually. See, for example, Hans Levenback and James P. Cleary, The Beginning
4
across church size. For our purposes, the decay variable measures a growing anti-church theme in society.
Table 1 presents the grouping of local churches among assigned tiers. The structures used for projections differ by tier.
Table 1 Tier Assignments
Local Church Positions for Elders
Projections for elder positions in the local church are based upon several sets of regression equations. For churches with single pastors, the projection equation includes, as explanatory variables, worship attendance and the minimum compensation for elders set by the annual conference. For each local church, the equations calculate a probability that the local church will seek an elder as senior pastor. A random number is generated to determine which of the local churches will seek an elder.
For multiple pastor churches, projection equations first project the number of pastors to be appointed. The projection equations include, as explanatory variables, worship attendance, net
spending per attendee, affinity population, minimum salary for elders, and the ethnic/racial composition of the congregation. Once the number of clergy appointed is established, another projection equation projects the percentage of these clergy that will be elders. The elder percentage equation contains the same explanatory variables.
Elders Seeking Positions in the Local Church
The projection of the number of elders seeking positions in the local church begins with a census of elders for each year between 1982 and 2010. Elders serving the local church as pastors are identified. Projection equations are used to predict retirements, transitions to an inactive status, and death. These equations are used for predictions for every individual elder.
For each annual conference, new elders are introduced in each year of the projection, based upon historical patterns for each annual conference. Age and gender compositions of new elders are
Tier 1 Worship Attendance Less Than 60 Tier 2 Worship Attendance 60 to 124 Tier 3 Worship Attendance 125 to 349 Tier 4 Worship Attendance 350 to 499 Tier 5 Worship Attendance 500 to 999 Tier 6 Worship Attendance 1,000 and Above
5
based upon historical patterns. Projection equations are used to predict retirements, transitions to an inactive status, and death.
Once the pool of active elders is completed, elders are separated into two groups: those seeking positions beyond the local church (missionaries, staff of seminaries, district superintendents, etc.) and those seeking appointments in the local church. Historical trends separating the two groups are constructed and used to project the number of elders with positions beyond the local church. All remaining elders are assumed to seek appointments in the local church.
Surplus (Shortage) of Elders
Each year of the projection, the number of elders seeking appointments in the local church is compared to the number of elder positions in the local church. For each year, there can be a surplus or a shortage. The condition of surplus/shortage can differ between and among each annual conference. Annual conference projections are not included in the national projections.
Net Spending
Net spending, for the purposes of the projections, is defined as total local church expenditures minus payments on principle and interest on loans and facilities expenditures from savings. Other measures of net spending may be defined differently. The total net spending projection is simply the product of net spending per attendee and worship attendance. These figures are expressed in nominal and real (adjusted for inflation) terms.
Church Closures
Church closures are projected on the basis of worship attendance and net spending per attendee. Closures are assumed to occur if worship attendance reaches a minimum. The minimum is increased if the congregation is financially strong. Table 2 presents the closure conditions.
Table 2
Conditions of Church Closure
A local church with worship attendance greater than 14 is assumed to remain open. One with worship attendance between 10 and 14 is assumed to remain open only if net expenditures per attendee exceed the 50th percentile (median) of net expenditures per attendee in the previous year. If not, the church is
Net Expenditures
Worship Per Attend Church
Attendance Limit Condition
15 or greater None Open
10 to 14 50th Percentile Open 5 to 9 75th Percentile Open
6
expenditures per attendee exceed the 75 percentile of net expenditures per attendee in the previous year. If not, the church is assumed closed. A local church with average worship attendance less than 5 under any condition is assumed to remain closed. This screen is applied every year to every church between 2010 and 2030.
This closure rule does not match those currently used by annual conferences and their districts. Some are more severe and some are less severe. In the future, budget pressures will reduce the
financial subsidies required to keep the very small local churches operating.5 Number of Local Churches
The projected number of local churches for each year represents the number of local church existing the previous year, minus new closures, plus new church starts. As explained, church closures occur when worship attendance falls below a minimum threshold. Minimum thresholds can differ depending upon the financial strength of the congregation. New church starts are introduced by historic patterns within each annual conference.
New Church Starts
Projections of new church starts are based upon historical patterns observed within each annual conference. These patterns take into account the number of new church starts, the first-year average worship attendance, and the ethnic/racial composition of the congregation. Each new church start, beginning after 2009, follows the growth pattern of an actual new church start observed during the 1990 to 1995 period. Once the new church has completed 15 years of operation, the assignment of spending patterns and senior pastors follow methods used for existing churches.
Spending Limits
Using historical spending patterns, it is usual to find annual increases in spending that are unsustainable. In such instances, limits are placed upon components. The limits are tailored to the specific variable. Table 3 presents the spending limits imposed upon the projections.
5
Gil Rendle recognizes the need to increase the minimums required of small churches. The subsidies expended to maintain operations among very small churches are significant. Many annual conferences find it increasingly difficult to fund these subsidies.
7 Table 3 Spending Limits
Worship Attendance Growth Limits
Given the projections of spending, it is possible to project a growth of worship attendance that is unreasonable. To limit the growth in projected worship attendance, the increase in worship
attendance cannot exceed an increase of 0.5% of the existing affinity population. The application of the worship attendance growth limit is relatively rare—less than 4% of the time for Tier 1 churches and less than 1% of the time for Tier 6 churches.
Net Spending per Attendee Limits
Using historical growth patterns, it is possible to project unreasonable levels of net spending per attendee (adjusted for inflation). The projections include limits established for each tier during each year of the projection to mitigate the likelihood that unreasonable or unsustainable spending is included in the projections. The limit represents the 90th percentile in each tier-year distribution.
A Growing Anti-Church Theme
Lovett Weems has recently identified a marked increase in the decline in worship attendance among mainline denominations beginning in 2002. Figure 2 presents worship attendance records among four mainline denominations.6
6
These data were graciously provided by Lovett Weems.
Spending Component Limit Applies
Program Expenses 25% of total net spending All Churches Non-Clergy Staff Compensation 40% of total net spending All Churches Facilities Spending from Savings 100% of total net spending All Churches
Total Debt 125% of total net spending Tier 2 Churches Only Facilities Spending from Loans 200% of total net spending Tiers 3 and Above
8
Worship Attendance Four Mainline Denominations
It is important to note that the marked increase in the rate of decline is shared among all our
denominations. It is most pronounced among the United Methodists and the ELCA. Studies of the rate of decline in the United Methodist church clearly record the marked downturn and the fact that it does not seem to be related to any observed factors that would explain it. For our purposes, we are referring to this trend as the product of an anti-church theme that negatively affects worship attendance. It may reflect the growing secularization of modern society in the US. It may reflect the growing reports of lawsuits seeking to rid our communities of Christian symbols. It may reflect the efforts to eliminate references to Christmas and Easter in schools. It may reflect the growth of sports clubs that require our children’s Sunday attendance at sporting events. This listing could be expanded.7
7
The secularization of society in the US has been a subject in the literature for some time. See, for example, Jonathan Gruber and Daniel M. Hungerman, “The Church vs. the Mall: What Happens When Religion Faces Increased Secular Competition?,” National Bureau of Economic Research, Working Paper 12410, July 2006.
9
For our projections to be useful and reasonably accurate, one must take this recent trend into account. The projections do so and permit the strength of the anti-church theme to increase with time. In none of the projections do we assume that it will cease to exist but will remain as a barrier to
overcome.
III. Projections of Worship Attendance
No one knows with certainty what the future holds for our local churches. There are some drivers that affect worship attendance that are well-identified and how some of these drivers will affect worship attendance is well-understood. For instance, we know how a church is affected by changing demographics of the population surrounding the local church, and we have good projections of these demographic changes. However, there are other drivers. Church leaders will help determine the extent to which some of these drivers will enhance worship attendance. However, we do not know the path church leaders will take. Nor do we know the future strength of the anti-church theme in the US.
Because of these uncertainties, it is best to construct several projections, each with differing assumptions concerning the known drivers. Multiple projections provide useful information. They can help determine the range of possible outcomes and the sensitivity of the outcome to differing
assumptions. They enable the reader to make his or her own selection of assumptions to establish a preferred projection.
Based upon recent research, there are three drivers that require special attention. Some are under the control of church leaders. One is not.
1. Local Church Spending Patterns 2. New Church Starts
3. Anti-church Theme
Research shows that a local church is more likely to grow if it spends its funds for the purpose of growth. Spending patterns matter. Each projection must specify how local churches will spend their funds.
Research also shows that new church starts promote growth in worship attendance—much more than existing churches. All new church starts are not the same. One must establish the essential characteristics of each new church start.
The recent decline in worship attendance presented in the shaded area of Figure 1 can be identified and measured. It is related to the growing anti-church theme, and one must consider its future strength. Can local churches effectively overcome this barrier and return to a path of growth?
10
The local church is the single largest employer of elders in the United Methodist church. In 2009, 77 percent of active elders were serving the local church. As one might expect, the positions available for elders in the local church has decreased with the decline in worship attendance and the decline in the number of churches. Table 1 presents the counts of elders serving the local church, comprised of elders in churches with single pastoral appointments and elders in churches with multiple pastoral appointments.
Table 4
Number of Elders Serving the Local Church
Over this period, the total number of elders appointed to the local church decreased at an annual rate of 0.34%. Notice that the number of elders in churches with multiple pastoral appointments actually increased from 4,632 in 1990 to 5,597 in 2009. Today, about one fourth of our elders serve local churches with multiple pastoral appointments.
Records indicate that elders are rarely appointed to our smaller churches (Tier 1), and our largest churches (Tier 6) are always led by elders. Part of the reason for this pattern is the annual
Year Single Multiple Total Mult Pct 1990 20,124 4,632 24,756 18.71% 1991 20,098 4,542 24,640 18.43% 1992 20,128 4,430 24,558 18.04% 1993 20,005 4,421 24,426 18.10% 1994 19,874 4,447 24,321 18.28% 1995 19,753 4,458 24,211 18.41% 1996 19,690 4,500 24,190 18.60% 1997 19,537 4,779 24,316 19.65% 1998 19,428 4,784 24,212 19.76% 1999 19,302 4,914 24,216 20.29% 2000 19,096 5,021 24,117 20.82% 2001 19,022 5,123 24,145 21.22% 2002 18,934 5,088 24,022 21.18% 2003 18,883 5,072 23,955 21.17% 2004 18,780 5,136 23,916 21.48% 2005 18,602 5,239 23,841 21.97% 2006 18,223 5,367 23,590 22.75% 2007 17,930 5,815 23,745 24.49% 2008 17,652 5,707 23,359 24.43% 2009 17,623 5,597 23,220 24.10% Rates -12.4% 20.8% -0.34%
11
conference requirement that elders must be compensated at or above an established minimum salary. Many smaller churches find it difficult to establish its pastor compensation at or above this minimum.
Research indicates that the likelihood that a local church will establish a salary at or above this minimum depends upon its worship attendance and the minimum established by the annual
conference. Projections must take into account changes in these minimum salaries. Many are
concerned about the levels of educational debt new seminary graduates have to carry. Some argue for increases in these minimums to ensure a compensation package that would allow new clergy to handle educational debt and all other financial obligations.
V. A Series of Projections
The following pages present seven projections based upon differing assumptions. Comparisons between and among these projections help tell a story. It helps focus upon the central forces at work that will determine our future as a denomination.
To place things in historical perspective, keep in mind the following facts: Table 5
Annual Rates of Change
The rate of decline in worship attendance became steeper in the second half of this decade. The loss of elder positions in the local church likewise declined at a faster pace in the second half. Spending patterns changed partly due to the recession. Expenditures on facilities from loans took the largest hit (-10.30%). Due to the downward spending trend among these four spending components, total spending was flat during the past decade (0.00%), compared to significant growth the previous decade (4.94%). It is notable, but not surprising, that between 2000 and 2009 local churches protected non-clergy staff positions (1.15%) but cut programs (-2.80%) and expenditures on facilities from savings (-0.26%). An important questions remains—what will local churches do after the recession?
Some of the tables are separated into groups. Group 1 represents local churches that were consistently in operation between 1990 and 2009. Group 2 are churches that started after 1990 and were in operation in 2009. Group 3 are projected new church starts—starting between 2010 and 2030.
1990-2000 2000-2010 2005-2010 1990-2010 Worship attendance 0.06% -1.32% -1.72% -0.54% Edler Appointments -0.26% -0.42% -0.66% -0.34% Expenditures Programs 2.61% -0.89% -2.80% 0.94% Non-clergy staff 4.71% 2.27% 1.15% 3.55%
Facilities from savings 4.37% -2.25% -0.26% 1.18% Facilities from loan 5.16% -1.01% -10.30% 2.03%
12 Projection I
The first projection is based upon the following assumptions:
1. Growth in local church spending among Group 1 churches (32,684 in total) mirrors the 1990-2009 growth patterns. Average annual growth rates in among key spending components, adjusted for inflation, are as follows:8
Program Expenditures: 1.28% Non-clergy Staff Compensation: 1.47% Facilities Expenditures: Savings: 0.46% Facilities Expenditures: Loans 5.55%
The expenditures for each of these categories vary by local church, based upon its own spending histories. The projected spending levels for each local church are multiplied by the probabilities of positive spending in each category.9 These growth rates were influenced by the 2007 and 2008 recession.
2. New church starts reflect the historical frequencies and sizes as recorded within each annual
conference over the 1990 to 2009 period. New church starts are separated into categories based upon 1st-year worship attendance. Category 1 includes churches with worship attendance equal to or less than 50. Category 2 includes churches with 1st-year worship attendance greater than 50.
3. The anti-church theme over the 2002 to 2009 period reduced worship attendance. The effect varied by church size (192.5 attendees among churches with worship attendance greater than 1,000 and 7.1 attendees among churches with worship attendance less than 60). The projection assumes that the effect upon local churches grows with time. The average reduction increases in size by 0.1 attendees per year in the smaller churches and by 0.05 per year among the larger churches. The anti-church theme is not assumed to subside but to gradually increase in magnitude. By 2030, the loss of attendees from the anti-church theme is projected to be 200% of the level observed between 2002 and 2009.
8
These growth rates are derived from calculations that take into account church closures and historical patterns spending.
9 For example, if a church employs non-clergy staff fifteen out of the twenty years between 1990 and 2009, each
13 Table 6
Projected Spending Patterns Adjusted for Inflation
Projection I
This projection assumes that between 2010 and 2030, spending (adjusted for inflation) for programs will increase at an annual rate of 1.28%. This is slightly above the annual rate registered for the 1990-2010 period. The annual rate for non-clergy staff compensation is 1.47%--slightly greater than that of programs. Spending on facilities from savings is expected to increase modestly (0.46% per year). The most significant growth is in spending on facilities from loans (5.55%). This is slightly larger than the annual rate for the 1990 to 2000 period. These figures represent what was derived from the actual spending patterns of local churches between 1990 and 2009. These rates all reflect the impact of the recession.
Programs Staff Savings Loans Total
2008 148,340,080 545,263,808 294,675,232 328,180,064 1,316,459,184 2009 140,864,896 542,239,808 293,074,208 214,375,408 1,190,554,320 2010 138,791,584 533,031,712 227,383,328 154,276,928 1,053,483,552 2011 139,421,632 536,775,136 225,173,680 168,529,008 1,069,899,456 2012 140,677,200 544,945,792 225,102,784 184,073,984 1,094,799,760 2013 142,176,592 554,378,368 225,502,752 199,639,056 1,121,696,768 2014 143,826,240 564,342,272 226,147,344 214,767,408 1,149,083,264 2015 145,744,976 574,577,536 227,095,584 230,185,584 1,177,603,680 2016 147,748,800 584,780,544 228,294,288 245,407,584 1,206,231,216 2017 149,822,576 594,501,376 229,492,496 260,578,208 1,234,394,656 2018 151,912,368 603,968,640 230,874,912 275,590,912 1,262,346,832 2019 154,056,400 613,295,680 232,389,568 290,569,248 1,290,310,896 2020 156,243,984 622,613,760 233,542,160 305,370,912 1,317,770,816 2021 158,472,672 631,852,096 234,707,216 319,868,640 1,344,900,624 2022 160,740,704 641,070,912 235,992,528 334,626,592 1,372,430,736 2023 163,049,600 650,444,672 237,662,848 349,864,288 1,401,021,408 2024 165,388,800 659,841,216 239,380,144 365,027,680 1,429,637,840 2025 167,722,784 668,909,760 241,043,552 380,026,208 1,457,702,304 2026 170,028,656 677,854,656 242,747,712 394,988,448 1,485,619,472 2027 172,289,408 686,719,232 244,473,584 409,866,016 1,513,348,240 2028 174,552,832 695,724,992 246,063,088 424,718,912 1,541,059,824 2029 176,864,976 704,832,896 247,748,752 439,546,464 1,568,993,088 2030 179,105,376 713,680,896 249,245,488 454,159,328 1,596,191,088 Rates 1.28% 1.47% 0.46% 5.55% 2.10%
14
Worship Attendance Projection I
Worship attendance among long-established churches (Group1) is projected to decline at an annual rate of 0.89%. This rate is less than the rate of decline over the 2000 to 2010 period (1.32%). This figure reflects the spending patterns presented above and a continuation of the anti-church theme. Growth among new churches is expected to partially offset this rate of decline—reducing its rate from 0.89% to 0.61%. The anti-church theme is expected to grow in strength. Local churches, through spending, are expected to partially offset the downward pressures from the theme.
Group 1 Group 2 Group 3 Total
2010 2,986,538 85,039 2,908 3,074,485 2011 2,935,833 86,284 5,198 3,027,315 2012 2,913,732 87,869 9,716 3,011,317 2013 2,894,791 87,934 14,489 2,997,214 2014 2,874,560 89,964 18,802 2,983,326 2015 2,852,811 91,298 22,996 2,967,105 2016 2,828,535 92,220 27,836 2,948,591 2017 2,802,337 93,483 32,032 2,927,852 2018 2,775,204 93,759 37,496 2,906,459 2019 2,748,076 94,894 43,904 2,886,874 2020 2,722,009 98,140 47,344 2,867,493 2021 2,697,151 99,889 53,371 2,850,411 2022 2,673,349 101,406 60,562 2,835,317 2023 2,650,950 103,183 67,608 2,821,741 2024 2,629,150 104,287 75,030 2,808,467 2025 2,607,427 103,434 80,403 2,791,264 2026 2,584,468 105,300 87,480 2,777,248 2027 2,562,678 106,519 92,108 2,761,305 2028 2,540,284 109,187 95,770 2,745,241 2029 2,519,247 112,238 100,294 2,731,779 2030 2,498,352 114,658 106,556 2,719,566 Rates -0.89% 1.51% 19.73% -0.61%
15 Table 8 Church Closures
Projection I
Due to the decline in worship attendance, we expect in this projection to close 7,656 local churches. A total of 85 of the 665 new churches in Group 3 (or 12.8%) are expected to close before the end of 2030. By new church start standards, this is a relatively small percentage. Some of the new churches, by 2030, would have very few years of operation and less opportunity to fail. A total of 142 of the new churches established after 1990 and before 2010 (out of 632) are expected to close. This represents 22.5% of these churches.
Group 1 Group 2 Group 3 Total
2010 269 7 0 276 2011 352 12 0 364 2012 233 13 0 246 2013 251 5 2 258 2014 344 7 1 352 2015 307 9 4 320 2016 353 7 3 363 2017 382 11 8 401 2018 348 8 2 358 2019 384 8 2 394 2020 376 6 5 387 2021 386 5 4 395 2022 391 6 3 400 2023 444 8 4 456 2024 439 7 8 454 2025 455 5 5 465 2026 362 4 7 373 2027 346 6 8 360 2028 333 2 9 344 2029 355 2 5 362 2030 319 4 5 328 Total 7,429 142 85 7,656
16
Number of Elder Appointments Projection I
Due to both worship attendance decline and spending pressures, there will be a loss of 2,402 elder appointments between 2010 and 2030, according to Projection I. Annual rates of decline are expected among long-established churches (Group1), followed by churches established sometime between 1990 and 2009. New churches are expected to create 317 new elder appointments by 2030. Growth among new churches significantly reduces the rate of decline in elder appointments—from -1.32% to -1.15%.
One might note that the annual rate of decrease in worship attendance in this projection is 0.61% compared to the annual rate of decrease in elder appointments—1.15%. We are expected to lose elder appointments faster than worship attendees. This fact is driven by the pattern of changes in worship attendance. The largest churches (Tier 5 and Tier 6) are expected to gain attendees
membership, and the smaller churches are expected to lose attendees. The loss of attendees in Tier 2 significantly affects the number of elder appointments while the gains in attendees in the larger churches have much smaller, positive effects on elder appointments.
Group1 Group 2 Group 3 Total
2010 11,329 301 17 11,647 2011 11,248 300 29 11,577 2012 10,964 286 54 11,304 2013 10,926 285 77 11,288 2014 10,748 287 83 11,118 2015 10,554 270 101 10,925 2016 10,489 265 120 10,874 2017 10,266 260 139 10,665 2018 10,102 248 141 10,491 2019 10,030 245 178 10,453 2020 9,987 242 191 10,420 2021 9,850 252 195 10,297 2022 9,667 233 204 10,104 2023 9,463 238 219 9,920 2024 9,343 245 241 9,829 2025 9,307 242 262 9,811 2026 9,287 249 278 9,814 2027 9,045 246 278 9,569 2028 9,053 239 287 9,579 2029 8,889 245 312 9,446 2030 8,684 244 317 9,245 Rate -1.32% -1.04% 15.75% -1.15% Net Loss 2,645 2,402
17 Projection II
The second projection is based upon the following assumptions:
1. Growth in local church spending among Group 1 churches mirrors the 1990-2009 growth patterns (same as Projection I). The annual spending growth rates in this scenario are slightly less than those in Projection 1 because, as will be explained below, there are more church closures. Average annual growth rates are as follows:
Program Expenditures: 1.19% Non-clergy Staff Compensation: 1.37% Facilities Expenditures: Savings: 0.31% Facilities Expenditures: Loans 5.51%
2. New church starts are significantly increased—doubled the frequencies included in Projection 1. The mix of new church starts is similar to those in Projection I. There are no efforts to increase the
percentage of new churches in Category I at the expense of new churches in Category II. This assumption may best reflect in the intent behind the Path I program.
3. The anti-church theme is assumed to become significantly stronger as time passes. The loss of attendees caused by the theme is 50% greater than losses attributed to the anti-church theme in Projection I. The increased numbers of new church starts in this projection might be viewed as an effort to mitigate the effects of a stronger anti-church theme.
18
Projected Spending Patterns Adjusted for Inflation
Projection II
As explained, projected spending patterns are slightly reduced compared to those in Projection I. This is due to the projected increase in the number of church closers.
Programs Staff Savings Loans Total
2008 148,340,080 545,263,808 294,675,232 328,180,064 1,316,459,184 2009 140,864,896 542,239,808 293,074,208 214,375,408 1,190,554,320 2010 138,774,864 532,894,976 227,256,352 154,188,416 1,053,114,608 2011 139,375,536 536,427,008 224,895,312 168,336,496 1,069,034,352 2012 140,590,816 544,330,560 224,645,584 183,771,680 1,093,338,640 2013 142,032,624 553,445,696 224,848,624 199,198,288 1,119,525,232 2014 143,613,584 563,051,008 225,269,536 214,189,008 1,146,123,136 2015 145,446,768 572,906,560 225,975,712 229,457,504 1,173,786,544 2016 147,355,168 582,655,424 226,901,456 244,527,632 1,201,439,680 2017 149,325,808 591,877,248 227,814,096 259,532,688 1,228,549,840 2018 151,285,296 600,795,840 228,897,280 274,337,600 1,255,316,016 2019 153,291,296 609,489,408 230,016,928 289,077,664 1,281,875,296 2020 155,308,976 618,106,496 230,633,456 303,619,168 1,307,668,096 2021 157,359,856 626,596,096 231,435,584 317,851,936 1,333,243,472 2022 159,475,952 635,045,376 232,472,112 332,855,424 1,359,848,864 2023 161,575,216 643,544,640 233,734,752 347,976,256 1,386,830,864 2024 163,673,440 652,004,608 234,986,256 362,920,320 1,413,584,624 2025 165,749,440 660,068,736 236,184,048 377,630,656 1,439,632,880 2026 167,827,552 668,011,776 237,407,552 392,349,440 1,465,596,320 2027 169,895,408 675,783,872 238,631,040 407,037,472 1,491,347,792 2028 171,922,160 683,549,824 239,610,928 421,617,248 1,516,700,160 2029 173,954,928 691,407,808 240,645,296 436,157,504 1,542,165,536 2030 175,887,376 698,939,520 241,546,176 450,398,912 1,566,771,984 Rates 1.19% 1.37% 0.31% 5.51% 2.01%
19 Table 11 Worship Attendance
Projection II
The resulting decline in worship attendance is even steeper in spite of doubling the number of new church starts. As a comparison, a new column labeled “Total adjusted” is included to reflect the result as if the pattern of new church starts mirrors that of Projection I. With fewer new church starts, the rate of decline in worship attendance reaches 1.00% compared to 0.80%. Notice that the stronger anti-church theme alone increases the rate of decline from 0.61% to 1.00%--all else being equal. The stronger anti-church theme in this projection clearly made its mark. The increase in new church starts partially mitigated its impact.
Group 1 Group 2 Group 3 Total Total adjusted 2010 2,975,328 85,039 5,816 3,066,183 3,063,275 2011 2,913,259 86,274 10,396 3,009,929 3,004,731 2012 2,879,653 87,840 19,432 2,986,925 2,977,209 2013 2,849,150 87,869 28,978 2,965,997 2,951,508 2014 2,817,437 89,856 37,604 2,944,897 2,926,095 2015 2,784,161 91,139 45,992 2,921,292 2,898,296 2016 2,749,020 91,976 55,672 2,896,668 2,868,832 2017 2,711,619 93,160 64,064 2,868,843 2,836,811 2018 2,673,596 93,360 74,992 2,841,948 2,804,452 2019 2,636,335 94,402 87,808 2,818,545 2,774,641 2020 2,599,942 97,559 94,688 2,792,189 2,744,845 2021 2,565,139 99,197 106,742 2,771,078 2,717,707 2022 2,531,525 100,627 121,124 2,753,276 2,692,714 2023 2,499,724 102,259 135,216 2,737,199 2,669,591 2024 2,468,802 103,231 150,060 2,722,093 2,647,063 2025 2,438,054 102,251 160,786 2,701,091 2,620,698 2026 2,406,344 103,975 174,906 2,685,225 2,597,772 2027 2,376,049 105,087 184,104 2,665,240 2,573,188 2028 2,345,125 107,583 191,344 2,644,052 2,548,380 2029 2,316,271 110,503 200,292 2,627,066 2,526,920 2030 2,287,612 112,814 212,692 2,613,118 2,506,772 Rates -1.31% 1.42% 19.72% -0.80% -1.00%
20 Church Closures
Projection II
Church closures increased from 7,656 to 10,504 in response to a stronger anti-church theme and twice the number of new church starts. The increase in new church starts had little effect since there are relatively few church closures among new church starts. The projected closures represent 30.2% of all churches—old and new.
Group 1 Group 2 Group 3 Total
2010 391 7 0 398 2011 397 12 0 409 2012 345 13 0 358 2013 398 5 4 405 2014 449 8 2 458 2015 504 9 8 517 2016 463 9 6 475 2017 559 12 16 579 2018 496 7 4 505 2019 519 7 4 528 2020 547 5 10 557 2021 537 5 8 546 2022 582 6 6 591 2023 593 10 8 607 2024 561 8 16 577 2025 578 4 10 587 2026 509 8 14 524 2027 468 6 16 482 2028 494 7 18 510 2029 434 3 10 442 2030 440 4 10 449 Total 10,264 155 170 10,504
21 Table 13
Number of Elder Appointments Projection II
The number of elder appointments in the local church decreases at a faster pace than in Projection I (1.15%). The additional new church starts add only another 310 elder appointments by 2030. The total loss of elder appointments by 2030 equals 2,537. This represents the loss of an additional 135 elder appointments.
Projection III
The third projection is based upon the following assumptions:
1. Growth in local church spending among Group 1 churches reflects an increased spending level among all components. These rates are not unreasonable in that they are quite similar to the rates recorded over the 1990-2005 period which excludes the recent recession. Average annual growth rates are as follows:
Group1 Group 2 Group 3 Total
2010 11,269 310 40 11,619 2011 11,146 305 54 11,505 2012 10,891 292 112 11,295 2013 10,757 280 138 11,175 2014 10,562 277 184 11,023 2015 10,403 258 196 10,857 2016 10,240 270 244 10,754 2017 10,023 253 264 10,540 2018 9,966 252 300 10,518 2019 9,714 239 330 10,283 2020 9,543 237 362 10,142 2021 9,482 239 394 10,115 2022 9,276 238 430 9,944 2023 9,061 237 464 9,762 2024 8,969 245 506 9,720 2025 8,841 241 522 9,604 2026 8,741 249 564 9,554 2027 8,659 244 586 9,489 2028 8556 248 590 9,394 2029 8385 248 602 9,235 2030 8218 244 620 9,082 -1.57% -1.19% 14.69% -1.22% Net Loss 3,051 2,537
22 Non-clergy Staff Compensation: 2.80% Facilities Expenditures: Savings: 1.87% Facilities Expenditures: Loans 5.55%
2. New church starts are based upon historical patterns—similar to those in Projection I. 3. The anti-church theme is assumed to be significantly stronger as time passes—the same as in Projection II.
Table 14
Projected Spending Patterns Adjusted for Inflation
Projection III
Programs Staff Savings Loans Total
2008 148,340,080 545,263,808 294,675,232 328,180,064 1,316,459,184 2009 140,864,896 542,239,808 293,074,208 214,375,408 1,190,554,320 2010 138,774,864 532,894,976 227,256,352 154,188,416 1,053,114,608 2011 140,616,352 558,096,128 225,228,688 168,336,496 1,092,277,664 2012 143,404,976 584,438,080 228,337,936 184,218,240 1,140,399,232 2013 146,700,880 609,122,880 232,928,816 200,079,584 1,188,832,160 2014 150,285,072 632,366,336 238,136,544 215,460,272 1,236,248,224 2015 154,203,056 654,357,760 243,928,352 231,053,824 1,283,542,992 2016 158,259,232 675,142,464 250,047,248 246,446,016 1,329,894,960 2017 162,412,432 694,616,768 256,071,232 261,740,736 1,374,841,168 2018 166,575,968 713,062,912 262,317,648 276,805,952 1,418,762,480 2019 170,707,264 730,880,512 268,493,056 291,748,032 1,461,828,864 2020 174,823,968 748,459,648 274,097,472 306,442,976 1,503,824,064 2021 178,978,000 765,672,384 279,938,496 320,818,528 1,545,407,408 2022 183,177,776 783,073,152 285,826,560 335,877,472 1,587,954,960 2023 187,300,448 800,741,312 291,779,168 351,095,008 1,630,915,936 2024 191,388,928 818,804,736 297,629,152 366,194,048 1,674,016,864 2025 195,460,944 836,544,000 303,339,744 381,084,800 1,716,429,488 2026 199,494,784 854,327,360 308,897,888 395,955,424 1,758,675,456 2027 203,469,376 872,340,352 314,301,856 410,744,544 1,800,856,128 2028 207,386,064 890,168,320 319,483,040 425,477,536 1,842,514,960 2029 211,280,816 908,457,216 324,532,992 440,210,304 1,884,481,328 2030 215,047,328 926,568,576 329,447,808 454,543,840 1,925,607,552 Rates 2.21% 2.80% 1.87% 5.55% 3.06%
23
The increased levels of spending among the listed components are quite evident. Total spending among these components average an annual rate of increase of 3.06% (adjusted for inflation).
Table 15 Worship Attendance
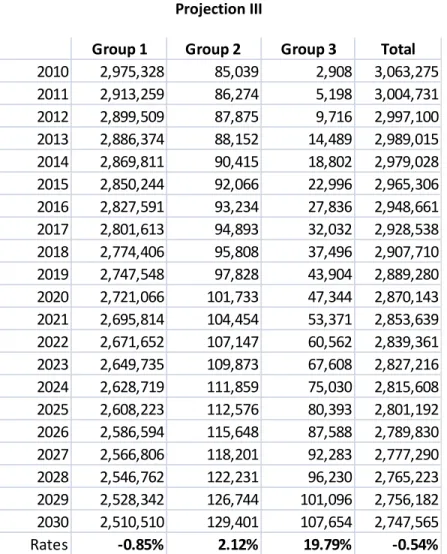
Projection III
Worship attendance is projected to decrease at an annual rate of 0.54%. This is the slowest rate projected thus far. This projection indicates that enhanced local church spending among the listed components can significantly reduce the rate of decline in the church. The increased spending among local churches would have a greater effect in mitigating the effects of the anti-church theme than would doubling the number of new church starts.
Group 1 Group 2 Group 3 Total
2010 2,975,328 85,039 2,908 3,063,275 2011 2,913,259 86,274 5,198 3,004,731 2012 2,899,509 87,875 9,716 2,997,100 2013 2,886,374 88,152 14,489 2,989,015 2014 2,869,811 90,415 18,802 2,979,028 2015 2,850,244 92,066 22,996 2,965,306 2016 2,827,591 93,234 27,836 2,948,661 2017 2,801,613 94,893 32,032 2,928,538 2018 2,774,406 95,808 37,496 2,907,710 2019 2,747,548 97,828 43,904 2,889,280 2020 2,721,066 101,733 47,344 2,870,143 2021 2,695,814 104,454 53,371 2,853,639 2022 2,671,652 107,147 60,562 2,839,361 2023 2,649,735 109,873 67,608 2,827,216 2024 2,628,719 111,859 75,030 2,815,608 2025 2,608,223 112,576 80,393 2,801,192 2026 2,586,594 115,648 87,588 2,789,830 2027 2,566,806 118,201 92,283 2,777,290 2028 2,546,762 122,231 96,230 2,765,223 2029 2,528,342 126,744 101,096 2,756,182 2030 2,510,510 129,401 107,654 2,747,565 Rates -0.85% 2.12% 19.79% -0.54%
24 Church Closures
Projection III
With the increased local church spending, church closures are only slightly reduced—from 10,504 to 10,452. This conforms to the results from previous studies that closures occur among Tier 1 churches and that increased spending among Tier 1 churches have smaller effects on worship attendance.
Group 1 Group 2 Group 3 Total
2010 390 7 0 397 2011 397 12 0 409 2012 348 13 0 361 2013 399 5 2 406 2014 456 8 1 465 2015 495 9 4 508 2016 452 9 3 464 2017 565 12 8 585 2018 498 7 2 507 2019 507 7 2 516 2020 539 5 5 549 2021 545 5 4 554 2022 586 6 3 595 2023 573 10 4 587 2024 553 9 8 570 2025 571 3 5 579 2026 520 8 7 535 2027 461 5 8 474 2028 478 8 9 495 2029 438 3 5 446 2030 440 4 5 449 Total 10,212 155 85 10,452
25 Table 17
Number of Elder Appointments Projection III
The number of elder appointments changes little from Projection II (2,579 versus 2,537). The loss of elder appointments in Group 1 is reduced, but the smaller number of new church starts virtually offsets the smaller reduction. In total, there is a 2,579 predicted loss of elder appointments—an annual rate of decrease of 1.24%.
Projection IV
The fourth projection is based upon the following assumptions:
1. Growth in local church spending among Group 1 churches is assumed to slow considerably. This might occur if either the economy never returns to normal growth rates or other financial demands upon the local church limit growth in spending among these listed components. This might occur if local churches face substantial increases in costs of pastor compensation (health benefits and pensions) and/or substantial increases in apportionments. Average annual growth rates are as follows:
Group1 Group 2 Group 3 Total
2010 11,357 302 16 11,675 2011 11,152 291 28 11,471 2012 10,937 292 48 11,277 2013 10,864 286 75 11,225 2014 10,544 283 86 10,913 2015 10,431 265 97 10,793 2016 10,371 260 126 10,757 2017 9,986 245 132 10,363 2018 10,084 258 152 10,494 2019 9,879 256 168 10,303 2020 9,783 250 189 10,222 2021 9,687 246 203 10,136 2022 9,576 233 220 10,029 2023 9,395 243 224 9,862 2024 9,250 243 238 9,731 2025 9,155 250 250 9,655 2026 9,066 251 285 9,602 2027 8,959 252 293 9,504 2028 8,889 270 299 9,458 2029 8,795 265 312 9,372 2030 8,531 259 306 9,096 -1.42% -0.77% 15.90% -1.24% Net Loss 2,826 2,579
26 Non-clergy Staff Compensation: 0.95% Facilities Expenditures: Savings: -0.12% Facilities Expenditures: Loans 3.39%
2. New church starts are based upon historical patterns—similar to those in Projection I. 3. The anti-church theme is assumed to be significantly stronger as time passes—the same as in Projection II and Projection III.
Table 18
Projected Spending Patterns Adjusted for Inflation
Projection IV
Programs Staff Savings Loans Total
2008 148,340,080 545,263,808 294,675,232 328,180,064 1,316,459,184 2009 140,864,896 542,239,808 293,074,208 214,375,408 1,190,554,320 2010 138,774,864 532,894,976 227,256,352 154,188,416 1,053,114,608 2011 138,972,896 533,468,928 225,140,768 160,704,032 1,058,286,624 2012 139,723,040 538,432,832 224,626,624 168,463,520 1,071,246,016 2013 140,646,992 544,608,576 224,302,240 176,227,216 1,085,785,024 2014 141,656,960 551,278,464 223,977,008 183,599,648 1,100,512,080 2015 142,861,616 558,299,648 223,780,432 191,261,200 1,116,202,896 2016 144,122,736 565,095,552 223,714,320 198,740,672 1,131,673,280 2017 145,418,352 571,477,120 223,565,072 206,152,800 1,146,613,344 2018 146,701,488 577,644,416 223,530,352 213,434,288 1,161,310,544 2019 148,014,192 583,624,256 223,527,888 220,622,032 1,175,788,368 2020 149,337,472 589,514,304 223,026,768 227,599,840 1,189,478,384 2021 150,676,912 595,237,504 222,634,352 234,349,696 1,202,898,464 2022 152,090,656 601,011,328 222,427,712 241,827,856 1,217,357,552 2023 153,500,496 606,835,584 222,446,656 249,466,416 1,232,249,152 2024 154,909,808 612,638,144 222,498,224 257,007,168 1,247,053,344 2025 156,329,728 618,091,584 222,482,480 264,356,960 1,261,260,752 2026 157,756,640 623,431,936 222,446,144 271,701,056 1,275,335,776 2027 159,160,944 628,672,960 222,408,848 278,970,080 1,289,212,832 2028 160,516,400 633,891,904 222,190,144 286,264,160 1,302,862,608 2029 161,905,216 639,110,400 222,036,928 293,499,872 1,316,552,416 2030 163,214,016 644,005,440 221,712,432 300,624,352 1,329,556,240 0.81% 0.95% -0.12% 3.39% 1.17%
27
The reduced levels of spending among the listed components are apparent when comparing the 2030 total level of $1.3 billion versus the $1.9 billion in Projection III. Notice that spending on facilities from savings actually decreases over the period.
Table 19 Worship Attendance
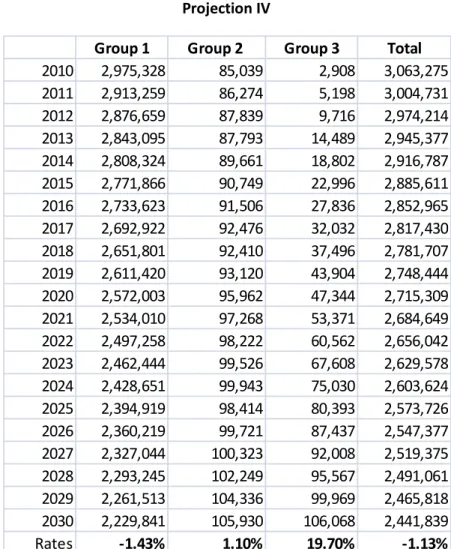
Projection IV
Worship attendance is projected to decrease at an annual rate of 1.13%. This is the fastest rate
projected thus far. The more rapid rate of decrease is caused by a strong anti-church theme, a reduced growth in local church spending among the listed components, and a duplication of historical patterns of new church starts. This is a rate of decline that cannot persist for long.
Group 1 Group 2 Group 3 Total
2010 2,975,328 85,039 2,908 3,063,275 2011 2,913,259 86,274 5,198 3,004,731 2012 2,876,659 87,839 9,716 2,974,214 2013 2,843,095 87,793 14,489 2,945,377 2014 2,808,324 89,661 18,802 2,916,787 2015 2,771,866 90,749 22,996 2,885,611 2016 2,733,623 91,506 27,836 2,852,965 2017 2,692,922 92,476 32,032 2,817,430 2018 2,651,801 92,410 37,496 2,781,707 2019 2,611,420 93,120 43,904 2,748,444 2020 2,572,003 95,962 47,344 2,715,309 2021 2,534,010 97,268 53,371 2,684,649 2022 2,497,258 98,222 60,562 2,656,042 2023 2,462,444 99,526 67,608 2,629,578 2024 2,428,651 99,943 75,030 2,603,624 2025 2,394,919 98,414 80,393 2,573,726 2026 2,360,219 99,721 87,437 2,547,377 2027 2,327,044 100,323 92,008 2,519,375 2028 2,293,245 102,249 95,567 2,491,061 2029 2,261,513 104,336 99,969 2,465,818 2030 2,229,841 105,930 106,068 2,441,839 Rates -1.43% 1.10% 19.70% -1.13%
28 Church Closures
Projection IV
Church closures reach its peak with 10, 513 closures by 2030. Notice that there is a projected 155 closures in Group 2 churches. There were only 632 churches in this group in 2009 which means of loss of 24.5% of these churches. Recall these churches were new church starts between 1990 and 2009.
Group 1 Group 2 Group 3 Total
2010 391 7 0 398 2011 397 12 0 409 2012 343 13 0 356 2013 401 5 2 408 2014 445 8 1 454 2015 506 9 4 519 2016 462 9 3 474 2017 561 12 8 581 2018 491 7 2 500 2019 518 7 2 527 2020 549 5 5 559 2021 544 5 4 553 2022 582 6 3 591 2023 594 10 4 608 2024 550 9 8 567 2025 581 3 5 589 2026 513 8 7 528 2027 466 6 8 480 2028 499 7 9 515 2029 436 3 5 444 2030 444 4 5 453 Total 10,273 155 85 10,513
29 Table 21
Number of Elder Appointments Projection IV
The number of elder appointments decreases to new low of 8,660. The annual rate of decline in elder appointments is 1.45%. The loss of 2,943 elders represents a 25.4% decrease in elder appointments between 2010 and 2030. This loss would have substantial consequences, particularly in clergy recruitment as will be discussed later in this report.
Projection V
The fifth projection is based upon the following assumptions:
1. Growth in local church spending among Group 1 churches is assumed to increase significantly. This would occur if there were significant encouragements for growth among churches among Tiers 3 through 6 and an easing of the financial pressures on the local church from costs of clergy benefits
Group1 Group 2 Group 3 Total
2010 11,289 299 15 11,603 2011 11,212 293 27 11,532 2012 10,845 293 52 11,190 2013 10,741 289 69 11,099 2014 10,526 290 90 10,906 2015 10,360 270 101 10,731 2016 10,157 261 131 10,549 2017 10,046 252 137 10,435 2018 9,880 256 137 10,273 2019 9,754 236 158 10,148 2020 9,540 247 182 9,969 2021 9,460 246 200 9,906 2022 9,265 233 216 9,714 2023 9,084 237 231 9,552 2024 8,845 241 244 9,330 2025 8,788 229 269 9,286 2026 8,724 233 283 9,240 2027 8,491 237 282 9,010 2028 8,425 243 306 8,974 2029 8,308 238 313 8,859 2030 8,108 236 316 8,660 -1.64% -1.18% 16.46% -1.45% Net Loss 3,181 2,943
30
sustained economic growth. Average annual growth rates are as follows: Program Expenditures: 3.47%
Non-clergy Staff Compensation: 3.17% Facilities Expenditures: Savings: 2.75% Facilities Expenditures: Loans 8.20%
2. New church starts are based upon historical patterns—similar to those in Projection I. 3. The anti-church theme is assumed to be significantly stronger as time passes—the same as in Projection II, Projection III, and Projection IV.
31 Table 22
Projected Spending Patterns Adjusted for Inflation
Projection V
The increased spending levels are significant. Spending on facilities from loans reach $745.2 million by 2030. This would require considerable confidence on the part of church leaders in assuming these levels of church debt. This is not unprecedented in our church history. Between 1998 and 2008, local church debt related to facilities increased 60%--a period of ten years. The 2030 level in this projection is only 130% of the level recorded in 2008—a period of twenty-two years. These spending levels, however, would require extra-ordinary courage and foresight.
Programs Staff Savings Loans Total
1990 2008 148,340,080 545,263,808 294,675,232 328,180,064 1,316,459,184 1991 2009 140,864,896 542,239,808 293,074,208 214,375,408 1,190,554,320 1992 2010 138,774,864 532,894,976 227,256,352 154,188,416 1,053,114,608 1993 2011 142,808,832 563,967,488 226,424,704 183,589,856 1,116,790,880 1994 2012 148,532,992 594,754,240 232,888,960 214,840,928 1,191,017,120 1995 2013 155,127,744 623,147,200 241,339,776 245,943,152 1,265,557,872 1996 2014 162,202,080 649,410,688 250,553,840 276,506,944 1,338,673,552 1997 2015 169,671,392 674,197,504 260,224,848 307,295,424 1,411,389,168 1998 2016 177,244,752 697,638,208 270,161,312 337,894,464 1,482,938,736 1999 2017 184,849,008 719,722,112 280,039,808 368,264,160 1,552,875,088 2000 2018 192,362,224 740,821,632 289,973,184 398,335,488 1,621,492,528 2001 2019 199,767,488 761,397,504 299,613,152 428,340,384 1,689,118,528 2002 2020 207,083,936 781,802,368 308,542,464 457,922,272 1,755,351,040 2003 2021 214,271,056 801,969,728 317,521,248 487,177,440 1,820,939,472 2004 2022 221,435,168 822,415,552 326,456,800 516,774,496 1,887,082,016 2005 2023 228,500,320 843,226,816 335,385,184 546,330,816 1,953,443,136 2006 2024 235,485,088 864,583,040 344,160,032 575,687,552 2,019,915,712 2007 2025 242,348,928 885,693,632 352,678,016 604,638,464 2,085,359,040 2008 2026 249,086,688 906,999,296 360,834,912 633,324,672 2,150,245,568 2009 2027 255,689,936 928,588,736 368,822,720 661,808,896 2,214,910,288 2010 2028 262,167,504 950,134,720 376,450,176 689,909,888 2,278,662,288 2011 2029 268,570,560 972,531,328 383,940,960 717,881,984 2,342,924,832 2012 2030 274,781,568 995,128,320 391,166,688 745,222,080 2,406,298,656 Rates 3.47% 3.17% 2.75% 8.20% 4.22%
32
Worship Attendance Projection V
Worship attendance is projected to decrease at its smallest annual rate thus far—0.34%. Recall that this is accomplished with historical patterns of new church starts. The significant improvements come from existing churches through increased spending.
Group 1 Group 2 Group 3 Total
2010 2,975,328 85,039 2,908 3,063,275 2011 2,913,259 86,274 5,198 3,004,731 2012 2,906,505 87,888 9,716 3,004,109 2013 2,900,050 88,409 14,489 3,002,948 2014 2,889,927 90,980 18,802 2,999,709 2015 2,876,469 92,715 22,996 2,992,180 2016 2,859,658 94,072 27,836 2,981,566 2017 2,839,602 96,001 32,032 2,967,635 2018 2,818,019 97,124 37,496 2,952,639 2019 2,796,803 99,313 43,904 2,940,020 2020 2,775,979 103,404 47,344 2,926,727 2021 2,756,150 106,202 53,371 2,915,723 2022 2,737,726 109,040 60,562 2,907,328 2023 2,721,203 111,789 67,608 2,900,600 2024 2,705,706 114,132 75,030 2,894,868 2025 2,690,962 115,254 80,393 2,886,609 2026 2,674,969 118,627 87,645 2,881,241 2027 2,660,654 121,470 92,407 2,874,531 2028 2,646,062 125,761 96,489 2,868,312 2029 2,633,501 130,577 101,517 2,865,595 2030 2,621,348 133,497 108,264 2,863,109 Rates -0.63% 2.28% 19.82% -0.34%
33 Table 24 Church Closures
Projection V
Church closures in this projection are not that different than that of Projection IV (10,431 versus 10,513). This is explained by the fact that increased spending among Tier 1 churches has a smaller impact upon worship attendance, and Tier 1 churches suffer greatly from the anti-church theme.
Group 1 Group 2 Group 3 Total
2010 390 7 0 397 2011 397 12 0 409 2012 354 13 0 367 2013 398 5 2 405 2014 454 8 1 463 2015 490 9 4 503 2016 453 9 3 465 2017 553 12 8 573 2018 500 7 2 509 2019 502 7 2 511 2020 540 5 5 550 2021 556 5 4 565 2022 566 6 3 575 2023 580 11 4 595 2024 561 9 8 578 2025 561 3 5 569 2026 512 8 7 527 2027 470 5 8 483 2028 486 8 9 503 2029 420 3 5 428 2030 447 4 5 456 Total 10,190 156 85 10,431
34
Number of Elder Appointments Projection V
The decrease in the number of elder appointments is much less than that of Projection IV (2,184 versus 2,943). This does, however, represent a decrease in the number of elder appointments of 18.8% between 2010 and 2030.
Projection VI
The sixth projection is based upon the following assumptions:
1. Growth in local church spending among Group 1 churches is assumed to increase significantly— similar to the spending patterns of Projection V. Again, this would occur if there were significant
Group1 Group 2 Group 3 Total
2010 11,280 302 15 11,597 2011 11,179 311 30 11,520 2012 10,874 291 56 11,221 2013 10,859 283 71 11,213 2014 10,572 268 91 10,931 2015 10,513 269 105 10,887 2016 10,367 250 126 10,743 2017 10,233 260 133 10,626 2018 10,109 247 148 10,504 2019 9,990 244 163 10,397 2020 9,878 255 186 10,319 2021 9,774 249 198 10,221 2022 9,693 248 224 10,165 2023 9,524 254 223 10,001 2024 9,476 244 242 9,962 2025 9,347 250 266 9,863 2026 9,269 249 282 9,800 2027 9,137 260 297 9,694 2028 9,038 261 289 9,588 2029 8,935 267 311 9,513 2030 8,840 251 322 9,413 -1.21% -0.92% 16.57% -1.04% Loss 2,440 2,184
35
encouragements for growth among churches among Tiers 3 through 6 and an easing of the financial pressures on the local church from costs of clergy benefits (health and pensions) and from
apportionments. Average annual growth rates are as follows: Program Expenditures: 3.59% Non-clergy Staff Compensation: 3.37% Facilities Expenditures: Savings: 2.93% Facilities Expenditures: Loans 8.23%
2. New church starts are based upon historical patterns—similar to those in Projection I.
3. The anti-church theme is assumed to be only 50% stronger than that observed between 2002 and 2009. This is similar to Projection I—a much weaker theme than that assumed in Projections II, III, IV, and V.
36
Projected Spending Patterns Adjusted for Inflation
Projection VI
The increased spending levels are significant--slightly greater that spending growth in Projection V due to the smaller number of church closures as discussed below.
Programs Staff Savings Loans Total
2008 148,340,080 545,263,808 294,675,232 328,180,064 1,316,459,184 2009 140,864,896 542,239,808 293,074,208 214,375,408 1,190,554,320 2010 138,791,584 533,031,712 227,383,328 154,276,928 1,053,483,552 2011 142,861,504 564,488,896 226,707,712 183,782,640 1,117,840,752 2012 148,642,128 595,859,520 233,364,096 215,148,208 1,193,013,952 2013 155,319,280 625,034,944 242,040,592 246,388,336 1,268,783,152 2014 162,495,776 652,288,000 251,538,304 277,089,536 1,343,411,616 2015 170,101,616 678,244,992 261,526,752 308,067,488 1,417,940,848 2016 177,845,648 703,032,896 271,838,048 338,824,896 1,491,541,488 2017 185,650,944 726,673,600 282,138,208 369,411,520 1,563,874,272 2018 193,412,656 749,478,272 292,552,544 399,687,552 1,635,131,024 2019 201,119,984 771,965,760 302,911,232 429,980,800 1,705,977,776 2020 208,765,136 794,437,184 312,551,232 459,909,504 1,775,663,056 2021 216,343,952 816,806,400 322,211,232 489,497,376 1,844,858,960 2022 223,850,752 839,557,312 331,674,400 518,904,096 1,913,986,560 2023 231,329,456 862,840,640 341,429,216 548,728,704 1,984,328,016 2024 238,756,416 886,772,544 351,105,376 578,387,264 2,055,021,600 2025 246,099,456 910,669,696 360,578,784 607,842,816 2,125,190,752 2026 253,312,336 934,875,136 369,792,384 636,955,392 2,194,935,248 2027 260,427,792 959,598,976 378,794,624 665,828,160 2,264,649,552 2028 267,476,624 984,490,624 387,578,848 694,399,936 2,333,946,032 2029 274,452,384 1,010,320,576 396,299,872 722,880,704 2,403,953,536 2030 281,241,248 1,036,371,264 404,795,936 750,919,104 2,473,327,552 Rates 3.59% 3.38% 2.93% 8.23% 4.36%
37 Table 27 Worship Attendance
Projection VI
Worship attendance is projected to increase between 2010 and 2030. This represents a turnaround in the denomination in the US. The decrease in worship attendance among Group 1 churches is fully compensated by growth in Groups 2 and 3. Recall that the new church starts are similar in number as those observed historically. The key to this projection of growth is strong increases in spending and only a 50% increase in the anti-church theme by 2030. Had the projection included a doubling of new church starts, worship attendance would have increased at an annual rate of 0.21%.
Group 1 Group 2 Group 3 Total
2010 2,986,538 85,039 2,908 3,074,485 2011 2,935,833 86,284 5,198 3,027,315 2012 2,940,634 87,917 9,716 3,038,267 2013 2,946,055 88,474 14,489 3,049,018 2014 2,947,635 91,090 18,802 3,057,527 2015 2,946,076 92,871 22,996 3,061,943 2016 2,940,765 94,314 27,836 3,062,915 2017 2,932,688 96,321 32,032 3,061,041 2018 2,923,139 97,516 37,496 3,058,151 2019 2,913,109 99,803 43,904 3,056,816 2020 2,903,742 103,987 47,344 3,055,073 2021 2,895,519 106,897 53,371 3,055,787 2022 2,888,131 109,831 60,562 3,058,524 2023 2,882,647 112,737 67,608 3,062,992 2024 2,877,573 115,204 75,030 3,067,807 2025 2,873,348 116,473 80,403 3,070,224 2026 2,867,778 120,013 87,671 3,075,462 2027 2,863,523 122,990 92,462 3,078,975 2028 2,859,424 127,481 96,585 3,083,490 2029 2,856,623 132,441 101,664 3,090,728 2030 2,854,355 135,491 108,469 3,098,315 Rates -0.23% 2.36% 19.84% 0.04%
38 Church Closures
Projection VI
Church closures in this projection represent the smallest among all the projections thus far—7,586. Note that even with increases in worship attendance there will be significant numbers of church
closures. This is true because the increase in worship attendance occurs mostly among Tier 5 and Tier 6 churches. Decreases are projected for Tiers 1 (-3.13%) and Tier 2 (-0.92%). Tier 6 churches are
projected to grow at an average annual rate of 1.72%.
Group 1 Group 2 Group 3 Total
2010 271 7 0 278 2011 352 12 0 364 2012 243 13 0 256 2013 245 5 2 252 2014 357 7 1 365 2015 306 9 4 319 2016 351 7 3 361 2017 372 11 8 391 2018 337 8 2 347 2019 375 8 2 385 2020 374 6 5 385 2021 369 5 4 378 2022 378 5 3 386 2023 423 9 4 436 2024 447 8 8 463 2025 438 4 5 447 2026 371 4 7 382 2027 356 5 8 369 2028 331 2 9 342 2029 336 2 5 343 2030 328 4 5 337 Total 7,360 141 85 7,586
39 Table 29
Number of Elder Appointments Projection VI
The decrease in the number of elder appointments is considerably less than those among all other projections with strong anti-church theme. The increased spending in this projection leads to a smaller loss of elder appointments than in Projection I (1,680 versus 2,402). The loss of elder positions
represents a decrease of only 14.4% by 2030. Note that there is a projected loss of elder appointments in spite of growth in worship attendance. This fact follows from decreases in worship attendance among Tier 2 churches.
Projection VII
The seventh projection is based upon the following assumptions:
1. Growth in local church spending among Group 1 churches is assumed to increase significantly— similar to the spending patterns of Projection III but less than that in Projections V and VI. These increases are quite reasonable, absent another severe recession between 2012 and 2030. The
Group1 Group 2 Group 3 Total
2010 11,338 300 17 11,655 2011 11,181 298 28 11,507 2012 11,011 293 50 11,354 2013 10,918 285 79 11,282 2014 10,781 284 92 11,157 2015 10,613 257 103 10,973 2016 10,585 264 123 10,972 2017 10,460 252 138 10,850 2018 10,422 257 148 10,827 2019 10,350 250 167 10,767 2020 10,184 257 182 10,623 2021 10,195 234 203 10,632 2022 10,150 256 217 10,623 2023 9,950 254 229 10,433 2024 9,888 251 246 10,385 2025 9,850 252 262 10,364 2026 9,691 256 282 10,229 2027 9,761 266 291 10,318 2028 9,593 273 291 10,157 2029 9,488 269 313 10,070 2030 9,391 267 317 9,975 -0.94% -0.58% 15.75% -0.78% Loss 1,947 1,680
40 Average annual growth rates are as follows:
Program Expenditures: 2.32% Non-clergy Staff Compensation: 3.01% Facilities Expenditures: Savings: 2.04% Facilities Expenditures: Loans 5.59%
2. New church starts are based upon historical patterns—similar to those in Projection I.
3. The anti-church theme is assumed to reach twice the strength observed between 2002 and 2009 by 2030. This is similar to Projections I and VI but not as strong as assumed in the other projections.
41 Table 30
Projected Spending Patterns Adjusted for Inflation
Projection VII
Increased spending levels on facilities from debt are about 40% greater than levels observed in 2008. The growth rates in all other spending components are quite reasonable.
Programs Staff Savings Loans Total
2008 148,340,080 545,263,808 294,675,232 328,180,064 1,316,459,184 2009 140,864,896 542,239,808 293,074,208 214,375,408 1,190,554,320 2010 138,791,584 533,031,712 227,383,328 154,276,928 1,053,483,552 2011 140,665,600 558,577,216 225,509,184 168,529,008 1,093,281,008 2012 143,500,336 585,423,360 228,806,304 184,518,720 1,142,248,720 2013 146,862,736 610,796,032 233,605,808 200,515,824 1,191,780,400 2014 150,526,016 634,872,384 239,067,232 216,033,936 1,240,499,568 2015 154,540,336 657,884,032 245,139,392 231,780,272 1,289,344,032 2016 158,716,880 679,890,048 251,576,912 247,330,704 1,337,514,544 2017 163,004,960 700,746,304 257,954,144 262,807,776 1,384,513,184 2018 167,334,384 720,748,160 264,603,824 278,046,400 1,430,732,768 2019 171,671,760 740,259,008 271,325,248 293,230,464 1,476,486,480 2020 176,007,376 759,666,752 277,545,568 308,191,264 1,521,410,960 2021 180,396,240 778,871,680 283,906,304 322,888,736 1,566,062,960 2022 184,802,944 798,343,104 290,207,040 337,647,008 1,611,000,096 2023 189,219,360 818,278,784 296,818,816 352,987,936 1,657,304,896 2024 193,625,424 838,707,072 303,393,600 368,292,096 1,704,018,192 2025 198,026,992 859,017,728 309,837,024 383,495,520 1,750,377,264 2026 202,381,216 879,456,384 316,186,624 398,646,272 1,796,670,496 2027 206,684,256 900,275,840 322,423,840 413,674,848 1,843,058,784 2028 210,945,840 921,174,784 328,512,768 428,702,368 1,889,335,760 2029 215,206,816 942,583,360 334,590,176 443,645,728 1,936,026,080 2030 219,372,016 963,950,208 340,457,632 458,305,056 1,982,084,912 Rates 2.32% 3.01% 2.04% 5.59% 3.21%
42
Worship Attendance Projection VII
Worship attendance is projected to increase between 2010 and 2030. This also represents a turnaround in the denomination in the US—in addition to Projection VI. The key to this projection is a not-so-aggressive growth in the anti-church theme and a steady growth in spending among key components. In this projection, there are to be only 665 new church starts between 2010 and 2030—similar to historic patterns.
Group 1 Group 2 Group 3 Total
2010 2,986,538 85,039 2,908 3,074,485 2011 2,935,833 86,284 5,198 3,027,315 2012 2,940,634 87,904 9,716 3,038,254 2013 2,946,055 88,217 14,489 3,048,761 2014 2,947,635 90,524 18,802 3,056,961 2015 2,946,076 92,224 22,996 3,061,296 2016 2,940,765 93,478 27,836 3,062,079 2017 2,932,688 95,214 32,032 3,059,934 2018 2,923,139 96,203 37,496 3,056,838 2019 2,913,109 98,320 43,904 3,055,333 2020 2,903,742 102,320 47,344 3,053,406 2021 2,895,519 105,154 53,371 3,054,044 2022 2,888,131 107,942 60,562 3,056,635 2023 2,882,647 110,817 67,608 3,061,072 2024 2,877,573 112,962 75,030 3,065,565 2025 2,873,348 113,810 80,403 3,067,561 2026 2,867,778 117,051 87,614 3,072,443 2027 2,863,523 119,755 92,338 3,075,616 2028 2,859,424 123,966 96,328 3,079,718 2029 2,856,623 128,621 101,247 3,086,491 2030 2,854,355 131,408 107,866 3,093,629 Rates -0.23% 2.20% 19.80% 0.03%
43 Table 32 Church Closures
Projection VII
Church closures in this projection represent one of the smallest among all the projections—7,620.
Group 1 Group 2 Group 3 Total
2010 271 7 0 278 2011 352 12 0 364 2012 237 13 0 250 2013 248 5 2 255 2014 355 7 1 363 2015 304 9 4 317 2016 358 7 3 368 2017 368 11 8 387 2018 348 8 2 358 2019 378 8 2 388 2020 382 6 5 393 2021 366 5 4 375 2022 381 5 3 389 2023 446 9 4 459 2024 426 6 8 440 2025 437 5 5 447 2026 367 4 7 378 2027 357 5 8 370 2028 337 3 9 349 2029 346 2 5 353 2030 330 4 5 339 Total 7,394 141 85 7,620