Title Page
Evaluation of PBIS Implementation in an Urban School District
by
Melissa Renee Friez
B.S. English Literature and Psychology, University of Pittsburgh, 2001 M.S. Ed. Secondary English Education, Duquesne University, 2004
Submitted to the Graduate Faculty of the School of Education in partial fulfillment
of the requirements for the degree of Doctor of Education
University of Pittsburgh 2020
COMMITTEE PAGE
UNIVERSITY OF PITTSBURGH SCHOOL OF EDUCATION
This dissertation was presented by
Melissa Renee Friez
It was defended on March 25, 2020 and approved by
Dr. Jennifer Russell, Associate Professor, LRDC
Dr. R. Gerard Longo, Clinical Associate Professor, Administration and Policy Studies Dr. Charlene Trovato, Clinical Associate Professor, Administration and Policy Studies Dr. Cynthia Tananis, Advisor, Associate Professor, Administration and Policy Studies
Copyright © by Melissa Renee Friez 2020
Abstract
Evaluation of PBIS Implementation in an Urban School District
Melissa Renee Friez, Ed.D University of Pittsburgh, 2020
This study examined the use of a Positive Behavioral Intervention System (PBIS) to promote a positive school culture. PBIS focuses on promoting a positive school culture through behavioral interventions specific to the school, and providing feedback to students to reinforce positive behaviors (Contractor & Staats, 2014). The study focuses on the current implementation and evaluation of PBIS in six schools in a large urban district in Pennsylvania. Secondary data analysis was the methodology used to retrospectively construct a theory of action and a logic model. The logic model was then used to evaluate PBIS implementation related to adequate resources and activities, and to determine if expected outputs/outcomes occurred. Then existing data were used to further evaluate the expected outcomes/outputs aligned to the logic model: three-year trend of school suspensions, three-three-year trend of multidisciplinary referrals, suspension rates and attendance rates; three-year survey results for the survey administered to teachers called the Teaching and Learning Conditions (TLC) Survey and three-year survey results for a survey administered to students called the Tripod Student Perceptions Survey.
Based on the findings of this study, there were three implications. The first implication is that developing and using a theory of action and logic model might assist with implementation of PBIS. The second implication is that collection and use of data are important to guide implementation of PBIS. The third implication is that training and coaching is essential to the implementation of PBIS. There are also three recommendations for practice. The first is to put
setting goals and creating policy, sharing information and accomplishments with the community, and making PBIS a major goal of the school system.
Table of Contents
Preface ... xiii
1.0 Introduction ... 1
1.1 Background ... 1
1.2 Purpose and Setting of the Study ... 2
1.3 Research Questions ... 4
1.4 Significance of the Study ... 4
2.0 Review of Literature ... 5
2.1 What is the School-to-Prison Pipeline? ... 5
2.1.1 Zero Tolerance ... 6
2.2 Trends in School-to-Prison Data ... 9
2.2.1 Impact on Males ... 9
2.2.2 Impact on Females ... 10
2.2.3 Family and Socioeconomic Impact ... 11
2.2.4 Racial Impact ... 12
2.2.5 Mental Health Impact ... 13
2.3 Challenges to Discipline in an Urban Setting ... 14
2.4 Promising Practices for Reducing the School-to-Prison Pipeline ... 16
2.4.1 Multi-Tiered Systems of Support ... 16
2.4.1.1 Positive Behavior Interventions and Support Systems ... 19
2.4.2.2 Stakeholder Support ... 22
2.4.2.3 Funding ... 23
2.4.2.4 Policy and System Alignment ... 23
2.4.2.5 Workforce Capacity, Training, and Coaching... 23
2.4.2.6 Evaluation and Performance Feedback and Behavioral Expertise .. 24
2.4.2.7 Local Implementation Demonstrations ... 25
2.5 Use of Formative Assessment ... 25
2.5.1 Definition of Formative Assessment ... 25
2.5.2 Theory of Action ... 25
2.5.3 Logic Model ... 26
3.0 Methods ... 27
3.1 PBIS in a PA School District ... 27
3.2 Research Questions ... 28
3.3 Description of the Study ... 29
3.4 Setting and Participants ... 29
3.5 Data Collection and Analysis ... 32
3.6 Limitations and Assumptions of the Study ... 42
3.7 Ethical Assurances ... 43
3.8 Preview of Subsequent Chapters ... 43
4.0 Retrospective Theory of Action and Logic Model ... 45
4.1 Research Question 1 ... 45
4.1.1 Establishment of Themes ... 45
4.2 Logic Model and Theory of Action ... 50
4.2.1 Map and Interpret ... 52
4.2.2 Theory of Action ... 53
5.0 Evaluation Findings ... 55
5.1 Adequacy of Resources to Support Implementation (Research Question 2) ... 55
5.1.1 Self-Assessment Survey Findings by School ... 55
5.1.2 Tiered-Fidelity Inventory Findings by School ... 56
5.1.3 Adequacy of Resources Summary Findings ... 58
5.2 Adequacy of Activities to Support Implementation (Research Question 3) ... 61
5.2.1 Self-Assessment Survey Findings by School for Activities ... 62
5.2.2 Tiered-Fidelity Inventory Findings by School for Activities... 64
5.2.3 Adequacy of Activities Summary Findings ... 66
5.3 Expected Outputs/Outcomes Evaluation (Research Question 4) ... 71
5.3.1 Multi-Disciplinary Evaluation Findings ... 72
5.3.2 Multi-Disciplinary Evaluation Summary Findings ... 75
5.3.3 Suspension Rate Findings ... 75
5.3.4 Suspension Data Summary Findings ... 78
5.3.5 Attendance Rate Findings ... 79
5.3.6 Attendance Rate Summary Findings ... 81
5.3.7 Positive School Climate Data for Each Grade Band ... 82
5.3.8 Positive School Culture Summary Data Findings ... 86
5.3.9 Triangulation by School Studied ... 86
6.1 Implications ... 91
6.1.1 Developing and Using a Theory of Action and Logic Model Might Assist with Implementation of PBIS ... 91
6.1.2 Collection and Use of Data Are Important to Guide Implementation of PBIS………..92
6.1.3 Training and Coaching is Important for Implementation of PBIS ... 94
6.1.4 Complexity of PBIS Implementation ... 95
6.2 Recommendations for Practice ... 96
6.2.1 Putting Data into Practice ... 96
6.2.2 Sustaining the Effort ... 99
6.2.3 Inclusion of Stakeholders ... 100
6.3 Limitations of Study ... 100
6.4 Recommendations for Future Study ... 101
Appendix A Approval from District and University to Move Forward with Study ... 103
Appendix B Teaching and Learning Conditions Survey ... 105
Appendix C Tiered Fidelity Inventory Survey and Self-Assessment Survey ... 111
Appendix D Data from Adequacy of Resources... 115
Appendix E Data from Adequacy of Activities ... 118
Appendix F Data from Expected Outputs/Outcomes ... 145
List of Tables
Table 1. School Demographic Data ... 31
Table 2. Theme Organization Chart ... 33
Table 3. School-Wide Systems SAS Resources... 34
Table 4. TFI Resource Questions ... 36
Table 5. School-Wide Systems SAS Activities ... 37
Table 6. Non-Classroom Settings SAS Activities ... 38
Table 7. Classroom Settings SAS Activities ... 38
Table 8. Individual Student Systems SAS Activities... 39
Table 9. TFI Activities ... 39
Table 10. Summary Findings for Research Question 2 ... 58
Table 11. Summary Findings for Research Question 3 ... 67
Table 12. Overall Attendance Rate by School Studied ... 80
Table 13. TLC Average Score for Managing Student Conduct by Grade Band ... 83
Table 14. TLC Average Score for Managing Student Conduct by School Studied ... 83
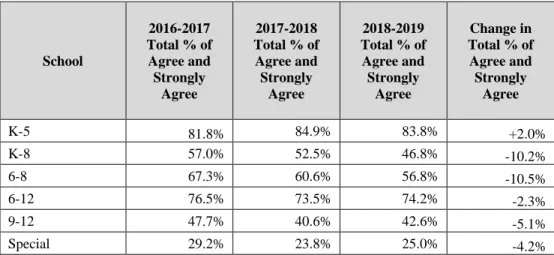
Table 15. Tripod average total % of agree and strongly agree by schools studied ... 85
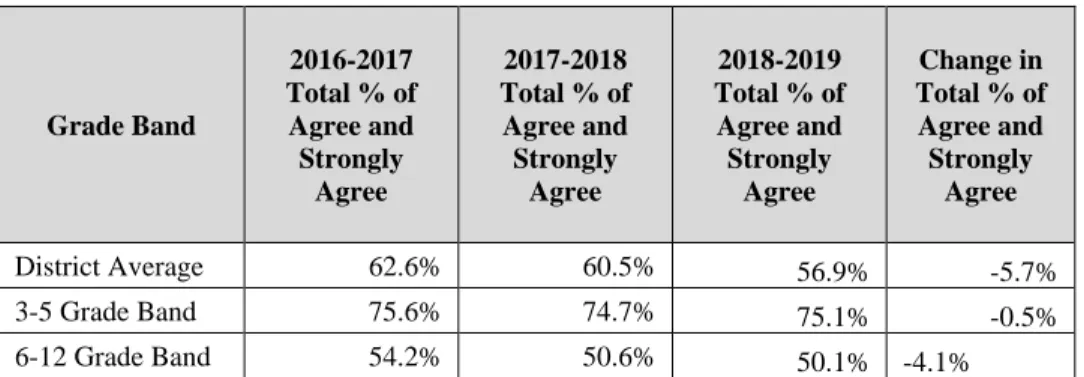
Table 16. Tripod average total % of agree and strongly agree by Grade Band ... 86
Table 17. Summary Findings for Research Question 4 ... 87
Table 18. Tiered Fidelity Inventory Survey Questions... 111
Table 19. Self-Assessment Survey Questions ... 113 Table 20. Tiered-Fidelity Inventory Adequacy of Resources Data Findings by School Studied
Table 21. Self-Assessment Survey Adequacy of Resources Data Findings by School Studied
... 117
Table 22. Tiered-Fidelity Inventory Adequacy of Activities Data Findings by School Studied ... 118
Table 23. Self-Assessment Survey Adequacy of Activities Data Findings by School Studied ... 121
Table 24. 3-Year Trend of Overall MDEs by School Studied... 145
Table 25. 3-Year Trend of MDEs by Gender in Schools Studied ... 145
Table 26. 3-Year Trend of MDEs by Race in Schools Studied ... 146
Table 27. 3-Year Trend of MDE’s by Special Education Status in Schools Studied ... 147
Table 28. 3-Year Trend of Overall Suspensions by Schools Studied ... 147
Table 29. 3-Year Trend of Suspensions by Gender in Schools Studied ... 148
Table 30. 3-Year Trend of Suspensions by Race in Schools Studied ... 150
Table 31. 3-Year Trend of Suspensions by Special Education Status in Schools Studied . 151 Table 32. 3-Year trend of Suspensions by Socioeconomic Status in Schools Studied ... 154
Table 33. 3-Year Overall Attendance Rate by School Studied ... 156
Table 34. 3-Year Trend of Attendance Rate by Gender in Schools Studied ... 157
Table 35. 3-Year Trend of Attendance Rate by Race in Schools Studied ... 158
Table 36. 3-Year Trend of Attendance Rate by Special Education Status in Schools Studied ... 159 Table 37. 3-Year Trend of Attendance Rate by Socioeconomic Status in Schools Studied 160
List of Figures
Figure 1. PBIS Evaluation Logic Model ... 51
Figure 2. PBIS Implementation Theory of Actionate ... 54
Figure 3. 3-Year Trend of Overall MDEs by Schools Studied ... 73
Figure 4. 4-Year Trend of Overall Suspensions by Schools Studied ... 76
Figure 5. 3-year Trend of Female Suspensions by Schools Studied ... 149
Figure 6. 3-year Trend of Male Suspensions by Schools Studied ... 149
Figure 7. 3-Year Trend of IEP Suspensions in Schools Studied ... 152
Figure 8. 3-Year Trend of Gifted Suspensions in Schools Studied... 152
Figure 9. 3-Year Trend of Not IEP or Gifted Suspensions in Schools Studied ... 153
Figure 10. 3-Year Trend Low-Socioeconomic Suspensions by Schools Studied ... 155
Preface
Writing a dissertation not only requires a lot of commitment from the writer, but from their family as well. I would like to thank my husband Brandon and my sons Brandon and Alexander for their constant patience, love and support during this journey. By setting a good example for my children, I hope they too will work to reach their highest potential.
I would like to thank my parents for instilling in me the importance and power of education. Without their constant support, this would not be possible.
To my chair Dr. Cynthia Tananis, thank you for challenging me to become a better learner, thinker and writer. Your time and commitment to seeing me succeed will always hold a special place in my heart.
I will be forever grateful to have started and ended my post-secondary education at the University of Pittsburgh, Hail to Pitt!
1.0Introduction
1.1Background
In the last four decades, there has been an increase in the number of students criminalized in school. The school-to-prison pipeline “refers to the policies and practices that push our nation's school children, especially our most at-risk children, out of classrooms and into the juvenile and criminal justice systems. This pipeline reflects the prioritization of incarceration over education” (ACLU, 2015). In one study, the Council of State Governments found that in the state of Texas almost six in 10 public school students were suspended between their seventh and twelfth grade years of school (Fabelo, Thompson, Plotkin, et al., 2011). Those students suspended or expelled were three times as likely to be a part of the juvenile justice system the next school year (Fabelo, Thompson, Plotkin, et al., 2011). Finally, African-American students had a 31 percent higher likelihood of a disciplinary action at school than white and Hispanic students (Fabelo, Thompson, Plotkin, et al., 2011).
Exclusionary discipline practices are a gateway to the school-to-prison pipeline (Darensbourg, Perez, & Blake, 2010). In the Breaking School Rules Report (2011), it was found that students were more likely to enter the juvenile justice system after being suspended or expelled. The report went on to share that only 3 percent of discipline consequences were for state mandates for disciplinary action; the remaining 97 percent were for discretionary discipline determined by school administrators (Fabelo, Thompson, & Plotkin, et al., 2011).
In order to address student behavior concerns that lead to suspensions and serve as a pipeline to prison, some school districts are implementing strategies such as Positive Behavioral
Interventions and Supports Systems (PBIS). PBIS focuses on promoting a positive school culture through behavioral interventions specific to the school, and providing feedback to students to reinforce positive behaviors (Contractor & Staats, 2014). PBIS uses prevention and intervention strategies in the classroom to develop positive, consistent, and safe learning environments through relationship building, which, in turn, supports academic, social, emotional, and behavioral outcomes for every student in a school (OSEP National Technical Assistance Center on PBIS, 2017). Schools throughout the country use PBIS as a tool to provide students with consistent and predictable rituals and routines.
1.2Purpose and Setting of the Study
The purpose of this study is to research the implementation of PBIS in six schools in a large urban school district, representing the following grade bands: K-5, K-8, 6-8, 6-12, 9-12, and a school that enrolls only students who receive special education services. PBIS is a significant part of my practice as an administrator. It is used to promote positive behaviors, which, in turn, could reduce suspensions. For this study, the focus on reducing disciplinary action in urban schools is of particular interest to me because of the connection between students serving suspensions and the school-to-prison pipeline.
Urban educational settings have a variety of demographic, structural, and cultural challenges. The demographic challenges that appear in urban settings relate to higher numbers of economically disadvantaged students, racially and ethnically diverse students, immigrants and English language learners, and higher student mobility rates (Kincheloe, 2004, 2010). In addition to these factors, urban schools see more segregation by race and economic status (Orfield, 2004)
and subsequently impact the effectiveness of structure and processes related to declining student achievement (Rumberger & Palardy, 2005). The study will retrospectively create a logic model from the district’s theory of action for PBIS implementation, which will then be used in a formative evaluation of the implementation.
A theory of action identifies a problem and the subsequent actions that must take place in order to provide a resolution (W.K. Kellogg Foundation, 2004). By clarifying the theory of action, it can then be used to create a logic model. The logic model will be used to evaluate the PBIS implementation resources, major activities, and major outputs/outcomes. A logic model is defined as a graphic representation of how “the relationships among the resources you have to operate your program and the activities you plan will produce the changes or results you hope to achieve” (W.K. Kellogg Foundation, 2004, p.1). The logic model will then be used to complete a formative evaluation of the implementation based on the components defined in the logic model. A formative evaluation is intended to evaluate the efforts of system improvement (Patton, 2005) by providing feedback that could help improve outcomes (Patton, 1999).
Sources of evidence for this study will focus on secondary analysis of existing district documents, using data not created by the researcher (Schutt, 2006) to retrospectively construct a theory of action and accompanying logic model. Once the logic model is created, it will be used to evaluate the adequacy of resources and activities and whether or not outputs/outcomes to date have occurred and if they are aligned with the logic model.
1.3Research Questions
To better understand the implementation of PBIS in the school district, this study will use district documents and school-level data from six schools to analyze and evaluate PBIS implementation. The goal is to examine PBIS implementation and outcomes to data.
The research questions for this study are as follows:
1. What would be the retrospective theory of action and resultant logic model for the PBIS plan and implementation applied in a set of schools in a large urban district in Pennsylvania?
2. Based on this retrospective logic model and through formative evaluation, were there adequate resources to fully implement PBIS?
3. Based on the retrospective logic model and through formative evaluation, were there adequate activities to fully implement PBIS?
4. What were the expected outputs/outcomes to date, have they occurred and are they aligned with the logic model?
1.4Significance of the Study
As a result of the full district implementation of PBIS, a study to evaluate the implementation was necessary. With feedback on the resources and early outcomes, the district can adjust the plan for PBIS implementation to better meet the needs of the students in the school district.
2.0Review of Literature
2.1What is the School-to-Prison Pipeline?
Historically, the way that children have been disciplined for crime has changed several times since the 1800s. Prior to the Progressive Era of 1900-1918, children over the age of seven were imprisoned in adult prisons (Einstein Law, 1997-2015). Social and political reforms evolved to change the way child offenders were treated. Rather than being imprisoned, reformers believed that children needed to be rehabilitated to ensure they were positive contributors to society rather than habitual offenders, and their cases were heard in an informal court for juveniles (Einstein Law, 1997-2015). During these trials, information was presented outside of the legal facts, were considered by the judges, and often ended with children placed in facilities that were more like orphanages (Einstein Law, 1997-2015). Prior to 1967, children were not protected by the Fifth and Fourteenth Amendments. Children were protected by these amendments until the Supreme Court confirmed that juvenile offenders should be provided due process and access to the following rights as minors: receive notification of charges, obtain legal counsel, allowed to have confrontation and cross-examination, and the right to use the Fifth Amendment and to be tried in a formal court setting (Einstein Law, 1997-2015). Thus began the shift away from rehabilitation and to incarceration.
When school discipline policies began changing in the 1970s, the school-to-prison pipeline emerged. The school-to-prison pipeline is defined as the use of the juvenile justice system to address problems that occur within the school system (ACLU, 2015). Rather than handling minor student infractions within the school, the school seeks criminal charges to address infractions. This
is often a result of zero-tolerance discipline policy that is used to address negative behaviors through criminalization, rather than using other behavioral, social, and mental health resources to address the concerns. Fewer than 4 percent of students were suspended per year in the 1970’s (NYCLU, 2013). Comparatively, in the 2011-2012 school year, of the 49 million students enrolled in public schools, 3.5 million, or 7.1 percent, were suspended in school; 3.45 million, or 7 percent, were suspended out of school; and 130,000 were expelled (U.S. Department of Education, 2016).
2.1.1 Zero Tolerance
Zero tolerance requires a specific action to be taken for certain forms of misconduct, with the goal of removing the behavior from the school and deterring others from exhibiting the same behavior (Curtis, 2014). This type of exclusion does not focus on progressive discipline, but, rather, swift exclusionary discipline. Darensbourg, Perez, & Blake (2010), argue that exclusionary discipline practices are a gateway to the school-to-prison pipeline. Specifically, the idea that students who are exposed to exclusionary discipline (e.g., detention, out-of-school suspensions, and alternative placement) and zero tolerance policies (e.g., predetermined discipline strategies that are punitive and severe) are more likely to become part of the judicial system (Darensbourg, Perez & Blake, 2010). This type of discipline was originally justified by the need to reduce drugs, weapons, and violence in schools. The first form of zero tolerance policies started in the 1980s to deter students from using drugs and then expanded to include weapons policies in 1994 when the Gun Free Schools Act was passed. This act directed schools to expel students for one year if they were found in possession of a weapon on school grounds (U.S. Department of Education, 1994). This policy allowed school administrators to determine the definition of a “weapon,” which means a weapon in one school could differ from a weapon in another. The premise was that these types
of policies promote fair, consistent, firm discipline, regardless of a child’s race (Curtis, 2014). In the 1996-1997 school year, there were zero tolerance policies for firearms in 94 percent of public schools, for other weapons in 91 percent, for drugs 88 percent, for alcohol 87 percent, and for violence 79 percent of public schools (Curtis, 2014).
Thereafter, suspensions began increasing rapidly. Suspensions increased for not only weapons, but also for small infractions like class cuts and disrespect, with the purpose of making schools feel safer (Kang-Brown, Trone, Fratello, & Daftary-Kapur, 2013). In 2000, 43 states required schools to report crimes committed on campus to law enforcement; these crimes included not only weapons violations but also fighting and other disruptive behaviors (Curtis, 2014). Referrals to the legal system were also a result of truancy; in 2004, truancy accounted for 35 percent of cases petitioned to the courts, and, of these petitions, 72 percent were reported by schools (Stahl, 2008).
Around the same time, schools began relying on school resource officers to provide support. Between 1997 and 2007, the number of school resource officers increased by more than a third in the United States (NYCLU, 2013). When reviewing the number of students charged by law enforcement for school incidents, there was an increased number of students charged for school incidents after school resource officers were added.
When looking at individuals most affected by exclusionary disciplinary policies, the data points to Black or Latino as well as low income and/or special education students. Specifically, students of color are disproportionately suspended compared to their white peers. As early as 1975, the Children’s Defense Fund reviewed data from the U.S. Department of Education Office of Civil Rights and found that Black students were suspended more frequently than white students; this pattern has consistently repeated itself since this initial report (Skiba, Michael, Nardo, & Petersen,
2002). The research also suggests that zero tolerance policies lead to dropping out of school. A study by Justice Matters Institute found that discipline history was a strong predictor of high school dropout and that African-American males were more likely to drop out because of this type of history than any other racial group (Sandler, 2003). The University of California at Los Angeles’ Civil Rights Project found that students who drop out are more likely to earn less money, live without health insurance, rely on public assistance, and experience recidivism (Rumberger & Losen, 2016).
The Civil Rights Project (2016) went on to also found that for 67,000 drop outs, the nation lost $35 billion dollars in lost tax revenue and spent more on health care and incarceration. Furthermore, those who are incarcerated, depending on the reason, lose their right to vote, cannot secure proper employment, and do not quality for public assistance. Rather than serving their time and moving on, they are often stuck in a continuous cycle of recidivism.
Furthermore, the New York Civil Liberties Union released a report in 2013 that highlighted how zero tolerance discipline practices can directly affect low income and special education students. The report highlights the fact that since the New York Public Schools increased the number of New York City Police Department staff, metal detectors, and zero tolerance policies, the number of low income and special education students’ discipline has increased dramatically (NYCLU, 2013). The report found that special education students were suspended twice as often as general education students. In addition, Black students with special needs serve 14 percent of the suspensions in the district even though they only make up 6 percent of the total public school enrollment. Students who receive a free or reduced lunch account for three-fourths of the total suspension in the district; however, they only make up two-thirds of the total enrollment in the district (NYCLU, 2013). These trends start in preschool. Students with disabilities make up 22
percent of the preschool population, 19 percent of those children suspended once, and 17 percent of those suspended more than one time (U.S. Department of Education Office for Civil Rights, 2014).
Since the implementation of zero tolerance policies, school discipline data has changed; however, the policies have remained the same. As the policies continue to be enforced, school violence is declining, but students of color are receiving more discipline than their white peers and student dropout rates for those affected by the zero tolerance policies are climbing (Curtis, 2014). In 1992, for everyone 1,000 students, 200 were victimized by violence. In 2011, the statistic was 50 victims for every 1,000 students (Robers, et al., 2013). At the same time, nonfatal events involving youth outside of school fell at the same rate from 1992 to 2011 (Curtis, 2014). The reduction in the number of victims decreased in both settings.
2.2Trends in School-to-Prison Data
This section will review trends in school discipline data. Specifically, it will focus on the impact in the following categories: gender, race, socioeconomic status, and mental health.
2.2.1 Impact on Males
When considering the impact of suspensions on males, it is important to know that males are four times as likely to be suspended as females and make up of over 75 percent of all discipline referrals (Gregory, 1996; Imich, 1994). In addition, from 1985 through 2009, delinquent crimes reported among boys increased by 17 percent from 932,300 to 1,088,600 (Conrad, Placella,
Tolou-Shams, Rizzo, & Brown, 2014). The effects of school suspensions do not stop at high school. Instead, they continue to plague male students into adulthood: 68 percent of males imprisoned in state and federal prisons do not have high school diplomas (Amurao, 2013). For individuals without a high school diploma and with criminal records, opportunities for advancement are very limited.
2.2.2 Impact on Females
While males are more likely to be suspended than females, it is important to know that female delinquent crimes increased by 86 percent from 1985- 2009 (from 222,900 to 415,600 crimes) (Conrad, Placella, Tolou-Shams, Rizzo, & Brown, 2014). The increase in delinquent crimes has also increased the number of females detained, on probation, and in placement. The number of females detained has increased by 6 percent, by 5 percent for probation, by 5 percent in placement from 1992-2013 (Sherman & Balck, 2015).
As we explore the effect of school discipline on young girls, we can go right to the data. In the 2011-2012 school year, 12 percent of Black girls, 4 percent of Latina girls, and 2 percent of white girls received an out-of-school suspension, with 19 percent for special education Black girls (Office of Juvenile Justice and Delinquency Prevention, 2014). There is a disparity between the number of Black and Latina girls who are suspended and the number of white girls who are suspended.
Female involvement in the juvenile justice system usually stems from low-level, non-violent offenses (Office of Juvenile Justice and Delinquency Prevention, 2014). The report, Girls,
Status Offenses and the Need for a Less Punitive and More Empowering Approach finds that
twenty-three percent vs. only one percent for boys. The number of petitioned cases for liquor law violations for girls grew by forty-one percent vs. only six percent for boys. During that same period, the number of petitioned runaway cases for girls decreased by twenty-five percent, yet girls still comprised fifty-eight percent of all petitioned runaway cases in 2009. In addition, the truancy case rate for girls was higher than the rate for all other status offense categories” (Coalition for Juvenile Justice, 2013, p. 1).
Many of the females involved in the juvenile system have dealt with traumatic experiences prior to offending: “…70% of girls in juvenile justice have been exposed to trauma; 60% report have been raped or are in danger of being raped; 65% have had Post Traumatic Stress symptoms at some point in their life; 76% report having witnessed someone killed or severely injured; 74% report having been in danger of being hurt or having suffered physical injury” (Kuhn, 2013).
Females who engage in antisocial behavior as juveniles are more likely to continue these antisocial behaviors into adulthood, even if they stop offending. These females have higher mortality rates, increased risk of mental health issues, unsuccessful and violent relationships, lower education levels, and employment challenges as adults (Hogdon, 2009).
2.2.3 Family and Socioeconomic Impact
Family structure and socioeconomic status can impact juvenile delinquency rates. Foster care placements and homes where mothers or fathers are absent can correlate with involvement in the juvenile justice system. Thirty percent of children who live in a foster home will enter the juvenile justice system as a result of behavioral concerns in the home, and 25 percent of foster children will be incarcerated after turning 18 (Amurao, 2013). For children living with their
biological families, if a mother or father is absent, they are more likely to be suspended from school (Hinojosa, 2008).
Socioeconomic status is another predicting factor for student suspensions and juvenile delinquency involvement. Students who are categorized as having low socioeconomic status have higher rates of suspensions and expulsions from school (Skiba, Trachok, Chung, Baker, Sheya, & Hughes, 2013).
2.2.4 Racial Impact
Race factors into whether or not students with behavioral infractions will be suspended. Multiple data points support this claim. White students are three and one-half times less likely to be suspended than Black students, and white students are twice as likely as Black and Latino student to graduate (Amurao, 2013). Exclusionary discipline starts in preschool for Black students. Black students comprise 18 percent of preschool enrollment in the United States, but account for 42 percent of students suspended once and 48 percent of students suspended more than once (U.S. Department of Education Office for Civil Rights, 2014). This trend continues for grades K-12. Forty percent of students expelled from United States schools each year are Black, and 70 percent of in-school arrests are attributed to Black or Latino students. Black students are three times more likely to be suspended than white students, and Black and Latino students are twice as likely not to graduate from high school than their white peers (Amurao, 2013).
These suspensions are not only affecting a student’s ability to graduate but are also reflected in the number of Black and Latino individuals who are incarcerated. Thirty percent of the United States is Black or Latino; however, a staggering 61 percent of those incarcerated are Black or Latino (Amurao, 2013). For Black males, the number of individuals imprisoned increased
by approximately 460,000 from 1980 to 2000, as compared to the increase by 120,000 of Black males who attended higher education institutions (Wagner, 2003). The number of Black males incarcerated in 2000 was about the same as those enrolled in higher education; as they await trial, classroom instructional time is lost, which leads to more drop-outs and increased recidivism (Wagner, 2003).
2.2.5 Mental Health Impact
When analyzing the characteristics of youth who are suspended or involved in the juvenile justice system, mental health repeatedly surfaces as a factor. Mental health plays a role as early as prekindergarten. Prekindergarten expulsions are twice as likely when a psychologist or psychiatrist is not available (Child Mind Institute, 2016). With suspensions or expulsions for 10 days, emotionally disturbed students make up 5.7 percent of those expulsions and suspensions (Child Mind Institute, 2016). As emotionally disturbed students reach high school, 38.7 percent of them drop out, compared to only 7 percent of all students (Child Mind Institute, 2016). The majority of juvenile offenders have a conduct or substance use disorder, and those with both conduct and substance use disorders are more likely to reoffend with substance–related violations (Conrad, Placella, Tolou-Shams, Rizzo, & Brown, 2014).
In the United States each year, over two million youth are arrested, over 600,000 are placed in juvenile detention, and over 93,000 are placed in secure juvenile detention centers (Snyder & Sickmund, 2006). Of the youth involved with the juvenile justice system, 70.4 percent have a psychiatric diagnosis (Child Mind Institute, 2016). Of these children, 60 percent have more than one diagnosis, and 61 percent also have a substance abuse problem (Skowyra & Cocozza, 2007).
are in detention centers, correctional facilities, or placements in their community have diagnoses that severely impair their way of life (Cocozza, Skowyra, & Shufelt, 2010).
In many cases, youth are referred to juvenile justice to receive the mental health services unavailable to them in their communities (Skowyra, & Coccozza, 2007). This finding is confirmed by a government study in which two-thirds of the juvenile detention centers studied reported they were detaining juvenile who could not receive adequate mental health services in their communities. This same study found that of 698 centers studied, one-fourth provided poor or no mental health treatment, and one-half of the centers had poorly trained mental health staff (U.S. House of Representatives, 2004).
2.3Challenges to Discipline in an Urban Setting
Urban educational settings have a variety of challenges that further complicate discipline policy. These include demographic, structural, and cultural challenges. The demographic challenges that appear in urban settings are related to more economically disadvantaged students, highly diverse racial and ethnic students, more immigrants and differences in first languages spoken, and higher student mobility rates (Kincheloe, 2004, 2010). In addition to these challenges, urban schools see more segregation by race and economic status (Orfield, 2004), which subsequently impacts the effectiveness of structure and processes related to declining student achievement (Rumberger & Palardy, 2005).
In examining systemic challenges in urban education, it is important to consider the impact on meeting student needs as well as affecting student achievement (Ahram, Stembridge, Fergus & Noguera, 2019). The major systemic challenges that urban settings face include chronically
underachieving students, instruction that is not coherent, teaching staff lacking experience, ineffective business operations, and low expectations for students (Ahram, Stembridge, Fergus & Noguera, 2019). Low student achievement is characterized:
• by poor performance on state assessments
• low graduation rates
• high rates of special education students (Ahram, Stembridge, Fergus & Noguera, 2019).
The next area, lack of coherent instruction can be defined by multiple initiatives that contradict one another, and ineffective professional development to implement these initiatives (Ahram, Stembridge, Fergus & Noguera, 2019).
The third area, inexperienced teachers, is included because inexperienced teachers are more likely to teach in schools with economically disadvantaged, Black, or Latino students (Lee, 2004). Research has found that teachers are less effective in their first three to five years (Goldhaber, 2008). The next area is ineffective business operations, which is often a result of urban districts being under-resourced (Ahram, Stembridge, Fergus & Noguera, 2019). The final area is low expectations for students. (Ahram, Stembridge, Fergus & Noguera, 2019). Low expectations are characterized by a lack of challenging courses, lack of gifted and talented programs, and staff that promote dropping out (Fine, 1991).
Cultural challenges are also a concern in urban education settings. Three main cultural challenges that show up in urban settings are:
• perception that race, and class predict school achievement
• school policies and procedures that are not culturally responsive (Ahram, Stembridge, Fergus & Noguera, 2019).
The first area, perceptions that race and class predict school achievement, is often the result of school personnel assuming that experiences in the homes of economically disadvantaged and minority students predicts their achievement level to be low (O’Connor & Fernanez, 2006). The second area, the belief that a student’s socioeconomics and culture define their intellectual ability, means that teachers attribute poverty and cultural differences to students’ intellectual capacity and ability (O’Connor & Fernandez, 2006). As a result, economically disadvantaged and minority students are stereotyped as having intellectual deficiencies. (Perry, Steele & Hilliard, 2003). The final area focuses on school policies and procedures that lack cultural responsiveness. Cultural responsiveness is a “pedagogy that acknowledges, responds to, and celebrates knowledge, information and processes as culturally bound and offers fuller and more equitable access to education” for economically disadvantaged and minority students (Ahram, Stembridge, Fergus & Noguera, 2019). In this respect, lack of cultural responsiveness leads to students who feel that school is unwelcoming, which results in low student achievement (Ahram, Stembridge, Fergus & Noguera, 2019).
2.4Promising Practices for Reducing the School-to-Prison Pipeline
2.4.1 Multi-Tiered Systems of Support
This section examines multi-tiered systems of support and, specifically, Positive Behavioral Interventions and Support systems as promising practices for addressing the
school-to-prison pipeline. Multi-Tiered System of Supports (MTSS) is a promising practice that can aid in addressing the school-to prison pipeline. This particular type of program is focused on five different components: “(a) prevention and wellness promotion; (b) universal screening for academic, behavioral, and emotional barriers to learning; (c) implementation of evidence-based interventions that increase in intensity as needed; (d) monitoring of ongoing student progress in response to implemented interventions; and (e) engagement in systematic data-based decision making about services needed for students based on specific outcomes” (Cowan, Vaillancourt, Rossen, & Pollitt, 2013). This system is effective when school-based personnel like psychologists, counselors, social workers, and nurses are paired with community-based services to provide a continuum of supports for students (Cowan, Vaillancourt, Rossen, & Pollitt, 2013). Implementation of strong counseling programs correlates with increases in high school attendance, graduation rates, and standardized test scores (Palmer & Erford, 2012) as well as a reduction in suspensions and other disciplinary actions (Carey and Dimmit, 2012). This system encourages a team-based approach, which is universal yet individualized to meet the specific needs of students (Belser, Shillingford, & Joe, 2017).
In order to ensure that the model produces results, several steps must occur in order to implement MTSS with fidelity. The first step is to create an MTSS team. This team is comprised of teachers, counselors, social workers, psychologists, and administrators (Belser, Shillingford, & Joe, 2017). Once the team is created, they should have access to school demographic data, use the data to choose a universal screening system, and create next steps for the MTSS roll-out, which is then communicated to the entire staff for implementation (Belser, Shillingford, & Joe, 2017). The next step is to administer the selected universal screening tool to the entire student body. Using the same universal screening tool for all students rather than just recommendations from staff will
help to decrease the number of missed students who are in need of support (Ockerman et al., 2012). After all students are screened, the data are reviewed and students are recommended for placement in one of three tiers of support, and then supports are created for each of these tiers (Belser, Shillingford, & Joe, 2017). Tier 1 interventions are typically focused on general education and instruction and intervention for all students (Harn et al., 2015). Examples of this type of programming include Positive Behavioral Intervention Systems (PBIS) and Social and Emotional Learning.
The next tier, Tier 2, is intended for students in which Tier 1 is not effective (Belser, Shillingford, & Joe, 2017). This tier focuses on “targeted interventions, group interventions and individualized interventions for less problematic behaviors (Newcomer, Freeman, & Barrett, 2013). Group interventions can be used to effect positive change in order to decrease misconduct by focusing on anger management, social skills, conflict resolution, and/or personal growth (Belser, Shillingford, & Joe, 2017). In some cases, students are not successful with group settings and require individualize support. These types of support can include behavior contracts that provide student with feedback on norms and check-in/check-out systems that provide student with feedback on their progress (Belser, Shillingford, & Joe, 2017). Check-in / check-out systems have been found to improve student behavior and decrease behavioral referrals (Maggin et al., 2015; Martens & Andreen, 2013). The last tier is Tier 3. This tier focuses on students who are at the highest risk based on the universal screening and who have not improved based on Tier 1 and 2 interventions (Belser, Shillingford, & Joe, 2017). These interventions include individual counseling, individualized mentoring, and/or referral to outside agencies for support (Ockerman et al., 2012). Other Tier 3 strategies are functional behavior assessments and specific behavior
intervention plans, which have been found to reduce negative behaviors and increase replacement behaviors in elementary school Black males (Belser, Shillingford, & Joe, 2017).
The final step in MTSS is progress monitoring, which is imperative to ensure students are receiving appropriate supports (Darensbourg, Perez, & Blake, 2010). Administering the universal screening tool twice a year allows the team to monitor progress and adjust support as needed based on improvement (or lack of improvement), which could mean moving from one tier to another or requiring further psychological testing (Belser, Shillingford, & Joe, 2017). With progress monitoring, school personnel can assure that the best possible support is provided to the students.
2.4.1.1Positive Behavior Interventions and Support Systems
PBIS focuses on promoting a positive school culture through behavioral interventions specific to the school, and providing feedback to students to reinforce positive behaviors (Contractor & Staats, 2014). PBIS involves prevention and intervention strategies in the classroom to develop positive, consistent, and safe learning environments through relationship building, which, in turn, supports academic, social, emotional, and behavioral outcomes for every student in a school (OSEP National Technical Assistance Center on PBIS, 2017). The model consists of four implementation elements: data, outcomes, practices, and systems. Data is the collection of information to ensure informed decision making; outcomes focus on what is needed for students to be successful both academically and behaviorally; practices focus on what experiences students must have to be academically and behaviorally successful through coaching, modeling, and encouragement; and systems are what teachers must experience to ensure that practices focused on academic and behavioral success are used in the classroom through professional development, access to data for decision making, and a team based approach to PBIS (OSEP National Technical
universal practices for all students; tier 2, targeted practices for groups of students who need more support; and tier 3 indicates practices that provide intense and targeting support for students who require more than tiers 1 and 2 (OSEP National Technical Assistance Center on PBIS, 2017).
The impact of PBIS on the school environment, if implemented with fidelity, can have significant impact on school culture. This fidelity includes explicitly teaching students expected behaviors and allowing students to practice these behaviors, while consistently recognizing the choice by students to demonstrate the expected behaviors (Sugai & Horner, 2006). Specifically, it can reduce major discipline infractions, aggressive behaviors, bullying incidents, and teacher turnover, and it can increase academic achievement, perceptions about school safety, and school climate (OSEP National Technical Assistance Center on PBIS, 2017).
2.4.2 PBIS Features of Implementation
PBIS implementation requires a school or district to “…(a) identify meaningful outcomes; (b) establish and invest in school-wide systems; (c) select and implement contextually appropriate, evidence- based practices; and (d) collect and use data to make decisions” (Simonson, Sugai, & Negron, 2008, p. 34). For the area of identifying meaningful outcomes, positive behavior initiatives should be one of the top three areas for growth in a school or district improvement plan, and a review of local school and district behavioral data should be used to demonstrate the need for PBIS (Simonson, Sugai, & Negron, 2008). Then, the school or district must identify “observable, measurable, specific, and achievable annual outcomes” such as reduction in suspensions, increased achievement scores, attendance rates, etc. that will be used to monitor yearly progress (Simonson, Sugai, & Negron, 2008, p. 34).
Next, when establishing and investing in school-wide systems, it is recommended that the school establish a PBIS team that includes individuals who will work to support the initiative, a coach who will organize the implementation of PBIS and provide positive reinforcement to continue with the work when things make be difficult, and, finally, procure 80 percent agreement from the staff that the school should move forward with PBIS (Simonson, Sugai, & Negron, 2008). Next, a data system must be created to allow for behavioral data to be entered and a way to visually represent this data. Finally, all PBIS team members must be trained in PBIS (Simonson, Sugai, & Negron, 2008).
The next step is to select and implement contextually appropriate, evidence-based practices. This process includes setting a few expectations for students that are phrased in a positive way; establish routines that are associated with each of these expectations; create lesson plans that will be used to teach the expectations in each classroom; work with staff to actively monitor students demonstrating the expectations in the classroom and all other areas of the school; determine what strategies will be used to recognize positive behaviors; determine what strategies will be used to counter unwanted behaviors; create a system for positively recognizing staff members who are implementing PBIS; and, finally, create an action plan for guiding whole school implementation (Simonson, Sugai, & Negron, 2008).
Finally, collecting and using data to make decisions is important for monitoring implementation and making decisions. Team members will review data at every meeting to inform decision making; the data are shared with all staff, the process they use to make decisions is also publicly shared, and successes are shared with students, staff, families, and the school community (Simonson, Sugai, & Negron, 2008).
2.4.2.1Leadership Teaming
When establishing a PBIS program, the first step is to create a leadership team and support structure. The OSEP Technical Assistance Center on Positive Behavioral Interventions and Supports (2017) recommends that when a leadership team is selected, it should include individuals with the authority to influence policy making. The group should include a variety of stakeholders who understand the social, emotional, and behavioral needs of students, including but not limited to teachers, special education staff, board members, administrators, community members, community agencies, and/or families and individuals with experience with behavioral science that can assist with the understanding of Tier I and Tier II interventions. Once selected, these team members should be led by coordinators who have experience making decisions using data, and creating systems to support implementation with social, behavioral and emotional practices. Once all of these individuals are in place, the team will work to create a three to five-year action plan, develop a process for meeting and solving problems, engage with the superintendent, monitor and report on the implementation, and provide and collect regular feedback on implementation with the stakeholders.
2.4.2.2Stakeholder Support
Stakeholder support is another area to be considered when implementing a PBIS program. The OSEP National Technical Assistance Center on Positive Behavioral Interventions and Supports (2017) recommends that stakeholders assist with setting goals and creating policy, sharing information and accomplishments of implementation with the community, and making PBIS a major goal of the school system. Stakeholders who hold central office positions should attend PBIS events to acknowledge the importance of PBIS implementation.
2.4.2.3Funding
A three-year budget commitment to implementation also supports long-term sustainability (OSEP National Technical Assistance Center on PBIS, 2017).
2.4.2.4Policy and System Alignment
The OSEP National Technical Assistance Center on Positive Behavioral Interventions and Supports (2017) recommends starting the policy work by creating a shared vision statement that reinforces the need for a positive school climate and how PBIS can reinforce such a climate and increase student achievement. In addition to a vision, PBIS should be articulated, reviewed, and updated regularly in district policy and regulations, and these policies and regulations should be distributed yearly to staff. Finally, a description of how PBIS is aligned to other social, emotional, and behavioral initiatives should be clearly articulated and shared with the district community. When other initiatives are considered, they should be vetted to determine their fit with the current initiatives in place.
2.4.2.5Workforce Capacity, Training, and Coaching
Workforce capacity, training, and coaching are the next three areas of focus. OSEP National Technical Assistance Center on Positive Behavioral Interventions and Supports (2018) recommends establishing job descriptions that include PBIS, recruitment, and hiring criteria that require knowledge of PBIS and allocating personnel to assist with PBIS implementation. In addition to hiring, it also recommends training for new employees and an assessment of school and district personnel have in the area of PBIS.
“implementation rationale, process, outcomes, and readiness requirements” and a PBIS training calendar that is established in advance and published for all to see, which includes training for new employees and updated training for all employees. The training should include opportunities for like peer groups to get together and share promising practices and troubleshooting. Finally, large districts should build capacity for internal training to be sustained, rather than relying on outside providers.
Coaching is another component of PBIS implementation. It should take place monthly for newly formed teams and quarterly for existing teams to provide feedback and support with implementation with clear expectations regarding coaches’ roles in the implementation (OSEP National Technical Assistance Center on PBIS, 2018). These coaches are also to be provided with training and technical support to ensure fidelity of PBIS implementation, with the intention that a large district build capacity for internal coaching systems, without reliance on outside providers (OSEP National Technical Assistance Center on PBIS, 2017).
2.4.2.6Evaluation and Performance Feedback and Behavioral Expertise
Evaluation, performance feedback, and behavioral expertise are other areas of PBIS implementation. The OSEP National Technical Assistance Center on Positive Behavioral Interventions and Supports (2017) recommends the use of data at the school level to provide feedback on implementation to assist with decision making and to identify the need for additional supports. This system of evaluation should be established through the creation of a schedule and process for analyzing data for students, classrooms, and districts, including annual reports on progress to the community. Another recommendation is to celebrate accomplishments publicly every quarter. Finally, school districts should build capacity for internal evaluation and feedback, without reliance on outside providers.
2.4.2.7Local Implementation Demonstrations
The final recommendation is for local implementation and demonstrations. This area aids districts in establishing how PBIS will be rolled out to schools. Specifically, it addresses pilot school selection and expansion plans, as well as a plan for how and when tiers will be implemented and how their implementation will be monitored through the use of data and shared with stakeholders (OSEP National Technical Assistance Center on PBIS, 2017).
2.5Use of Formative Assessment
2.5.1 Definition of Formative Assessment
Formative evaluation can be defined as evaluation that is used to improve “program processes and providing feedback about strengths and weaknesses that appear to affect goal attainment” (Patton, 1999). It relies on evaluation data to improve the program being evaluated.
2.5.2 Theory of Action
This type of model connects theoretical ideas to support program assumptions and focuses on large concepts, not small details (W.K. Kellogg Foundation, 2004). A theory of action can help educators to accomplish a variety of tasks related to program implementation. They include what success looks like for the program, factors and resources that positively and negatively affect success of the program, what can be controlled for, and how to use data in decision making (W.K. Kellogg Foundation, 2004).
2.5.3 Logic Model
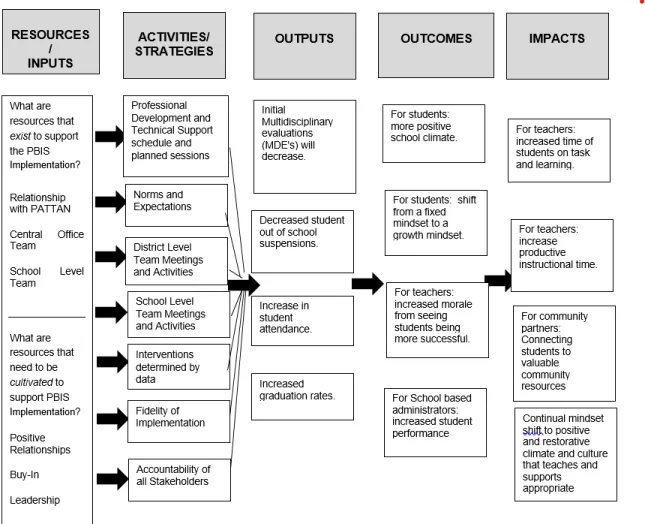
A logic model can be defined as a “systematic and visual way to present and share your understanding of the relationships among the resources you have to operate your program, the activities you plan, and the changes or results you hope to achieve” (W.K. Kellogg Foundation, 2004, pg. 1). A logic model allows the researcher or implementer of a program to evaluate how well a program was planned, implemented, and evaluated in addition to helping to make programs more successful and showing why the program is worthy of investment (W.K. Kellogg Foundation, 2004). Logic models, according to the Kellogg Foundation (2004), have five main components: factors, activities, outputs, outcomes, and impacts. Factors barriers that can limit the effectiveness of a program, such as funding, people, policies, etc. The next component is activities. Activities are the actions of the planned program, which may include products such as training, print materials, and/or structure. The third component is outputs. Outputs are defined as the results effected by the program activities and include a size or scope for their production. The fourth component is outcomes. Outcomes are defined as the changes in “attitudes, behaviors, knowledge, skills, status, or level of functioning” as a result of the program activities. The final component is impacts. Impacts are “organizational, community, and/or system level change” expected from the implementation of the planned activities.
Logic models should be read from left to right, starting with resources and ending with impact (W.K. Kellogg Foundation, 2004). In addition, logic models follow a chain of reasoning, highlighted by if… then statements to connect the program components (W.K. Kellogg Foundation, 2004). The logic model begins with the programs planned work and ends with the intended results (W.K. Kellogg Foundation, 2004).
3.0Methods
3.1PBIS in a PA School District
The district studied in this study is identified by a pseudonym, (PA School District). As documented in the Council of the Great City Schools (CGCS) report in 2016, four unspecified schools in the PA School District were implementing PBIS. Prior to the Council of Great City Schools study in 2016, PBIS had been implemented in the PA School District, partially and sporadically, for more than 20 years. The Council of the Great City Schools report made several recommendations to the PA School District on a variety of topics. One recommendation was to implement PBIS in every school in the district. The report specified that the implementation of PBIS should focus on the following discipline areas: early childhood suspensions, racial disproportionality, and long and short-term suspensions (Council of the Great City Schools, 2016). As a result of this report, the PA School District created a comprehensive strategic plan for addressing those concerns.
In 2017, the district unveiled their 2017-2022 Strategic Plan. The report contained four strategic themes, one of which was to Create a Positive and Supportive School Culture focusing on the following initiatives: “Establish a system-wide Multi-Tiered System of Support process, that includes Positive Behavioral Interventions and Supports and restorative practices, implemented through high-functioning Student Assistance Program teams in every school that is equipped to follow the process with fidelity; develop and communicate clear, consistent, and explicit expectations for staff interactions with students and families and each other; and implement a tiered and phased community schools approach” (PA School District, 2017).
The strategic plan went on to articulate a guiding vision: “PA School District will create positive and supportive school climates by implementing systems in every school that build community, promote positive relationship building, and provide differentiated academic and behavioral support and two outcomes: tiered methods to build community, strengthen relationships, and provide academic and behavioral support in every school and high-functioning, collaborative support teams will exist in every school” (PA School District, 2017). From these initiatives, a strategic theme team consisting of central office and school administrators helped to create a plan for implementing PBIS in every school in the school district.
3.2Research Questions
This study addresses the following research questions:
1. What would be the retrospective theory of action and resultant logic model for the PBIS plan and implementation applied in a set of schools in a large urban district in Pennsylvania?
2. Based on this retrospective logic model and through formative evaluation, were there adequate resources to fully implement PBIS?
3. Based on the retrospective logic model and through formative evaluation, were there adequate activities to fully implement PBIS?
4. What were the expected outputs/outcomes to date, have they occurred and are they aligned with the logic model?
3.3Description of the Study
One purpose of this study is to create a logic model that represents the implementation of a PBIS system in six schools in an urban school district. The schools represent the following grade bands: K-5, K-8, 6-8, 6-12, 9-12, and a special education school. The study first articulates a theory of action informed by district documentation. The data was requested from the PA School District through their Internal Review Board process. Once approved the data were received in the form of jump drives.
The theory of action was then used to retrospectively create a logic model. This logic model was then used to complete a formative evaluation of the adequacy of resources and activities and the expected outputs/outcomes of PBIS in this district to date. A formative evaluation is intended to assist with system improvement (Patton, 2005) by providing feedback that could help improve outcomes (Patton, 1999).
The development of a logic model and formative evaluation has not been completed by the district. With feedback on the implementation, the district can adjust the plan for PBIS implementation to better meet the needs of the students in the school district and provide a model for how new initiatives should be implemented in the future. Specifically, this study may provide refinement for other urban and large districts to implement PBIS.
3.4Setting and Participants
This study consists of a sample of schools from a large urban district in Pennsylvania. The research was conducted in six schools, representing all grade bands in the school district. This
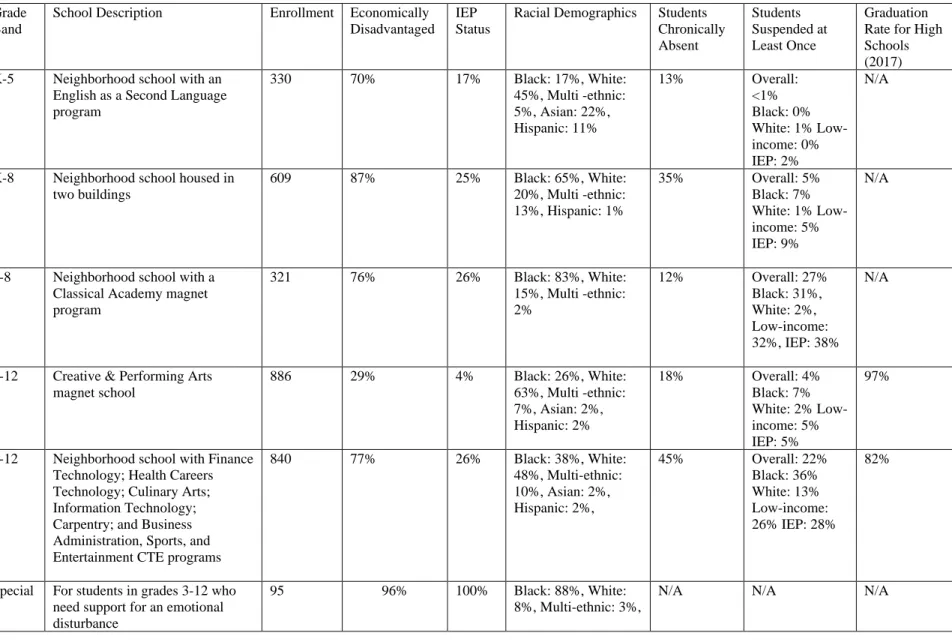
district was selected because it chose to implement PBIS in every school. Each of the district’s school configurations were included in the study including one K-5, one K-8, one 6-8, one 6-12, one 9-12, and one school that specializes in special education student needs. The schools were selected to provide a cross section of schools in the district. When implementing PBIS, it is recommended that schools are selected to represent the full scope of district schools to include size, location, grade band, etc. and that between four and 10 schools are selected for initial implementation (Sugai & Horner, 2006). Based on these recommendations, the study focused on six schools that are located in all areas of the city, with various enrollment numbers, student demographics, and student achievement results. The schools were labeled with their grade band designations to allow for greater anonymity. School Demographic Data (Table 1) was obtained from the Report to the Community on Public School Progress in Pittsburgh (A+ Schools, 2018).
Table 1. School Demographic Data Grade
Band
School Description Enrollment Economically
Disadvantaged IEP Status
Racial Demographics Students
Chronically Absent Students Suspended at Least Once Graduation Rate for High Schools (2017)
K-5 Neighborhood school with an
English as a Second Language program 330 70% 17% Black: 17%, White: 45%, Multi -ethnic: 5%, Asian: 22%, Hispanic: 11% 13% Overall: <1% Black: 0% White: 1% Low-income: 0% IEP: 2% N/A
K-8 Neighborhood school housed in
two buildings 609 87% 25% Black: 65%, White: 20%, Multi -ethnic: 13%, Hispanic: 1% 35% Overall: 5% Black: 7% White: 1% Low-income: 5% IEP: 9% N/A
6-8 Neighborhood school with a
Classical Academy magnet program 321 76% 26% Black: 83%, White: 15%, Multi -ethnic: 2% 12% Overall: 27% Black: 31%, White: 2%, Low-income: 32%, IEP: 38% N/A
6-12 Creative & Performing Arts magnet school 886 29% 4% Black: 26%, White: 63%, Multi -ethnic: 7%, Asian: 2%, Hispanic: 2% 18% Overall: 4% Black: 7% White: 2% Low-income: 5% IEP: 5% 97%
9-12 Neighborhood school with Finance
Technology; Health Careers Technology; Culinary Arts; Information Technology; Carpentry; and Business Administration, Sports, and Entertainment CTE programs
840 77% 26% Black: 38%, White: 48%, Multi-ethnic: 10%, Asian: 2%, Hispanic: 2%, 45% Overall: 22% Black: 36% White: 13% Low-income: 26% IEP: 28% 82%
Special For students in grades 3-12 who need support for an emotional disturbance
95 96% 100% Black: 88%, White:
8%, Multi-ethnic: 3%,
The term IEP above refers to “Students with an Individual Education Plan (IEP) for special education, excluding students identified as ‘gifted”” (A+ Schools, 2018). “Magnet school” refers to a school in which all students must apply to attend. “School with a magnet program” refers to a school with both magnet and neighborhood (feeder pattern) components. “CTE program” refers to Career and Technical Education” (A+ Schools, 2018).
3.5Data Collection and Analysis
This study begins with the creation of a theory of action for PBIS implementation in the district. The theory of action articulates the overall purpose and logic for the improvement effort. A logic model then further explicates the resources, actions, and various outputs and outcomes of the improvement effort. The relationships among these elements support the development of a formative evaluation plan to consider the resources and activities to implement PBIS. Secondary data was used to apply “theoretical knowledge and conceptual skills to utilize existing data to address the research questions” (Johnston, 2014).
For research question one, the following district documents were used to explain the theory of action and subsequently create a logic model from the theory of action: strategic plan, strategic theme team action plan, strategic theme team closeout document, and PBIS Installation and Training Plan. A form of qualitative analysis, framework analysis, was used for this research question. Qualitative data analysis is an interpretation of data that is not numeric, such as documents, interviews, photos, video, etc. (Dudovskiy, 2018). More specifically, framework analysis is the process in which researchers familiarize themselves with the content; identify a framework based on themes from the research; code, chart, and map based on these themes, and,
finally, provide an interpretation, or in the case of this research study, a theory of action and logic
model (Dudovskiy, 2018). For this question, a review of the literature and district documents
familiarized the researcher with PBIS implementation (Ritchie & Spencer, 1994). Next, the
thematic framework is established by identifying themes within the data set. Notes taken during the familiarization process are then used to begin coding the themes, with particular attention to being objective in identification, regardless of prior knowledge about the subject of PBIS
implementation (Ritchie & Spencer, 1994). In coding, a code is understood as “… a word or short
phrase that symbolically assigns a summative, salient, essence-capturing, and/or evocative attribute for a portion of language-based or visual data” (Saldana, 2010). Once codes were decided upon, they were then charted to determine where they were displayed in the documents selected for analysis. The chart included a column for theme, title of document, actual text from the document, and the location in the document. The theme was also marked as inductive or deductive in nature; inductive are the ideas that are not predetermined by the research but are gathered from the documents selected for analysis. Deductive themes are informed by prior research before document review. This chart is provided below in Table 2 titled Theme Organization Chart.
Table 2. Theme Organization Chart
Next, mapping of the chart was conducted to provide a diagram of the implementation plan for the school district (Ritchie & Spencer, 1994). For this study, this diagram was in the form of a theory of action and logic model.
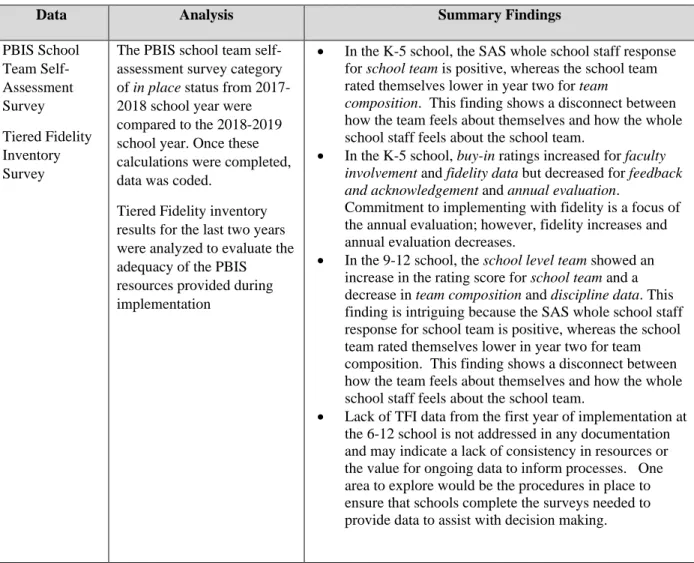
For research question two, to evaluate the adequacy of resources, the PBIS school team Self-Assessment Survey and Tiered Fidelity Inventory Survey results were used. The PBIS school team Self-Assessment Survey was selected to collect school team perception data based on their experiences with implementation. The Self-Assessment Survey (SAS) “provides staff perception data to assist with annual action planning, internal decision-making, assessment of change over time, awareness of building staff and team validation” (Midwest PBIS, 2019). The SAS was chosen in order to provide understanding of staff perceptions of PBIS implementation. The survey is administered to the entire school staff and requires 80 percent participation for fidelity. School staff do not identify their role group, gender, or race, which helps to ensure anonymity. The survey requires participants to rate general implementation status as IP = In Place (>80%), PP = Partially in Place (50-80%), or NP = Not in Place (<50%) for each question posed (Midwest PBIS, 2019). All the questions are categorized by overarching themes, including school-wide systems, non-classroom settings, classroom settings, and individual student settings. The questions related to resources come from the school-wide systems theme. In Tables 3-6 the following SAS questions were used to evaluate the adequacy of resources:
Table 3. School-Wide Systems SAS Resources Question
No.
Question
9 A team exists for behavior support planning & problem solving.