Do the Determinants of Performance Measures Used for Evaluation Differ Across Four
Categories of Measures? Evidence From High-Tech Firms
Elizabeth Anne Demers Wm. E. Simon School of Business
University of Rochester Rochester, NY 14627 [email protected]
Margaret B. Shackell∗ 375 Mendoza College of Business
University of Notre Dame Notre Dame, IN 46556
Sally K. Widener
Jesse H. Jones Graduate School of Management Rice University Room 331 – MS 531 6100 Main Street Houston, TX77005 [email protected] January 2006
∗ Corresponding author. Fax Number: 574-631-5255
We thank Leslie Eldenburg, Michael Maher and Karen Sedatole for their valuable comments. We appreciate helpful discussions with Bob Bozeman, Mark Bolino, Kevin Bradford, Glen Dowell, Jae Heme, and Dave Regn related to this project. Valuable research assistance was provided by Michael France, Hang Li, Luke Ratke, Garett Skiba, Jessica Xu, and Adrian Yu. The financial support of CIMA is gratefully acknowledged. All errors are the sole responsibility of the authors.
Do the Determinants of Performance Measures Used for Evaluation Differ Across Four
Categories of Measures? Evidence From High-Tech Firms
Abstract
The use of performance measures in evaluating subordinate performance is an important aspect of organizational design. Yet despite the prevalence of multi-dimensional performance measurement systems in practice (e.g., the balanced scorecard or strategic performance measurement system), the academic literature has provided limited understanding of the contingency factors that explain the use of various types of performance measures. We extend our understanding of the use of performance measures by examining the strategy (i.e., competitive advantage) and structure (i.e., delegation of decision rights and level of incentive compensation) factors that explain the use of measures across four categories: customers, employees, new products, and financial performance. We conduct a field examination of 53 high-tech firms and find that, after controlling for entrepreneurial variables, strategic and structural factors significantly explain the extent of use of measures in evaluating subordinate performance in each of the four performance measure categories. We also find that different dimensions of strategy and structure are significant in explaining the use of performance measures across the different categories of measures. For example, the results show that a competitive advantage based on product features and higher levels of stock options are associated with the use of new product development measures while a competitive advantage based on service and employee knowledge and higher levels of bonus
compensation significantly explain the use of employee measures. The results suggest that the multi-dimensional nature of today’s performance measurement systems is an important feature to understand and to incorporate into the design of future studies since different factors influence the use of measures across different categories.
Key words: Performance measures, Strategy, Structure, Entrepreneurial firms, Contingency theory, Non-financial measures, organizational design
Do the Determinants of Performance Measures Used for Evaluation Differ Across Four
Categories of Measures? Evidence From High-Tech Firms
1. Introduction
The choice of performance measures is one of the most important aspects of organizational design. Yet despite its significance and the prevalence of multi-dimensional performance measurement systems observed in practice (e.g., balanced scorecard or strategic performance measurement systems), much of the extant academic literature has relied upon the dichotomization of performance measures into financial versus non-financial measures for the investigation of performance measurement use, and this has generated mixed results (Ittner & Larcker, 2001). Indeed, Ittner and Larcker (1998) observe that “the use and performance consequences of [various performance] measures appear to be affected by
organizational strategies and the structural and environmental factors confronting the organization” and call for research that provides evidence on the factors affecting the adoption of various non-financial measures. Our study directly responds to this call. Specifically, we conduct a field examination of the contingency factors that explain the extent of managers’ use of four categories of performance measures in evaluating subordinate performance.
We undertake our study in the business-to-consumer (“B2C”) Internet sector because prior research has established the importance of various non-financial measures for evaluating these organizations (e.g., Demers & Lev, 2001), and thus this industry provides a fruitful setting in which to explore the use of multi-faceted performance measurement systems. By working in this high-tech setting, we also address the recommendations of Chenhall (2003) who calls for more studies outside of the large manufacturing organizations that have been the focus of much of the prior management accounting literature. We specifically focus on the sales/marketing departments since customer acquisition and revenue generation were critical success factors for consumer-oriented Internet firms during the period of our study. As noted by Chenhall (2003), departments within the same firm often have different
management control systems,1 suggesting the need for research related to the architecture of individual functional areas. Although focusing on a single function limits the potential generalizability of our findings, it increases the power of tests due to the commonalities associated with this department across firms (Davila, 2005). Because we examine a strategically important function in the Internet sector during the period of our study, we consider the benefits of this increased power to outweigh the limitations of generalizeability.
Our research methodology consists of field-based and telephone survey interviews with the vice-presidents (VPs) of sales and marketing departments of U.S. high-tech firms. As expressed by Tufano (2001), one of the major advantages of more clinically oriented research is its “inherently closer examination of purposefully restricted samples” (p. 187). The survey approach, in particular, offers a balance between large sample analyses and single-firm studies, and enables the researcher to ask specific, qualitative questions about the underlying constructs of interest (Graham & Harvey, 2001). Our study benefits from these characteristics of field-based survey research and enables us to construct a unique database with which to address research questions related to the determinants of the use of performance measures in high-tech firms.
We examine whether different aspects of strategy and structure explain VPs’ use of four categories of performance measures in evaluating their subordinates’ performance. The four performance measure categories include measures associated with employees (e.g., turnover), customers (e.g., number of new customers), new products (e.g., number of new product introductions), and financial performance (e.g., net income). We measure strategy in terms of respondents’ perceptions regarding their firms’ sources of competitive advantage in aspects of performance vital to the high-tech industry (e.g., product features, brand name, reputation) (Porter, 2001). We measure structure as delegation of decision rights and incentive compensation (i.e., degree of pay-for-performance).
1 Chenhall (2003) calls this functional differentiation. For example, Mia and Chenhall (1994) demonstrate that marketing and production departments of the same firms use different information in their management control systems. Similarly, Hayes (1977) shows that different subunits of a firm respond differently to environmental variables.
Our study contributes to the literature in a number of ways. First, in response to the criticism that accounting research suffers from the use of outdated and single-faceted measures of strategy (Chenhall, 2003; Langfield-Smith, 1997), we introduce the strategy construct of competitive advantage to the accounting literature. Using various measures of competitive strategy that are particularly relevant to our sample of prospector-like firms, we provide insights that extend beyond the extant literature that measures strategy in terms of a prospector versus defender standpoint.
Second, we provide a greater understanding of the factors associated with the use of performance measures across multiple performance measure categories, and we do so for a specific decision context. Ittner and Larcker (2001) suggest that survey studies often do not identify the decision context leading to potential inconsistencies across respondents and noisy measures. To overcome this limitation, we investigate the determinants of the use of measures in the specific context of the evaluation of subordinate performance. We measure four types of competitive advantage, two sets of decision rights, and two types of incentive compensation. We hypothesize and find that different dimensions of strategy and structure will explain the use of performance measures in different categories. Thus, for example, beyond concluding that incentive compensation is associated with the use of performance measures, we can show that the use of stock options explains the use of customer metrics while the use of bonus compensation explains the use of employee metrics. Thus, we specifically, and with some depth, respond to the call for research that provides evidence on the variables affecting the use of various performance measures (Ittner and Larcker, 1998).
Finally, in contrast to prior research (e.g., Nagar, 2002) we investigate the association among all three primary components of organizational control structure: performance measures, delegation and incentives (Brickley, Smith & Zimmerman, 2003). In addition to strategy explaining the use of performance measures, we hypothesize and find that delegation and incentives, two types of “structure” explain the use of a third type of “structure”, which is the use of performance measures.
The rest of this paper is organized as follows. In Section 2, we provide an overview of the performance measurement literature, describe some of the findings from our pilot interviews that provide
context for our choice of variables, and we draw on the extant literature and underlying theory to develop our hypotheses. Section 3 explains our sample selection and survey methodology. Section 4 presents our empirical specifications and findings. In Section 5 we summarize our results, draw conclusions from our findings, and provide a discussion of the limitations of our study together with suggestions for future extensions.
2. Background
2.1 The Literature on Performance Measure Drivers
In their review of the management accounting literature, Ittner and Larcker (2001) summarize the extant empirical findings related to performance measurement as being broadly consistent with the notion that the choice of performance measures is a function of the organization’s competitive environment, strategy, and organizational design. They also note, however, that the empirical literature that considers the role of non-financial measures relative to financial measures has generated mixed results. The authors suggest that these mixed results may be due in part to deficient model specification arising from the omission of important contingency variables. Indeed, in a more targeted review of this particular literature, Ittner and Larcker (1998) suggest that future research can make a significant contribution by providing evidence on the contingency variables affecting the adoption of various non-financial measures.
Our study addresses this gap in the literature by examining the association between the strategic (i.e., competitive advantage) and structural factors (i.e., decision rights and incentive compensation) posited to be important determinants of performance measure choice. Specifically, we investigate the extent of use of four categories of performance measures, which include customers, employees, new products, and financial performance. In so doing, we seek to expand our understanding of the multi-dimensional nature of performance measure use beyond the broad financial/non-financial categories considered in the prior literature (e.g., Ittner and Larcker, 2001). Furthermore, theory suggests that a performance measure should be adopted if that measure provides incremental information for decision-making purposes (Feltham & Xie, 1994). Thus, our research question provides insight into whether
different categories of performance measures provide varying levels of informativeness depending on the firm’s strategic and structural context.
2.2 Contextual Background – Integration of Data from Pilot Firms
Insights from the field are one of the primary advantages of our chosen field-based methodology. In this section, we describe some of the information gleaned from our pilot interviews that we incorporate into the development of our hypotheses and interpretation of our results.
We interviewed executives at five high-tech firms in the Internet sector prior to developing our survey. The results from these pilot interviews led us to consider competitive advantage, delegation of decision rights within the department, incentives, and performance measurement as being of primary interest to firms at a relatively young stage of development in the industry. In response to our questions about whether the firms were cost leaders or differentiators, all firms answered that they were
differentiators. They proceeded to explain their niche in terms of their competitive advantage versus other firms. For example, they discussed “timing, product breadth, human capital, domain expertise, patents, technology, cash, focus, service, product mix”, and similar sources of competitive advantage. It became clear that capturing strategy at a broad firm level (i.e., a prospector versus defender standpoint) was not appropriate for this type of firm. Instead, the firms were all prospector-like firms that were building and exploiting different sources of competitive advantage. The executives discussed how they use their competitive advantage to succeed and the resultant need for empowered employees.
Extant research often captures structure based on the extent to which the firm is organized into multiple divisions or business units. These small high-tech firms all categorize their firms as centralized since they do not have multiple divisions or separate business entities. However, it was clear that decision rights were delegated within the department or function and played an important role in the empowerment of employees. The executives talked at length about how they get their employees “committed to vision,” “have weekly brown bag lunches,” and try to convince the employees that they “feel like they’re on a winning team.” Incentives were viewed as being important to the firms and important to retaining a key resource: the employee. The executives relied on three primary types of incentives: bonuses, options, and
perquisites (such as food, foosball, and having fun). We also found a strong focus on performance measurement. Although all of the firms emphasized performance measurement, they varied in the extent of information that they shared with their employees. Information sharing varied greatly from “the whole organization gets profit & loss statements” to “we don’t give employees the big [financial] picture.” The firms talked at length about the various and diverse performance measures that they use. One executive stated “Performance measures. There are so many. [We use] contribution per transaction, EBITDA, cash flow, web metrics, marketing value…..” Another executive stated that “We are incredibly quantitative. [We] look at the numbers behind everything”.
Overall, it was clear from the pilot interviews that performance measurement was important in these high-tech firms, and that competitive advantage, the delegation of decision rights, and employee incentives were important strategic and structural variables determining the firms’ use of various performance measures. In the sections that follow we use these insights gained from our field work together with extant theory and empirical results to develop our hypotheses relating strategy and structure to the use of performance measures in our setting.
2.3 The Relation Between Strategy and Performance Measure Choice
In order to effectively manage their organization, executives need measures that capture and reflect their firms’ strategies. The empirical literature in this area can be broadly summarized as having documented an alignment between firms’ management control systems and their strategies (e.g., Ittner & Larcker, 1997; Langfield-Smith, 1997). In other words, performance measures provide information that is focused and specific to the firm’s strategy.
Early studies focus on organizational-level strategy variables that capture strategic positioning (e.g., Porter, 1980), strategic typologies (e.g., Simons, 1987), and strategic mission (e.g., Govindarajan & Gupta, 1985). In a more recent study, Perera, Harrison and Poole (1997) argue that financial measures are too aggregate and short-term in nature, and are not focused enough to capture elements of strategy that are critical to the firm’s success. They investigate the performance measurement system in firms that compete using a customer-focused strategy and find that firms rely more on non-financial measures related to their
strategy than on traditional financial measures (e.g., profitability and return-on-investment). Abernethy and Lillis (1995) similarly find, for firms following a flexible manufacturing strategy, a higher reliance on efficiency-based measures than traditional financial measures. Other studies explore the relation between management control systems and operational strategies such as quality and reach the same conclusion (e.g., Ittner & Larcker, 1995, 1997).
Despite these positive results, Chenhall (2003) argues that the strategy literature might suffer from outdated strategy constructs and the investigation of only single facets of a multi-faceted concept (see also Langfield-Smith, 1997).2 To counter this criticism, we measure multiple dimensions of strategy. We also introduce a more refined measurement of the differentiation strategy construct to the accounting literature, competitive advantage, which Porter (2001) suggests is critical to success in the Internet sector and thus of primary relevance to our setting. Competitive advantage is what companies use to “generate sustainable revenues or savings in excess of their cost of deployment” (p. 61) and includes both operational effectiveness advantages (i.e., superior inputs, effective management structure) and strategic positioning (i.e., product features, better array of services) (Porter, 2001). In the analyses that follow, we investigate the relation between the use of performance measures and four sources of competitive advantage: (1) service and employee knowledge, (2) brand name and reputation, (3) product features and timing, and (4) financial efficiency (i.e., low cost and financial capital).
The literature discussed above suggests that firms rely more on the use of performance measures specific to their underlying differentiation (e.g., customers, manufacturing flexibility, or product quality). Thus we expect that the use of performance measures in evaluating subordinate performance will depend on the source of competitive advantage being used by the firm. Specifically, we expect that different sources of competitive advantage will be significantly associated with the use of performance measures across the different categories of performance measures that we examine (see summary in Table 1). Ex ante, we expect that competitive advantage based on (1) service and employee knowledge and (2) brand
2
Since the work of Chenhall (2003), several studies have introduced the concept of “strategic resources” to the accounting literature by investigating its association with management control practices (Henri, 2005; Widener, 2004, 2005).
name and reputation will be associated with increased use of both customer and employee measures. This expectation is consistent with the service operations and marketing literatures that emphasize the roles that employees and service quality have on customer outcomes such as satisfaction (Heskett, Sasser, & Schlessinger, 1997; Rust, Zeithaml, & Lemon, 2000). We expect that a competitive advantage based on product features and timing will be positively associated with the use of new product measures, which will provide performance information related to how well the firm differentiaties itself in terms of the revenue, profitability and market share of new products, along with the number of new products the firm introduces. Finally, we expect that firms across all sources of competitive advantage, including financial efficiency, will rely on the use of financial measures since competitive advantage translates into firms’ financial outcomes (Porter, 2001). Financial measures provide information on the short-term financial success of the organization and measure whether the firm’s drivers of long-term value are translating into financial performance (Kaplan and Norton, 1996). This discussion leads to the first set of hypotheses:
H1: The extent of use of performance measures in evaluating subordinate performance will depend on the source of competitive advantage used by the firm.
H1a: Competitive advantage based on service and employee knowledge is positively associated with the use of customer, employee, and financial measures.
H1b: Competitive advantage based on brand name and reputation is positively associated with the use of customer, employee, and financial measures.
H1c: Competitive advantage based on product features and timing is positively associated with the use of new product and financial measures.
H1d: Competitive advantage based on financial efficiency is positively associated with the use of financial performance measures.
[Insert Table 1]
2.4 The Relation Between Structure and Performance Measure Choice
A fully specified model of organizational control structure includes design choices related to the use of performance measures, the delegation of decision rights, and the level of incentive compensation (Jensen & Meckling, 1976; Milgrom & Roberts, 1992). Although there is extensive empirical evidence that various aspects of organizational structure influence the choice of performance measures (see, e.g.,
Chenhall, 2003), prior accounting research often focuses on the association between only two aspects of the control structure. For example, Nagar (2002) provides evidence on the association between incentives and delegation in the retail banking sector. Abernethy, Bouwens, and van Lent (2004) study performance measurement and delegation, while Moers (2005) investigates how the availability of contractible performance measures is associated with the choice to delegate decision rights. In this study, we extend the accounting literature by considering all three primary aspects of the firm’s organizational design. Specifically, we posit that both decision rights delegation and the use of incentive compensation will be associated with the choice of performance measures used in evaluating subordinate performance. 2.4.1 Delegation of Decision Rights
We examine the association between the choice of performance measures used in evaluating subordinate performance and the delegation of decision rights from the sales and marketing vice presidents to their subordinates. In general, entities will design their performance measurement system based upon the availability of quality performance measures (Grossman and Hart, 1986; Moers, 2005). Given the previously discussed availability of many performance measures in the B2C Internet sector together with the nature of the sales and marketing function, we expect that as the delegation of decision rights increases firms will make greater use of performance measures and that they will rely more upon measures that are informative about the specific decision rights being granted.
Prior literature related to the delegation of decisions finds that divisional managers (or SBU managers) are evaluated on the basis of divisional summary measures. For example, Abernethy and Vagnoni (2004) found that as higher levels of formal authority in the form of decision rights was
delegated to managers, more use was placed on budget information. They argue that linking budget use to evaluation can motivate employees and align behavior with organizational goals. Jensen (2001) similarly contends that a summary measure of divisional performance is effective because divisional managers clearly understand their objective and retain the power to take multiple actions that will influence the summary measure. It follows that the delegation of decision rights within a single function such as the sales and marketing department also requires the appropriate performance measurement and monitoring
techniques in order to align employee behavior with departmental objectives (see also Milgrom and Roberts, 1992).
Hayes (1977) suggests that sales and marketing departments are boundary-spanning functions that must take into account other internal functions such as production and new product development, as well as externalities (e.g., customers, competitors). Accordingly, he proposes that both external and interdependency variables (e.g., new product development) will explain the performance of marketing departments, while summary accounting measures will provide little information. Foster and Gupta (1994) similarly find that sales and marketing personnel are often expected to play a major role in cross-functional initiatives such as new product development, yet these same personnel complain that they are often evaluated solely on performance measures typically thought of as marketing-related (e.g., sales volume) and not on their cross-functional initiatives. Foster and Gupta (1994) therefore conclude that performance measurement systems for sales and marketing departments must change to include measures that are outside of the traditional set of marketing measures.
Sales and marketing departments are also generally characterized as operating in an environment of high uncertainty (Hayes, 1977; Mia and Chenhall, 1994). Certainly the B2C sector at the time of our study was facing a tremendous amount of risk (see, e.g., Bhattacharya, Demers and Joos, 2005). Chenhall and Morris (1986) found that managers in uncertain environments who delegate more also rely more on forward looking, non-financial measures.
In summary, the sales and marketing departments investigated in this study are boundary-spanning units facing high levels of uncertainty and exposure to externalities. Additionally, sample firms have access to a variety of departmental-specific financial and non-financial measures for performance measurement and monitoring purposes, including many measures that may be specific (or proximate) to particular decision contexts. The prior theoretical and empirical literature suggests that as more decisions are delegated firms will rely more extensively on the available performance measures. In the analyses that follow, we investigate the association between the use of performance measures and two sets of decision rights: (1) sales strategy decisions, such as product discontinuations, price setting, and introduction of
new sales strategies, and (2) staffing decisions, such as hiring, terminating, and promoting employees. We expect that the delegation of different sets of decision rights will be associated with greater use of performance measures that are informative about those particular managerial decisions that are being delegated (see summary in Table 1). Ex ante, we expect that the delegation of sales strategy decisions will be associated with greater use of measures across all categories since customer, employee, new product, and financial performance measures will provide relevant information about the different aspects of the strategy decision that must be present in order to successfully execute the strategy (Kaplan and Norton, 1996). Similarly, we expect that the delegation of staffing decisions will be associated with greater use of employee measures, such as turnover, productivity, and number of training hours, since these measures will be informative about the specific set of decision rights being delegated. This leads to the following hypotheses:
H2: The extent of use of performance measures in evaluating subordinate performance will depend on the set of decision rights being delegated.
H2a: Delegation of strategic decision rights is positively associated with the use of customer, employee, new product, and financial performance measures.
H2b: Delegation of staffing decision rights is positively associated with the use of employee performance measures.
2.4.2 Incentive Compensation
Incentive compensation is costly to firms because it imposes risk on employees that are assumed to be risk-averse (Milgrom & Roberts, 1992). In order to manage this costly proposition it is necessary for firms to rely on performance measures that provide information that is useful for monitoring and for aligning employee behavior with organizational goals. Smith (2002) demonstrates that employees’ behavior is driven by the weights placed on the underlying measures and that employees will exert more effort in response to higher-weighted measures.
In addition to the weight of the measure, firms must decide on the type of measure to use in the evaluation system. Aggregate financial measures, such as profitability and return on investment, are less sensitive to the actions of employees and provide less information for performance evaluation (Moers,
2005). Gersbach (1998) refers to this type of measure as a “general” control and analytically demonstrates that employees expend low levels of effort across tasks when compensation is linked to general controls unless the tasks are perfectly equivalent. In contrast, “specific” measures, such as customer, employee, and new product measures, provide detailed information about the various tasks that employees perform and are more sensitive to employee actions. These measures are more precise, which is more effective for incentive contracting purposes (Holmstrom, 1979; Feltham and Xie, 1994). Gersbach (1998) shows that in contrast to general measures, employees focus attention across multiple tasks when they are evaluated on specific measures.
In the B2C sector, “specific” measures (Gersbach, 1998) are readily available for many firms as alternative or supplementary measures of performance (e.g., Demers & Lev, 2001). However, during the period of our study, the B2C Internet sector had evolved towards an increased focus on “monetizing” web traffic, which is measured using “general” controls. That is, there was increased pressure from the providers of capital for Internet firms to attain meaningful financial rather than merely non-financial performance (see, e.g., Schrage, 2000; Ackman, 2001; Business Week, 2001; Shepard, 2000). Thus, we expect that firms that rely heavily on incentive compensation will make use of both “specific” (i.e., employee, customer, and new product categories of performance measures) and “general” (i.e., financial) performance measures in order to monitor and control the use of incentive compensation.
In the high-tech setting of our study, incentive compensation typically consists of a mix of annual cash bonuses and stock options. Therefore, in the analyses that follow, we investigate the association between the use of performance measures in evaluating subordinate performance and two types of incentive compensation: the percentage of compensation received in each of bonuses and stock options, respectively. The literature discussed above suggests that the use of performance measures is positively associated with the level of incentive compensation. In addition, we expect that different types of incentive compensation will be significantly associated with the use of performance measures in different categories. Annual bonus incentives, a short-term reward, compensate employees for current
options have a longer time horizon relative to annual cash bonuses. Financial measures provide feedback on current performance while employee, customer, and new product development measures are forward-looking measures that provide information for a longer time horizon (Kaplan and Norton, 1996). Based on consistency in time horizons, we expect, ex ante, that annual bonus compensation will be significantly associated with the use of financial performance measures while customer, employee, and new product development measures will be associated with the use of stock options. We also expect that firms will use the annual cash bonus to keep employees happy, satisfied, and productive in the short-run; therefore, we expect that the use of employee measures will also be associated with the extent of use of an annual cash bonus.
The above discussion leads to the following set of hypotheses (see summary in Table 1): H3: The extent of use of performance measures in evaluating subordinate performance will depend on the type of incentive compensation used by the firm.
H3a: Increased use of cash bonus compensation is associated with increased use of employee and financial performance measures.
H3b: Increased use of stock option compensation is associated with increased use of customer, employee, and new product measures.
2.5 Control Variables
Our sample consists of high-tech firms in the Internet industry and accordingly we include variables that the prior literature (e.g., Davila, 2005) has found to be important to the determination of management control systems in entrepreneurial settings. Specifically, we control for firm age, the founder acting as CEO, the extent of venture capitalist (“VC”) ownership in the firm, and size.
It is likely that older firms will have more formalized performance measure systems. Davila (2005) finds that age helps to explain the emergence of management control systems, specifically in the human resources arena. This is consistent with the notion that firms learn as they mature and thus are able to implement stronger control systems. Moores and Yuen (2001) conclude that a formal management accounting system varies across life-cycle stages and is a characteristic associated with growth firms. They argue that management control systems are lacking in young firms (i.e., birth firms) and then
increase in importance as firms grow (see also Simons 1995, 2000). As firms grow they require more information and engage in more sophisticated decision-making processes that necessitate a need for a more sophisticated and formal management control system (Davila and Foster, 2005).
Organizations become more formal and structured when the founder, who is more entrepreneurial by nature, is replaced by a professional CEO (Greiner, 1998). Davila (2005) argues that entrepreneurs are vision oriented and may assume that others in the organization share in that vision. Thus founder CEOs are not control oriented since they are not concerned with the need to motivate and align employee behaviors. Accordingly, the use of performance measures throughout the organization may not be emphasized. Venture capitalists could act as an alternative form of monitoring, and thereby reduce the need for a strong performance measurement system. On the other hand, the presence of venture capitalists may cause performance measures to be emphasized. Davila (2005, p. 229) argues that results controls (i.e., performance measure) are increasing in the presence of venture capital due to the informational needs of venture capitalists and due to the desire of venture capitalists to align employee behavior “with the financial success of the firm—through financial and non-financial objectives, which happens through results controls”. Davila (2005) provides empirical support that venture capital and a “new” CEO are associated with increased emphasis on results controls
Finally, it is likely that size influences the use of performance measures. Managers in large firms are inundated with information and the use of a formal performance measurement system can facilitate the manager’s ability to more effectively use the information (Chenhall, 2003).
3. Sample Selection and Survey Methodology 3.1 Sample
We undertake our study in the high-tech business-to-consumer (“B2C”) Internet sector for three primary reasons. First, we are responding to the need for studies of management accounting systems of firms in settings other than large manufacturing, large sample situations (see, e.g., Ittner & Larcker, 2001; Chenhall. 2003). A second reason to study firms involved in Internet commerce is that this sector itself is economically significant in terms of market capitalization and wealth creation within the broader
economy. The final reason to undertake our study of the multi-dimensionality of performance measures in this setting is the evidence that non-financial and financial measures of performance play a role in the evaluation of B2C Internet firms (e.g., Rajgopal, Kotha & Venkatachalam, 2000; Trueman, Wong & Zhang, 2000) even after the stock market correction in 2000 (Demers & Lev, 2001). Thus, overall the B2C sector provides a representative, economically significant, setting in which to generally broaden the scope of management accounting research and in particular to examine questions related to the multi-dimensionality of performance measures.
Our focus on a single department within B2C firms is a natural extension of the earlier management accounting literature that has treated the firm itself as the unit of observation. Our study relaxes the implicit assumption in prior research that management control systems are consistent throughout the organization. We select the sales/marketing function because the customer list and brand building responsibilities of this department are critical to the success of consumer-oriented Internet companies, while revenue generation became overwhelmingly important in the Internet sector during the period of our study. Thus, the sales/marketing department, which is common to all B2C firms, was also a strategically important function of Internet firms during the period of our study.3
Consistent with prior studies in this sector (e.g., Hand, 2001; Demers & Lev, 2001) we define Internet companies as firms that earn the majority of their revenues as a result of the existence of the Internet.4 We identify a sampling frame of publicly traded Internet companies from the
InternetStockList™ in April 2001 (provided by internet.com at http://www.internetnews.com/stocks/list/), a frequently cited and authoritative list of currently trading Internet companies. We define the companies as B2C Internet firms if they fall into any of the following Internet subsectors: e-tail,
3
The other primary functional area that emerged from our pilot interviews with B2C Internet executives was the operations department. Given the nature of the B2C service/merchandising sector, however, this department tended to be more technical in nature and served as the infrastructural backbone rather than being involved in strategic business decisions.
4
This definition was originally established by internet.com, an authoritative portal site on Internet firms, in order to distinguish between “pure play” Internet companies and entities that would exist without the Internet generating a majority of their revenues.
content/communities, financial news/services, portal, services, and advertising.5 We then extend our sampling frame to include a number of large, non-publicly-traded B2C Internet firms identified from the highest traffic sites in the Nielsen//Netratings database for April 2001. This resulted in a sampling frame of 99 candidate B2C firms for potential inclusion in the study.
Our final surveyed sample consists of 53 B2C Internet companies out of a potential pool of 87 firms that were determined to have ongoing operations at the time of our field visits.6 The remaining 34 companies either declined to participate or did not respond to our numerous telephone and email attempts to arrange an interview. A full summary of how we arrived at the final sample is presented in Table 2. Our response rate of approximately 61% (53/87) compares favorably to other recent surveys involving senior executives of large firms, such as Graham and Harvey (2001)’s response rate of 9% of the CFOs surveyed and Keating (1997)’s response rate of 45% of division managers surveyed.7
[Insert Table 2]
Notwithstanding our favorable response rate, we test for possible self-selection bias by comparing the characteristics of firms included in our sample to those of targeted firms that did not participate in the survey. On average, our sample firms are somewhat smaller than the group of non-participants, with median sales of approximately $40 million and total assets of $114 million versus $135 million (p=.005) and $459 million (p=.003), respectively, for non-participating B2C firms. However, the two groups do not differ on the basis of profitability, stock price performance, or web traffic. The median ROA for sample firms is –41% versus –34% for non-sample firms (p=.55), the median stock return for calendar 2000 is – 89% for sample firms versus –88% for non-participants (p=.89), and the median page views for the sample is 49 million versus 63 million for non-participants (p=.90).8 Thus, although our sample firms are
5
The subsectors were identified from the classification scheme provided by Wall Street Research Net © WSRN.com (http://www1.wsrn.com/icom_index/index.xpl), where available, or from a review of the business description provided on the company’s own website.
6
By the time of our survey, seven companies had ceased operations and five were under reorganization. 7 For further comparison, earlier studies’ response rates are as follows: Shields and Young (1993) (20%), Shields and Young (1994) (56%), and Foster and Gupta (1994) (23%).
8 The financial statement data for non-respondents is obtained from Compustat, where available, or by hand-collection from annual reports as necessary. Non-financial web traffic metrics are obtained from the
somewhat smaller, they do not differ with respect to financial or web traffic performance.
As shown in Table 3A, participating firms cover all segments of the B2C sector, with the primary two segments represented in our sample being content/community and e-services. Further descriptive statistics for our participating firms are presented in Table 3B and reflect that, although our sample consists of many of the major players in the Internet sector, the sample firms are relatively small, with mean (median) sales of approximately $161 ($40) million and mean (median) total assets of $386 ($114) million. The sample firms employ 688 full-time equivalent persons, on average, with the median firm employing 180 people. Consistent with general performance results for B2C Internet firms during our sample period, these firms report negative mean and median net income figures of -$222 million and -$40 million, respectively.9 The sample firms generate considerable web traffic, with a mean (median) of 530 (49) million page views and 6.4 (3.3) million unique visitors to their websites each month. Sample firms report that they generate approximately 51% of sales, on average, from repeat customers and the average (median) number of employees in the sales/marketing department is 68(25).
[Insert Table 3] 3.2 Survey Design and Implementation
Our survey employs a questionnaire that elicits information about a number of characteristics of the firms’ sales/marketing departments, including: the design of performance measure systems, evaluation and rewards for the average employee within the department, firm strategy and environmental factors, the delegation of decision rights, firm ownership, and size measures. The final survey evolved through a series of interviews as discussed below.
Based upon a review of the existing academic literature and extensive research into the Internet sector, we developed an open-ended interview questionnaire to be used as a basis for discussion with B2C Internet experts and executives. We first met with a leading venture capitalist in Silicon Valley who has been actively involved in corporate investment and governance of Internet firms since the inception of the
Nielsen//Netratings Audience Measurement database, and stock market data are derived from the CRSP database. 9 Although not a primary purpose of our study, an added benefit is that we provide insights relevant to loss-making firms.
commercialization of the Internet in the mid-1990s. We then used the questionnaire to interview senior executives at five Internet firms in Silicon Valley that operated in different B2C Internet subsectors. Each of the meetings lasted approximately 60 to 90 minutes, involved discussions with the Internet companies’ CEOs and several other high-ranking executives, and provided us with insights into general B2C firm characteristics, as well as variables related to key constructs underlying our study, including: the responsibilities associated with different functional areas within the firm, aspects of corporate performance measurement systems, the delegation of decision rights both across functional areas and down the hierarchy within functional areas, and competitive and market conditions affecting the firm’s environment. Relying on the detailed responses that we received in these field visits, we constructed a draft of the questionnaire that would ultimately form the basis of our survey instrument.10
We pretested the survey instrument with 5 academic colleagues, each of whom had expertise in the Internet sector, marketing and corporate strategy, and/or research survey design. We also pre-tested the survey separately on each of the co-authors. In every pre-test, the time required to complete the survey was noted and any ambiguities in the survey questions were identified. Based upon the feedback obtained through several such iterations, we shortened the survey and reworded various questions.
In order to enlist the vice presidents of the sales/marketing department from the Internet firms to participate in our study, we contacted firm representatives by telephone and/or by email. We identified the VP Sales/Marketing executive to be targeted at each firm by reviewing the company’s corporate website and/or via requests for the relevant corporate officer from the firm’s receptionist. Upon request, we provided the targeted interviewee with information related to the nature of our survey, our respective university affiliations, the estimated time required to complete the survey, a guarantee of confidentiality over the information disclosed and full anonymity in the reported results, a commitment to provide participants with a copy of our completed report, and details of the sponsorship of our study by the Chartered Institute of Management Accountants (“CIMA”). We did not in any case disclose the
10
The firms that we interviewed during this pilot study phase are characteristically similar to our sample firms, however the pilot firms are not included in the sample that we use to conduct our empirical tests.
questionnaire prior to its ultimate implementation to consenting firms’ sales/marketing executives. The survey was implemented using two different mechanisms. On-site interviews were conducted for the 35 (66%) sample firms that were concentrated within particular geographic areas (e.g., New York City, Silicon Valley, Southern California, and Chicago) or that were otherwise accessible by one of the authors. Telephone interviews were conducted for the remaining 18 (34%) firms that were individually isolated in other parts of the U.S. and/or that could not otherwise be scheduled for in-person visits. At the outset of both telephone and in-person interviews the participant was provided with a handout that depicted the scales used for many of the questions in the survey. We provided this handout in order to maximize the consistency with which interviewees understood the scale to be applied to each question, and to thereby minimize noise in the survey’s responses. Consistent with the time allotment that we requested from participating executives when we scheduled our appointments, the surveys took approximately one hour, on average, to implement. The surveys were conducted from the end of June 2001 through January 2002, with the majority of the interviews taking place during the summer of 2001.
Each interview involved the implementation of the structured questionnaire. The questionnaire was not provided directly to participants, but rather was read aloud to the interviewees by one of the co-authors of this study. We attempted to anticipate those questions that were most likely to require
clarification and/or supplementary definitions, and included standardized clarifications for verbal delivery to interviewees on the survey instrument. In order to ensure consistency, all three authors adhered strictly to the structured questionnaire for delivery of questions and clarifying comments. Ad hoc, or otherwise unstructured follow-up questions to the interviewees’ responses, were not admitted into the process until after the conclusion of the formal administration of the questionnaire.
Our survey design and implementation were structured to mitigate several of the most common criticisms of survey-based research, including: concerns over the identity of the respondent, the possibility that respondents had experienced unresolved interpretation difficulties while completing the survey, lack of investigation of non-response bias, use of outdated survey instruments, and lack of
necessary institutional knowledge.11 First, because we spoke directly to the respondents, we have assurance that the relevant executive within each firm completed the survey. Second, because the authors read the survey to the respondents and had standardized a set of clarifying comments for any potentially ambiguous questions, we were able to address any confusion arising from the interpretation of our survey questions. Third, since we attempted to contact all firms by telephone, we have a precise list of firms that chose not to participate in the study, thus facilitating an assessment of non-response bias. Fourth, since we developed our own instrument for this study, we were able to tailor the survey to firms competing in the B2C Internet sector. Finally, we were able to gain institutional knowledge prior to the development of the final survey instrument through our preliminary field visits.
4. Empirical Tests
4.1 Measurement of Performance Measures: Dependent Variables
Ittner and Larcker (2001) note that inappropriate survey design is a weakness that may contribute to the mixed results in performance measurement research. Survey questions often lack specificity, simply asking respondents about the extent of use of a particular measure without specifying the context (e.g., compensation, capital justification, etc.). This could lead to inconsistencies across respondents if managers answer with respect to different decision contexts. Our survey methodology overcomes this potential pitfall by specifying the evaluation of subordinate performance as the particular decision context in which the use of performance measures is being rated.
Four categories of performance measures are important to the sales/marketing VPs in their evaluation of subordinates. These include customer (CUST), employee (EMP), new product (NPROD), and financial (FINL) measures.12 We develop a composite measure for each of the four categories of performance measures, and use each such composite as the dependent variable in separate regression analyses. Our composite measure for the customer-related performance variable, for example, is
11
See Young (1996) for a discussion of survey research.
12 We also obtain survey response related to the use of web and operating measures; however, untabulated results and analyses of these data suggest that they are not significantly used by the sales/marketing VPs in our sample for the evaluation of their subordinates. The mean use of web measures was 1.81 while the mean use of operating measures was 1.95, on a 7-point scale (1 = no reliance; 7 = rely heavily).
computed as the average value on a scale of 1 to 7 as assigned by respondents to a series of customer-related measures in response to the question, “How important is this metric in the evaluation of your subordinates?” The particular measures underlying each of the four respective categories of performance measures are summarized in detail in Table 4. The identification and ultimate classification of the measures into each of the four performance measure categories was established during the development and pre-testing of our survey with Internet executives and other industry experts, and was agreed upon by all three authors of the study. Furthermore, the Cronbach’s alpha for the use of measures in each of the four panels is greater than 0.7, suggesting that we have an internally consistent set of variables underlying each of the four summary performance measures (Nunnally, 1978). We find that the average use of customer, employee, new product, and financial measures in evaluating subordinate performance is 3.61, 3.50, 3.67, and 3.67, respectively.
[Insert Table 4]
4.2 Measurement of Determinants of Performance Measures: Independent Variables 4.2.1 Strategy Constructs
We measure strategy as the firm’s source of competitive advantage. We develop our empirical measures by running a factor analysis on the sources of competitive advantage survey questions summarized in Panel A of Table 5. 13 The scores in Table 5A represent answers on a 7-point scale regarding the extent to which each of the items listed is a source of competitive advantage for the firm, where, after reverse coding, a 1 indicates that the item is not a source of competitive advantage to the firm (i.e., the firm is equivalent to its competitors) and a 7 indicates that the item is a major source of
competitive advantage to the firm. The results of the factor analysis on these survey questions are presented in Panel A of Table 6. As shown, the factor analysis resulted in an extraction of five factors with Cronbach’s alphas in excess of .62, which we respectively label Service and Employee Knowledge (CA_SEREMP), Brand Name and Reputation (CA_BRAND), Product Features and Timing (CA_PROD),
13
We compute these factors using the varimax rotation following Hair, Anderson, Tatham and Black (1998) who recommend an orthogonal rotation in circumstances where the objective is to reduce a large set of variables to a smaller number of uncorrelated factors for subsequent use in regression analysis.
Speed Customization and Ease of Use (CA_OPS), and Financial Efficiency (CA_FEFF).14 [Insert Table 5]
[Insert Table 6] 4.2.2 Structure Constructs
As explained in Section 2, we adopt what we consider to be the most fully specified form of organizational structure, which includes performance measures, the delegation of decision rights, and incentive compensation as the three primary aspects of organizational design (Jensen & Meckling, 1976; Milgrom & Roberts, 1992). Using performance measures as our dependent variables, we investigate their associations with each of decision rights and incentive compensation, respectively.
Our empirical measures for the delegation of decision rights are developed by running a factor analysis, similar to the one described above, on the delegation of decision rights survey questions summarized in Panel B of Table 5. Specifically, after reverse coding the responses, the scores represent answers on a 7-point scale regarding the extent to which decision rights are delegated to subordinates, where 7 represents full delegation of decision rights and a 1 represents no delegation (i.e., the decision rights are retained by the VP of sales/marketing). The results from the factor analysis are presented in Panel B of Table 6. As shown, the variables load onto two factors, which we label as decision rights over personnel (DR_STAFF) and decision rights over strategy (DR_STRAT). The two factors explain a significant amount of the total variance and both have Cronbach’s alphas above .70.
We measure incentive compensation using two questions that capture the percentage of subordinates’ compensation that is derived from bonuses (%BONUS) and stock options (%OPTION), respectively. These measures are obtained directly from survey respondents and the descriptive statistics associated with these measures are presented in Panel B of Table 5. The firms in this sample provide, on average, 22.47% of compensation in the form of annual bonuses and 7.84 % in the form of stock
14Ex ante we expected that CA_OPS would be associated with web traffic metrics and operations metrics; however, we ended up removing these performance measures from our analyses and thus do not use CA_OPS in the analysis.
options.15
4.3 Control Variables
We control for entrepreneurial factors and size, both of which will likely influence the use of performance measures. The descriptive statistics are reported in Panel C, Table 5. We include an indicator variable which is set equal to one when the founder remains as the firm’s CEO (CEO_F). We measure this variable using a survey question that asks the respondent to indicate whether the founder of the firm is currently the CEO. Fifteen of the 53 firms have a founder CEO (28.3%). We measure the extent of ownership by venture capitalists using a survey question that asks the respondent to identify what percentage of the firm’s outstanding shares are owned by venture capitalist shareholders (%VC_OWN). Venture capitalists have an 8% ownership interest, on average, for the firms in this sample. We verify the survey responses for both CEO_F and %VC_OWN against information reported in each firm’s proxy statements to ensure that the survey responses are accurate.16 We measure the firm’s age (AGE) using a survey question that asks the respondent how long the firm has been in existence in years and months. On average, the firms in our sample have been incorporated for 7.91 years. Finally, we control for size using the natural log of total assets reported on Compustat (LN_SIZE). We replace missing values (for the privately-held firms) with the mean of the sample in order to avoid losing observations. On average, our firms have $386.2 million in total assets.
4.4 Summary of Constructs and Identification of Model
In the following section we run four separate regression analyses, each of which uses a different dependent variable respectively capturing the use of customer, employee, new product, and financial performance measures in evaluating subordinate performance. After controlling for various
entrepreneurial variables and size, we expect that the use of performance measures across the multiple categories will depend on the source of the firm’s competitive advantage, the set of decision rights being
15
This is consistent with the information that we received during our pilot interviews. Employees were concerned with the number of options they received, especially in conjunction with hiring; however, cash-in-hand was the critical component of compensation during the period of our study.
16 We were able to obtain proxy statements for the public firms in our sample. For those firms we verified the survey response against the information contained in the proxy. For privately-held firms, we used their survey response.
delegated, and the type of incentive compensation being used. To provide evidence on our hypotheses, we run the following model:
Y1-4 = a + b1CA_SEREMP + b2CA_BRAND + b3CA_PROD + b4CA_FEFF + b5
DR_STAFF + b6 DR_STRAT + b7%OPTION + b8 %BONUS + b9 CEO_F + b10 %VC_OWN + b11 AGE + b12 LN_SIZE + e
Where,
Y1-4= use of performance measures where 1 is CUST, 2 is EMP, 3 is NROD and 4 is FINL,
In the tabulated performance measure regression results we include all strategy and structure variables. However, in the interest of presenting the most parsimonious model, we only include the significant control variables in our tabulated results.
4.5 Empirical Results
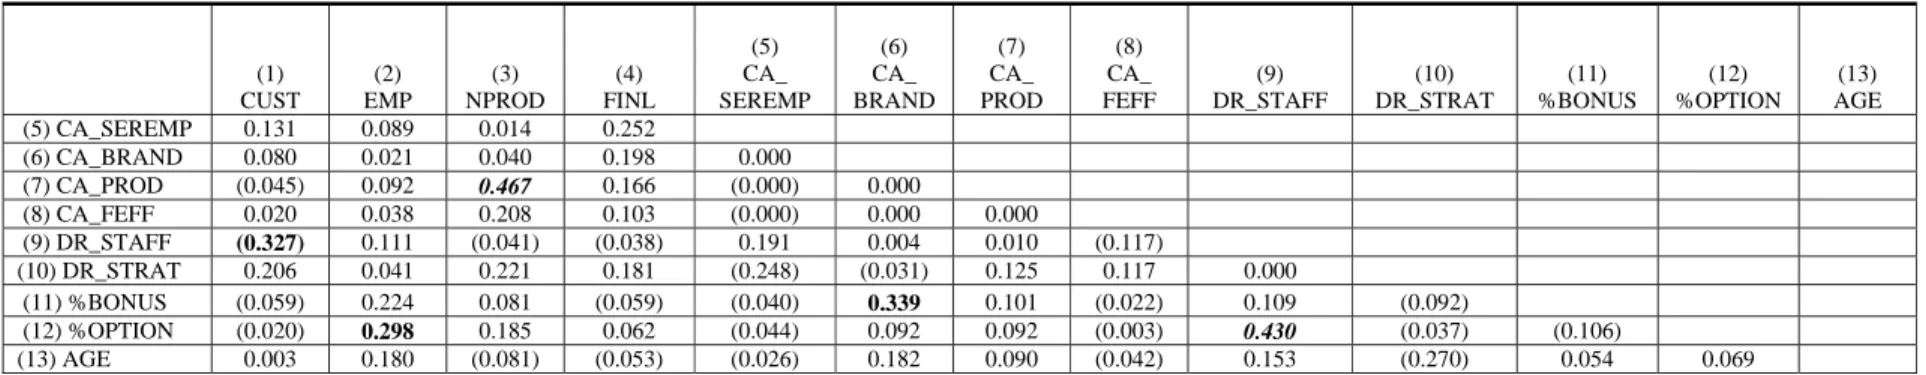
The correlations between the variables included in each of the four performance measure regressions are shown in Table 7. The regression results for each of the customer, employee, new product, and financial performance measures are shown in Table 8, Panels A through D, respectively. The adjusted R-squares for the four regressions range from approximately 8% to 21%.17 The variance inflation statistics suggest that we do not have a multicollinearity problem.18
[Insert Table 7] [Insert Table 8] 4.5.1 Customer-Related Performance Measures
The regression results explaining the use of customer measures are presented in Panel A of Table 8. As expected, we find that the use of both strategy and structure factors are significantly associated with the firm’s use of customer-related measures. CA_SEREMP, is significantly positive (p < 0.05), indicating that the more important service and employee knowledge are as a source of competitive advantage to the firm, the more customer measures are used in evaluating subordinate performance. This suggests that in environments where service and employee knowledge are critical success factors, the firm relies on
17 If we drop the insignificant independent variables and report the most parsimonious models the adjusted R squares would increase. For example, the adjusted R square for the regression explaining the use of financial measures would increase from approximately 8% to 12%.
18
customer measures to evaluate their employees. This is consistent with the service operations and marketing literatures that emphasize the roles that employees and service quality have on customer outcomes such as satisfaction (Heskett, Sasser & Schlessinger, 1997; Rust, Zeithaml, & Lemon, 2000).
Both of the decision rights variables and one of the incentive variables, %OPTION, are significant. The negative coefficient on DR_STAFF (p < 0.01) and positive coefficient on DR_STRAT (p < 0.05) suggests that customer measures are used more for evaluation purposes when the decision rights over staffing (e.g., hirings, terminations, and promotions) are retained at higher levels within the
department (i.e., delegated less) and when decisions over strategy, pricing, and product lines are delegated more (p < 0.05). The latter result is consistent with our argument that VPs will evaluate their subordinates on measures that are informative about the delegated decision rights.
The positive coefficient on the percentage of pay from stock options suggests that as the stock incentive compensation increases, more weight is placed upon the use of customer-oriented performance measures (p < 0.10). This is consistent with the notion that, as employees receive more incentive pay, their evaluation is based upon more informative measures of performance.
4.5.2 Employee-Related Performance Measures
As shown in Panel B of Table 8, structure and strategy are significantly associated with the use of employee performance measures. The positive coefficient on CA_SEREMP (p < 0.10) suggests that as the firm extracts a greater competitive advantage from service and employee knowledge, they place more weight on employee measures. This result is consistent with previous literature that shows that firms align their use of performance measures with the firm’s strategy (e.g., Langfield-Smith, 1997). Consistent with our expectations, delegation of strategy-related decision rights, DR_STRAT, is significant (p < 0.10). The positive coefficient indicates that VPs rely more on the use of employee measures when they delegate more strategic decisions to their subordinates. Both %BONUS and %OPTION are positive, which is consistent with our expectations that higher levels of incentive compensation are associated with greater use of performance measures (p < 0.01 and p < 0.01, respectively). We also find that AGE, is significant (p < 0.05). The positive coefficient indicates that the firm relies more on the use of employee measures as
it matures. This is consistent with expectations that firms implement more formal control systems and rely more on performance measures with age.
4.5.3 New Product-Related Performance Measures
The results of the regression of new product performance measures on strategy and structure are reported in Panel C of Table 8. As hypothesized, strategy and structure are significantly associated with the use of new product measures. The positive significance (p < 0.01) of CA_PROD is consistent with the notion that firms that draw more of their competitive advantage from product features and timing place significantly more weight on new product measures. We also find that CA_FEFF is significantly associated with the use of new product measures (p < 0.10) indicating that as firms rely more on superior inputs and financial efficiency, they rely more on the use of new product measures. Consistent with our expectations, delegation of strategy-related decision rights, DR_STRAT, is significant (p < 0.10). The positive coefficient indicates that VPs rely more on the use of new product measures when they delegate more strategic decisions to their subordinates. Finally, consistent with our expectations, we find that %OPTION, a type of incentive is significant (p < 0.05). The positive coefficient suggests that higher levels of stock option incentive pay correspond with greater use of new product measures. This is consistent with the notion that firms offer longer-term compensation and a mechanism for bonding employees to the firm, which corresponds with the slightly longer term perspective underlying new product launches.
4.5.4 Financial Performance Measures
As shown in Panel D of Table 8, strategy and delegation of decision rights are significant determinants of the use of financial measures. Two of the four sources of competitive advantage, CA_SEREMP and CA_BRAND, are significant (p < 0.01 and p < 0.10, respectively). The positive coefficients are consistent with our expectations that firms that derive competitive advantage from service and knowledge, and from brand name and reputation rely on financial measures. Financial measures provide information regarding the final outcome of whether the firm is successfully exploiting its competitive advantage and translating it into financial returns. In addition, as VPs delegate more strategic
decisions to subordinates, they rely more on financial measures to evaluate them (p < 0.05). 4.6 Specification Checks
The proxy for the use of financial measures primarily includes summary measures such as net income, return on equity, revenues, and budget information. In the development of our other dependent variables, we include financial measures that specifically capture the customer, employee, and new product perspectives in each of those respective measures, and in the main tabulated results we do not allow any such underlying measures to be “double-counted” into both of the financial and employee, customer, or new product performance measures. For example, we include revenue exclusively in the financial category and revenue from new products exclusively in the new product performance measure category. Similarly, we include net income in the financial category but customer profitability in the customer measure category. Prior literature typically calculates the use of performance measures as either financial or non-financial, in which financial measures includes all measures that are expressed in dollars or derived from dollars. As a robustness test, we therefore recalculate the use of financial performance measures using all performance measures across the four categories that are financial in nature. We denote this measure NEWFINL and find that NEWFINL is correlated 0.898 with FINL. Moreover, a regression of NEWFINL on the previous explanatory variables results in a model with similar statistical inferences (i.e., the statistical inferences on CA_SEREMP and DR_STRAT are unchanged and the adjusted R square is approximately 7%).
5. Conclusions and Discussion
In this study we explore two research questions. First, after controlling for entrepreneurial factors, do strategy and structure factors drive the use of performance measures for the evaluation of subordinates in high-tech firms? Second, do the dimensions of strategy and structure vary across different categories of performance measures? Overall, the results in Table 8 show that strategy and structure (i.e., delegation of decision rights and incentives) significantly explain the use of customer, employee, new product, and financial measures. Our results also suggest that different dimensions of strategy and structure explain the use of performance measures in different performance measure categories, which is consistent with the
dominant paradigm in practice that performance measurement systems are multi-faceted in nature (e.g., the balanced scorecard). Our results provide support for thirteen of the nineteen relations we expect to find, ex ante, between specific dimensions of strategy, structure, and the use of performance measures. Thus H1, H2, and H3 are supported.
We find that the use of performance measures in evaluating subordinate performance depends on the source of competitive advantage being used by the firm (H1). For example, VPs rely more on customer, employee, and financial measures if their competitive advantage arises from service and employee knowledge. We find significant associations between the use of new product measures and a competitive advantage based on product features and timing, while the use of financial measures is associated with a competitive advantage based on brand name and reputation. These findings demonstrate that while competitive advantage is a significant explanatory variable for the use of performance
measures, the use of particular measures across performance measure categories varies by the type of competitive advantage the firm relies upon.
We find that the use of performance measures in evaluating subordinate performance depends on the set of decision rights being delegated (H2). Specifically, VPs rely more on measures across all four categories of performance measures when they delegate more strategic sales and pricing issues to subordinates. Unexpectedly, we find that VPs rely more on customer measures when they delegate fewer human resource decisions to their subordinates. One possible explanation is that even though VPs retain decision rights over hiring and firing, they nevertheless increase their reliance on customer measures in evaluating their subordinates in order to provide an “indirect” check on personnel decisions. Similarly, in an environment where customer satisfaction is important, the results are consistent with the notion that VPs hold their subordinates responsible for motivating and inspiring the workforce to ensure quality customer service even when their subordinates do not have responsibility for the originating personnel decisions. Both of these explanations are ex post rationalizations of our findings, however, and future research could shed important insights into these relations.