Interactive Principal Component Analysis
Harri Siirtola
TAUCHI Research Center, COMMS University of Tampere
Tampere, Finland Email: [email protected]
Tanja S¨aily
Department of Modern Languages University of Helsinki
Helsinki, Finland Email: [email protected]
Terttu Nevalainen
Department of Modern Languages University of Helsinki
Helsinki, Finland
Email: [email protected]
Abstract
Principal Component Analysis (PCA) is an established and efficient method for finding structure in a multidimensional data set. PCA is based on orthogonal transformations that convert a set of multidimensional values into linearly uncor-related variables called principal components.
The main disadvantage to the PCA approach is that the procedure and outcome are often difficult to understand. The connection between input and output can be puzzling, a small change in input can yield a completely different output, and the user may often wonder if the PCA is doing the right thing. We introduce a user interface that makes the procedure and result easier to understand. We have implemented an interactive PCA view in our text visualization tool called Text Variation Explorer. It allows the user to interactively study the result of PCA, and provides a better understanding of the process.
We believe that although we are addressing the problem of interactive principal component analysis in the context of text visualization, these ideas should be useful in other contexts as well.
I. INTRODUCTION
Principal Component Analysis (PCA) is a method for find-ing projections of maximal variability in multidimensional data. PCA uses orthogonal transformation to convert a set of possibly correlated variables into a set of linearly uncorrelated variables which are called principal components. The first few principal components retain most of the variation present in all of the original variables, making PCA an efficient method to reduce dimensionality and reveal structure in the data.
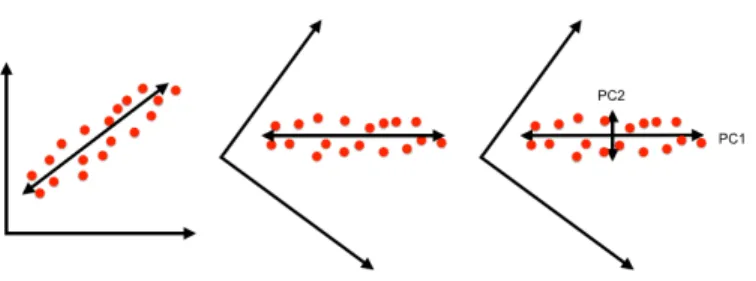
Informally, suppose we have a two-dimensional data set as in Figure 1. On the left, the largest variation is indicated with an arrow, which becomes the first principal component and the new x-axis. The new y-axis is orthogonal to the x-axis, and now these two dimensions capture the variation in the data. This approach generalizes into arbitrary dimensions. Detailed description is beyond this paper – please see e.g. [6] or [16].
Fig. 1. Finding principal components in the 2D case.
According to Jolliffe [8], it is generally accepted that PCA as it is known today originates from the work of Pearson [10] and Hotelling [5].
A. The problem
We are developing a text visualization tool where the ex-ploration of text variation by clustering is an essential feature. Our tool clusters the text according to word frequency vectors defined by the user, and the method is based on principal com-ponent analysis. Our tool has been used by language students (students of both the English and the Finnish language) and we have collected feedback of their experiences. It is clear that most users find the PCA clustering both confusing and difficult to understand. There are earlier interactive principal component analysis tools (e.g. [7], [4]), as well as many general-purpose visualization and analysis tools that can be applied (e.g. [1], [9]), but they are targeted at experts. This paper describes our attempts to make the PCA technique more approachable through interactive visualization.
In this paper, we describe the current state of TVE, and the new user interface for its principal component analysis. While we are addressing the problem in this specific application, we believe that the ideas are useful in other contexts as well. As a technique, PCA is clearly useful, and it might be used more widely if its use was easier to apply.
II. TEXTVARIATIONEXPLORER
Text Variation Explorer (TVE) is an interactive text vi-sualization tool for sociolinguistic research [12]–[14]. This section describes its current state and how principal component analysis is used in the application.
© 2017 IEEE. Personal use of this material is permitted. Permission from IEEE must be obtained for all other uses, in any current or future media, including reprinting/ republishing this material for advertising or promotional purposes, creating new collective works, for resale or redistribution to servers or lists, or reuse of any copyrighted component of this work in other works. doi:10.1109/iV.2017.39
A. Overview
TVE is based on the idea of wrapping a text corpus and visualization tool into one package. The aim is to keep the corpus study as simple as possible, but still provide interactive visualization tools to explore the content. There is only one item to install, and the Java archive can be placed anywhere. The actual corpus resides inside the jar file as plain text files and can be easily replaced. Similarly, a text file named
metadata.txtmust exist along with the corpus, and there must be a column calledIDwhich contains all the file names in the corpus. In addition, there must be a column calledYear
that gives the year of the text sample. The metadata file is also a plain text file with tab-separated columns. Beside the ID
and Year columns the rest of the file can contain whatever is desired.
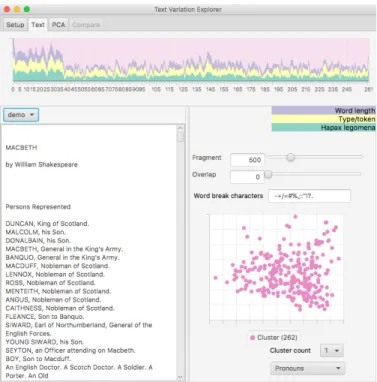
TVE has a clustering facility which is based on user-defined lists of words. These are defined by creating a plain text file, one word per line, in a sub-directory called clusters. TVE will compute the frequency of these words in each text fragment and perform principal component analysis and clustering according to them. The names of the cluster word files appear in a popup menu next to the PCA view (Figure 2).
Fig. 2. TheTexttab with a line graph of three linguistic measures.
The corpus-based study of sociolinguistic phenomena usu-ally requires sampling the corpus with some criteria. TVE has a Setup tab where text samples can be constructed by querying the corpus with metadata constraints (Figure 3).
Fig. 3. TheSetuptab of the Text Variation Explorer application: defining corpus subsets for analysis.
The Setup tab contains a range slider to focus on the desired time period, a preview of the currently selected corpus texts, a list of metadata items, and a list of defined text samples. The preview and selected percentage of corpus texts is updated as the selection criteria are manipulated. Finally, after the desired subset has been found, it can be saved as a text sample. The next tab,Text, displays a line graph of three linguistic measures, the complete text of the text sample, and a scatter plot of the PCA analysis (Figure 2).
TVE quantifies text by computing three linguistic measures:
• Hapax legomena: the proportion of words appearing
exactly once
• Type/token ratio: the proportion of different words
(‘types’) out of all words (‘tokens’)
• Word length:the average length of words in a sample
These measures quantify style and vocabulary richness, which tend to vary between genres and even authors. The measures are displayed as a stacked line graph at the top of theText tab (Figure 2).
B. Interacting with text
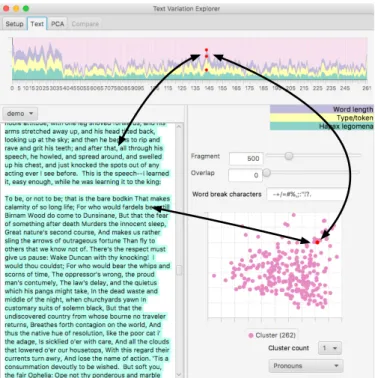
The main interactive feature in TVE is the movement between text and visualizations. Selecting a text fragment in any of the three views will highlight (or brush) the same fragment in others (Figure 4).
Fig. 4. Selecting a text fragment will highlight it in other views.
Another essential interaction in TVE is changing the size of the text fragments. There is a slider for both fragment length and overlap, and their manipulation will continuously update the visualizations.
Selecting a point in the line graph reveals the connected text, but it does not show any metadata. If the text sample is constructed from hundreds of separate texts, this will be a problem. This is solved with a visual query – as the mouse hovers over the line graph, a popup window shows metadata for the underlying text fragment (Figure 5).
Fig. 5. Metadata revealed when mouse hovers over a text fragment.
By default, the hover query shows theIDand text fragment number of the underlying text, along with the values of the three linguistic measures. Any metadata item can be added to the popup window by checking the corresponding Show
checkbox on the Setuptab’s Metadata list (Figure 6).
Fig. 6. Extending visual query for the metadata items.
C. Sample session with TVE
To give an example, suppose we would like to compare two fairly different texts, written almost 300 years apart, and belonging to different genres. The first one is the playMacbeth by William Shakespeare [11], and the second one is the novel
Adventures of Huckleberry Finnby Mark Twain [15]. When
we look at the line graph of linguistic measures, it is obvious that Macbeth ends around text fragments 26–27 (Figure 7), which can be easily verified by using a hover query. All linguistic measures are higher in the Shakespeare play, and the use of the English language appears considerably richer.
Fig. 7. Shakespeare’sMacbethfollowed by Twain’sHuckleberry Finn.
An interesting observation is that there is a part in Huckle-berry Finn that appears to have similar ‘fingerprint’ or measure values as Macbeth. This turns out to be a Shakespearean play within Huckleberry Finn, even having a soliloquy that highly resembles the original (Figure 9,“To be, or not to be; that is the bare bodkin. . . ”).
III. INTERACTIVEPRINCIPALCOMPONENTANALYSIS The second method of clustering text fragments in TVE is principal component analysis. The user defines a list of words she or he is interested in, and TVE clusters the text according to the frequency of those words in each text fragment. In Figure 8 we have two examples of typical wordlists: Binongo’s list of function words [2], and a list of personal pronouns in English.
A function word is a word whose purpose is to contribute to the syntax rather than the meaning of a sentence, for example doinwe do not live here. Basically, function words could be removed altogether without compromising the lexical content of a sentence, but they constitute a skeleton around which the body of the text is built. The usage of function words often reveals idiosyncratic patterns in a writer’s style, and can be used, e.g., for authorship attribution, as Binongo [2] has done. The list of personal pronouns is self-explanatory.
Fig. 8. Two examples of cluster word lists: Binongo’s function words and personal pronouns in English.
Fig. 9. A passage inHuckleberry FinnresemblingMacbeth. The word frequency lists are flattened into 2D by using PCA, and TVE displays the first two principal components as a scatterplot (Figure 10). In addition, the flattened PCA nodes can be clustered into two or three clusters. Limiting the view to the first two principal components and at most three clusters is a design choice, in the hope that the result does not become too difficult to interpret, and to prevent over-interpretation.
TVE displays the PCA view in both the Text and PCA
tabs. In the Text tab the PCA view provides an overview, and the third chance to select a text fragment that is potentially interesting (Figure 4). In the PCA tab, the scatterplot for the first two principal components is more detailed, and provides richer interaction.
A. Interacting with the PCA view
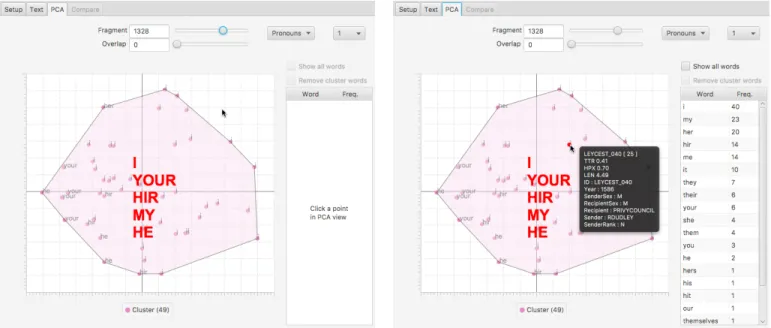
In Figure 10, the most frequent words of a text fragment cluster are displayed in the center of the cluster in a large red
font type. For each text fragment, the most frequent word used for clustering is displayed as a label for the node representing the fragment. As in theTexttab, these texts are continuously updated as the fragment size and overlap sliders or cluster count are manipulated. Hovering the mouse over a PCA node will show the corresponding metadata, again as in the Text
tab (Figure 5).
Selecting a single text fragment in the PCA view displays its word frequencies, in a descending order (Figure 10). By default, the list shows the frequencies of words that were used to cluster the text. The list can be expanded to show the frequencies of all words in the text fragment, and the cluster words can also be filtered out, leaving the frequencies of words that were not included in the clustering.
B. Example
Let us take an example from the history of English, the time of Queen Elizabeth I. The Leycester collection in the Corpus of Early English Correspondence Sampler [3] chiefly contains correspondence between Robert Dudley, Earl of Leycester, and two of Elizabeth’s most important government officials, William Cecil (Lord Burghley) and Sir Francis Walsingham. How does their language use pattern in the PCA view? Figure 11 (left) shows the situation for our list of personal pro-nouns (augmented by Early Modern English spelling variants, e.g.hir forher). The letters written by Cecil and Walsingham are grouped together in a single (green) cluster, the most frequent pronouns of which are I,your and my. By contrast, Dudley’s pronoun use seems to be much more varied, and his letters are split into two clusters. The pink cluster at the bottom mostly consists of letters written to Walsingham, while the brown cluster contains letters written to both Cecil and Walsingham. When we cluster the texts according to Binongo’s function words in Figure 11 (right), similar results emerge: the letters written by Dudley differ from those written by Cecil and Walsingham.
How can we interpret these results? By exploring the letters in the text view, we can see that Cecil and Walsingham frequently address Dudley with the phrasesyour lordship or my lord, which could explain their overuse of the pronouns your and my. Dudley’s letters to Walsingham do not contain these expressions because Walsingham was a mere knight, not a lord. Interestingly, Dudley seems to vary his spelling ofher (most often used inher majesty) andit such that he uses the modern forms with Cecil but both the modern and what later became non-standard forms (hir, yt) with Walsingham. The difference between Dudley’s two pronoun clusters could also be connected to the content of the letters: the brown cluster with its first-person pronouns could be Dudley focusing on himself, whereas the pink cluster could be more about other people’s actions. We have thus identified three possible factors affecting the language use of these Elizabethan men: social status, the recipient and the topic of the letters.
Fig. 10. Principal component view: overview, visual query, and detail view.
Fig. 11. Correspondence from the Leycester Collection between Robert Dudley, William Cecil, and Francis Walsingham, from theCorpus of Early English Correspondence Sampler.
IV. DISCUSSION
Using principal component analysis with any statistical software is a black-box experience: you give the data, and then get the result, and then you try to understand what was done. Our interactive PCA view allows the user to rapidly explore a number of text fragment sizes and their effect on the result of PCA. One of the problems in understanding PCA is why a small change in input gives a completely different result. This is manifested in our implementation as well, but the interactive exploration also provides feedback when the result is stable and resistant to small parameter changes.
Another difficulty in understanding PCA is the connection
between input and output. The output variables are a linear combination of input variables, and the connection can be complex. Our implementation allows the user to interactively study the relationship between input and output, and gives an overview of the result by showing the most frequent word in each PCA node.
V. CONCLUSION
We have presented and discussed the design and implemen-tation of an interactive principal component analysis tool, in connection with our Text Variation Explorer tool. We believe that the same approach can be applied to any application that
needs to make PCA analysis easier to understand. We will continue to use TVE in teaching and develop it further based on the feedback.
ACKNOWLEDGMENTS
This research was funded by the Academy of Finland Digital Humanities Programme, project ‘Interfacing structured and unstructured data in sociolinguistic research on language change (STRATAS)’, sub-project #293441.
REFERENCES
[1] M. R. Berthold, N. Cebron, F. Dill, T. R. Gabriel, T. K¨otter, T. Meinl, P. Ohl, K. Thiel, and B. Wiswedel, “Knime - the konstanz information miner: Version 2.0 and beyond,” SIGKDD Explor. Newsl., vol. 11, no. 1, pp. 26–31, Nov. 2009,ISSN: 1931-0145.DOI: 10.1145/ 1656274.1656280. [Online]. Available: http://doi.acm. org/10.1145/1656274.1656280.
[2] J. N. G. Binongo, “Who wrote the 15th book of Oz? an application of multivariate analysis to authorship attribution,” Chance, vol. 16, no. 2, pp. 9–17, 2003. [3] CEECS, Corpus of Early English Correspondence
Sampler, Compiled by T. Nevalainen, H.
Raumolin-Brunberg, J. Ker¨anen, M. Nevala, A. Nurmi, and M. Palander-Collin, Department of English, University of Helsinki, 1998.
[4] C¸ . Demiralp,Clustrophile: A tool for visual clustering
analysis, KDD 2016 Workshop on Interactive Data
Exploration and Analytics (IDEA), 2016.
[5] H. Hotelling, “Analysis of a complex of statistical variables into principal components.,” Journal of edu-cational psychology, vol. 24, no. 6, p. 417, 1933. [6] J. E. Jackson,A User’s Guide to Principal Components.
Wiley-Interscience, 1991, ISBN: 0471622672.
[7] D. H. Jeong, C. Ziemkiewicz, W. Ribarsky, R. Chang, and C. V. Center, “Understanding principal component analysis using a visual analytics tool,” Charlotte visu-alization center, UNC Charlotte, 2009.
[8] I. Jolliffe,Principal component analysis. Wiley Online Library, 2002.
[9] R. Klinkenberg, RapidMiner: Data mining use cases
and business analytics applications. Chapman and
Hall/CRC, 2013.
[10] K. Pearson, “LIII. On lines and planes of closest fit to systems of points in space.,” The London, Edinburgh, and Dublin Philosophical Magazine and Journal of Science, vol. 2, no. 11, pp. 559–572, 1901.
[11] W. Shakespeare, Macbeth, Urbana, Illinois: Project Gutenberg, Retrieved March 16, 2017, 1606. [Online]. Available: http://www.gutenberg.org/ebooks/2264. [12] H. Siirtola, P. Isokoski, T. S¨aily, and T. Nevalainen,
“Interactive text visualization with Text Variation Ex-plorer,” in2016 20th International Conference Informa-tion VisualisaInforma-tion (iV16), Jul. 2016, pp. 330–335. DOI: 10.1109/IV.2016.57.
[13] H. Siirtola, Text Variation Explorer (TVE), Computer program, 2011. [Online]. Available: http://www.uta.fi/ sis/tauchi/virg/projects/dammoc/tve.html.
[14] H. Siirtola, T. S¨aily, T. Nevalainen, and K.-J. R¨aih¨a, “Text Variation Explorer: Towards interactive visualiza-tion tools for corpus linguistics,”International Journal of Corpus Linguistics, vol. 19, no. 3, pp. 417–429, 2014. [Online]. Available: http://dx.doi.org/10.1075/ijcl.19.3. 05sii.
[15] M. Twain, Adventures of Huckleberry Finn, Urbana, Illinois: Project Gutenberg, Retrieved March 16, 2017, 1885. [Online]. Available: http://www.gutenberg.org/ ebooks/76.
[16] S. Wold, K. Esbensen, and P. Geladi, “Principal compo-nent analysis,”Chemometrics and intelligent laboratory systems, vol. 2, no. 1-3, pp. 37–52, 1987.