Towards a Framework for Reliability and Safety Analysis
of Complex Space Missions
John W. Evans1 and Frank Groen2 NASA, Washington, DC, 20546
Lui Wang3 and Shira Okon4
NASA Johnson Space Center, Houston, TX, 77058
Rebekah Austin5, Art Witulski6 and Nagabhushan Mahadevan7 Vanderbilt University, Nashville, TN, 37240
Steven L. Cornford8 and Martin S. Feather9
Jet Propulsion Laboratory, California Institute of Technology, Pasadena, CA, 91109
and
Nancy Lindsey10
Goddard Space Flight Center, Greenbelt, MD, 20771
Long duration and complex mission scenarios are characteristics of NASA’s human exploration of Mars, and will provide unprecedented challenges. Systems reliability and safety will become increasingly demanding and management of uncertainty will be increasingly important. NASA’s current pioneering strategy recognizes and relies upon assurance of crew and asset safety. In this regard, flexibility to develop and innovate in the emergence of new design environments and methodologies, encompassing modeling of complex systems, is essential to meet the challenges.
Nomenclature
BN = Bayesian NetCDS = Cascade Distillation Systems
ECCLS = Environmental Control and Life Support System FMEA = Failure Modes and Effects Analysis
FTA = Fault Tree Analysis GSN = Goal Structuring Notation MBMA = Model Based Mission Assurance MBSE = Model Based Systems Engineering OSMA = Office of Safety and Mission Assurance R&M = Reliability and Maintainability
SE = Systems Engineering
1 Program Manager for Reliability and Maintainability and Program Executive for the NASA Electronic Parts
and Packaging Program at NASA HQ Office of Safety and Mission Assurance.
2 Director, NASA Office of Safety and Mission Assurance. 3 Technical Expert domain lead, NASA Johnson Space Center. 4 Engineer, Tietronix.
5 Graduate Student in Electrical Engineering, Vanderbilt University.
6 Research Associate Professor of Electrical Engineering, Vanderbilt University. 7 Systems Architect, Institute for Software Integrated Systems, Vanderbilt University. 8 Senior Engineer, Strategic Systems Office, JPL.
9 Principal, Software Assurance and Assurance Research, JPL. 10 Engineer, Goddard Space Flight Center.
I.
Introduction
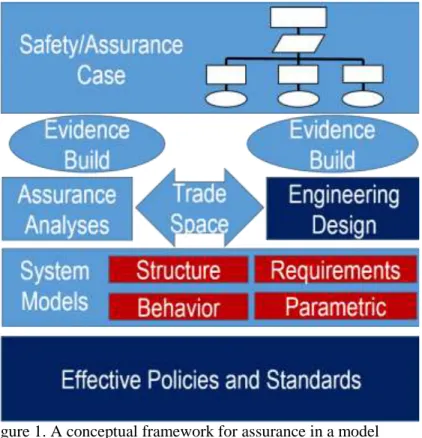
ASA’s Office of Safety and Mission Assurance (OSMA) is supporting and working to develop several key strategies and approaches to address the complex assurance challenges of NASA’s upcoming missions. Together these will comprise an advanced framework for complex systems assurance, compatible with Model Based Systems Engineering (MBSE) approaches. Figure 1 illustrates the concept of this framework. Adopting an objectives-based approach to systems safety and reliability is the first step1. This transitions from prescriptive assurance processes
to instead requiring demonstration, through a Safety/Assurance Case, that the key objectives needed to assure mission success are identified and fulfilled. The Safety/Assurance Case will provide the critical information and integration of mission data sources for gauging the acceptance of the mission risk. Embodying this approach in standards will allow for innovative engineering processes and products.
Contemporaneously, increasing use of MBSE is occurring in design and development of complex systems. NASA has long recognized the importance of modeling and simulation in designing and evaluating missions, and growing NASA interest in MBSE is evident. As NASA develops systems using MBSE, NASA OSMA will need to employ complementary assurance strategies, tools and methods that are more compatible with such MBSE practices. These will facilitate better integration into the design process, improved insight, and the rapid assessment of alternatives from the assurance viewpoint2. Further, direct implementation of models that address uncertainty in a meaningful and
comprehensive fashion are needed to improve the understanding of risks and to improve design decisions about the systems and missions3.
The sections that follow expand upon these themes:
Section II: the challenges that stem from the increasing complexities of NASA’s future explorations, and the changes these are driving.
Section III: the emergence of Safety/Assurance Cases as the underpinning of NASA’s transition to an
objectives- based approach to systems safety and reliability.
Section IV: NASA’s development of Objective Based Standards, to provide assurance the flexibility to
accommodate emerging approaches to systems engineering (notably MBSE).
Section V: the beneficial interplay between MBSE and assurance, with illustrations from a NASA/JSC project.
Section VI: opportunities for further synergy between MBSE and assurance via incorporation of more advanced modeling and analysis techniques.
Section VII: illustration of using the NASA Reliability and Maintainability Objective Hierarchy as the starting point for development of an assurance case, further assisted by integration with MBSE models.
II.
Complex Systems: Driving Change
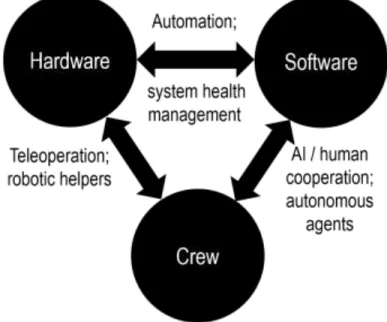
NASA’s plans for human endeavor to the surface of Mars presents significant challenges. Mission times will eventually approach 1100 days and an overall manned Mars campaign may extend for decades. The distances covered will create need for greater autonomy due to communications intermittency and delays. The requirements for transport, habitat and operations will need to include resiliency, reliability and sustainability, while supporting crew safety and health. These demands will ultimately drive increasingly complex systems consisting of software intensive, robotic and human operated hardware elements interacting as shown in Figure 2.
The habitat, as shown in the International Space Station based concept4 in Figure 3, is an example of a complex
system needed to fulfill deep space requirements. Its usage in long duration flights far from Earth will necessitate the crew interacting with many software driven subsystems, including communications, guidance and navigation, propulsion, and life support. One such subsystem, the Environmental Control and Life Support System (ECCLS), is a major element of the habitat. It provides for clean air and water as well as waste management. It is a semi-autonomous system that must operate with high reliability to ensure crew safety, yet must be repairable and maintainable. The water management or Cascade Distillation Systems (CDS) portion of the ECCLS is discussed further in sections below in the context of addressing system complexity in the model based framework and in bringing forth evidence for building a Safety or Assurance case as discussed in the introduction.
The importance of the model-based framework discussed in this paper emerges with increasing complexity in designs like the transport habitat. The nature of complexity in systems is defined by large numbers of interacting components to serve system functions, as well as the interfaces across functions. Ultimately to manage this complexity, modeling at different levels of abstraction becomes essential for design teams to understand design trade-offs, as well as supporting safety and reliability analysis.
Early in the formulation of the architecture of systems, Model Based Systems Engineering (MBSE) tools and strategies are at the front of the design process creating a single set of descriptive models, rather than documents, to represent the design. This provides the design teams with a single source of information about the design as it evolves.
These models form a common basis to understand the system in support of assurance analysis. MBSE has also created new opportunities, for the analysis of reliability and safety early in the design, giving rise to frameworks for Model Based Safety Analysis5, or in more general terms Model Based Mission Assurance (MBMA)2. As discussed in this
paper this supports the implementation of safety requirements, the execution of reliability analysis and the characterization and management of uncertainty, as the design develops.
Greater uncertainties also emerge with increasing complexity, creating more need for implementation of models that directly address uncertainties. There are several sources of such uncertainties emerging from different elements of the system. The accumulation of uncertainties gives rise to increasing unreliability, and therefore it is essential to characterize and manage uncertainty early in design. Given the perspective of a complete system as introduced Figure 3, it is obvious that contributing factors arise from human, software and hardware origins. Human performance characteristics, source lines of code, electronic part content and materials property variations are examples of sources of uncertainty that can be characterized in a modeling framework. As mentioned, models are created as abstractions of the emerging design. Models will facilitate design decisions and most represent the system sufficiently for this purpose. The extent models may differ from the reality is another type of uncertainty that should be characterized in the modeling process; this type of uncertainty is epistemic uncertainty. The characterization of uncertainties is managed by the mathematics of probabilities. Whether aleatory or epistemic, the mathematics of Bayesian probability theory provides for a “consistent foundation” for advancing treatment of uncertainties in modeling and simulation6.
The use of SysML based frameworks is providing for opportunities for developing this approach by providing for rapid synthesis of logic constructs including fault trees, reliability block diagrams and eventually Bayesian Nets, which can provide the basis for Bayesian probability modeling in support of reliability analysis, safety assessment and risk analysis. The ability to synthesize these constructs in SysML tools and move them to other modeling will offset complexities and provide for more timely and accurate analysis of systems in development.
III.
The Safety/Assurance Case
Safety Cases are used to manage and regulate major hazard industries (e.g., nuclear power, railroads, aviation, and offshore oil platforms) in Europe and elsewhere. Their origin traces back to the nuclear industry in the UK in the 1960s. The following definition of a Safety Case is taken from the UK’s Defence Standard 00-567:
The Safety Case shall consist of a structured argument, supported by a body of evidence, that provides a compelling, comprehensible and valid case that a system is safe for a given application in a given operating environment.
Observe from this definition that a safety case is an argument, i.e., is intended for human understanding. The argument rests on evidence – both “direct” evidence (e.g., the results of tests, analyses, inspections) coupled with “backing” evidence to convey the trustworthiness of the direct evidence (e.g., that inspections were performed by trained personnel following accepted practices). The structured nature of the argument refers to its organization, necessary for presenting the case for the safety of a large and/or complex system. Overall, the argument must be compelling – it must convince people that a system is safe, comprehensible – understandable by people (the structured nature of the argument is important in this regard, so that humans can navigate and understand the safety case for a large and complex system), and valid – the argument must be consistent and complete, so that the safety claims of the system indeed follow from the structure of the argument and the evidence on which it based. The phrase safe for a given application in a given operating environment draws attention to the need to establish the context within which the safety case establishes that a system is safe. When the safety case concept is applied to properties other than safety, it is referred to in more general terms (e.g., “assurance case” or “dependability case”).
In the aerospace domain, a retrospectively constructed dependability case for NASA Goddard’s User Spacecraft Clock Calibration System was reported8. NASA’s Constellation program recommended a dependability case as the
means to document the properties required of flight software9, contemporaneously with a National Research Council
study10 recommending them for critical software systems in general. Experience developing assurance cases for
spacecraft safing were described in11. Particularly for aviation, assurance cases have received growing attention – see
a recent summary12. For NASA System Safety, the closely related concept of a “Risk Informed Safety Case” (RISC)
is described in13.
As reported in13, the now-prominent role of argumentation in safety cases traces back to14. The methodical
construction of a safety case was a key theme of15, along with use of a graphical notation for presenting a case’s
argument. The “Goal Structuring Notation” (GSN) has emerged as a widely used such notation, and has been standardized by the GSN working group16. Software tools for creating, editing and viewing assurance cases (e.g.,
Adelard’s ASCE™, Astah’s GSN editor, NASA Ames’ AdvoCATE) generally support GSN. The use of these tools promotes the potential for linking evidence from the modeling environment to the safety or assurance case.
due to fallacies – see 17 for a taxonomy of such. More subtly, it may be logically consistent, but provide inadequate or even incorrect evidence in support of one or more of the claims at its basis – a tragic example of such is the flawed safety case for the Nimrod aircraft, the construction of which is excoriated in 18. Approaches to assessing the confidence to be had from an assurance case are discussed in 19. Key to developing more effective safety cases is address uncertainties in the models and simulations that support the evidence in the case which in turn supports the claims that are the basis of assurance.
IV.
Objectives Based Standards
The need for a new and flexible approach to assurance is clear as system engineering shifts gears toward model- based systems engineering and as the assurance fields began to embrace the safety case approach1. The objectives-
based approach provides for this flexibility and increases the effectiveness of assurance activities by focusing on what is specifically important to mission success, rather than codifying a rigid set of processes. NASA announced this approach in 2014: https://sma.nasa.gov/news/articles/newsitem/2014/12/04/osma-introduces-new-objectives-based- strategies. As stated there:
…The team (of Reliability and Maintainability (R&M) subject matter experts) developed an objectives hierarchy for the R&M discipline to systematically decompose technical considerations that form the basis for the discipline.
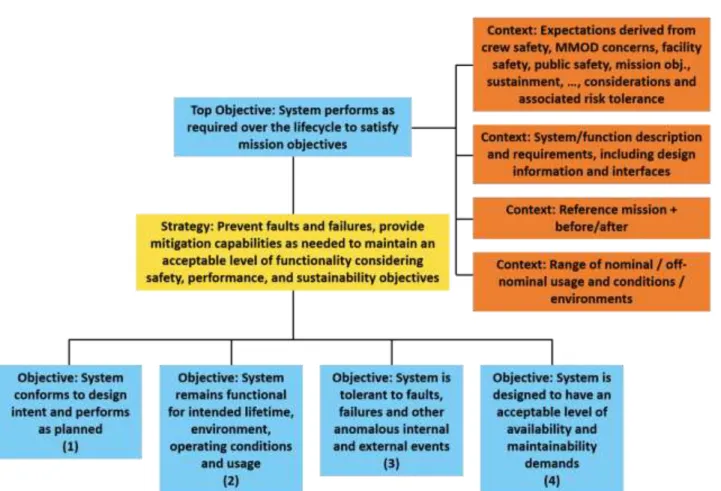
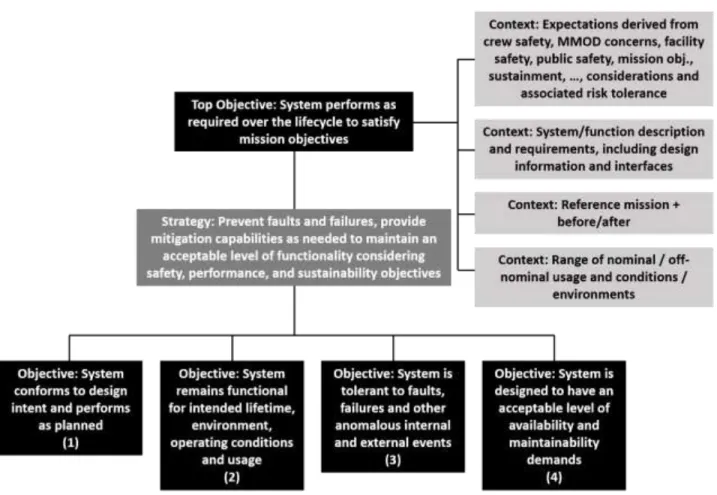
The resulting hierarchy is formed by a system of strategies and objectives that build upon each other to support the top objective, which states that “system performs as required over the lifecycle to satisfy mission objectives.” The top objective is flanked by the program or project’s requirements and contexts, which provide the framework for thinking about the objective.
The R&M Hierarchy has four sub-objectives pertaining to the design conformance, longevity, tolerance to faults and failures, and maintainability. The sub-objectives are subsequently deconstructed into increasingly specific objectives and related design and assurance strategies, implicitly capturing the rationale for those lower-level strategies.
The concept utilizes elements of the Goal Structured Notation (GSN). GSN, developed at York University, defines logic- based structures and symbols to document safety or assurance cases. For the R&M hierarchy, a modified version of GSN was used to specify the technical considerations that spaceflight projects are expected to address to support claims about the reliability and maintainability of a system.
Elements at the lowest levels of the hierarchy are sufficiently concrete to allow programs to select relevant R&M tools and approaches to establish confidence that the considerations documented in the hierarchy are sufficiently addressed. This flexibility will support the emerging use of MBSE and MBMA in NASA. In addition, as shown in later sections of this paper, an objectives based strategy supports the development of effective safety and assurance cases by providing the starting point for their development. The top level of the Reliability and Maintainability objectives hierarchy developed by NASA is shown in Figure 4.
V.
Model Based Practices for Complex System Analysis
Model Based Systems Engineering (MBSE), embracing the Systems Modeling Language (SysML™)20, is rapidly
emerging in the aerospace industry as the predominant way to practice the synthesis and architecture development for complex systems. MBSE offers significant opportunities across the life cycle of a project to enhance system development for complex architectures for both crewed and robotic systems. It provides for a consistent way to communicate information about the system requirements and the emerging system architecture to meet the requirements. The models, built in the SysML standard framework, become the central basis or “single truth” about the design, for the design team to interact with across disciplines.
Several types of models emerge from the SysML in practice. A requirements hierarchy describes the requirements of the system and structural models or functional block diagrams relate the functions of the system. Behavioral models such as use case diagrams and activity diagrams show how the system is used. Parametric models can incorporate mathematical relationships and constraints that can be extended in to the probabilistic realm.
SysML models also provide for significant advantages to the safety and assurance domain, providing opportunities for innovation, effectiveness and cost savings21,2. The basic SysML models provide an excellent approach to effectively incorporate safety requirements and analysis into complex systems as the architecture begins to emerge. Further the basic models emerging from SysML have been shown to be effective in identifying hazards and in formulating failure modes and effects analysis early in the development21,22. As an example, Mhenni et. al5 have shown
for a pilot commanded electro mechanical actuator, which failure modes predominate, through structural and behavioral models. Work within NASA has shown that basic reliability models, including Reliability Block Diagrams, Failure Modes and Effects Analysis (FMEA) and Fault Tree Analysis (FTA), can be synthesized from the SysML representations of structural and behavioral models in a highly automated fashion, early in the development. This was shown be effective for a safety critical system for water purification essential to manned flight in space23 and is further
discussed below.
the multiple views required to understand the high level as well as the details of the spacecraft design, system design knowledge can be effectively communicated among all the stakeholders24.
As part of the effort to develop a method to integrate Reliability and Maintainability (R&M) activities into the SE process, a Fault Management (FM) meta-model was developed to describe the relationships between model elements. This meta-model includes the structural and behavioral elements of a system using the block definition diagram (BDD), internal block diagrams (IBD), and State Machine models. Along with the meta-model, a set of plugins was developed within the selected modeling tool (MagicDraw) to extract the information captured within the models and generate the different analysis tools supporting the R&M activities. The plugins are able to automatically generate the Failure Modes, Effects, and Criticalities Assessment (FMECA) and Fault Tree outputs by traversing the models, as seen in Figure 5.
The FM modeling approach and tools were used on the Cascade Distillation System (CDS), a NASA/JSC project aimed at developing the next generation of Environmental Control and Life Support (ECLSS) support future human exploration missions beyond low earth orbit. CDS was a project that chose to use model based systems engineering tools and techniques for implementing system design and technical management processes. The CDS 2.0 system model used SysML representation and tools to extract design artifacts including FMECA and FTAs. By using the model based fault management engineering method, the CDS project has taken some early steps in embedding the R&M activities from the early phases of the project. This has allowed the system engineer to identify the potential critical failures modes by the Preliminary Design Review, and proactively mitigate the risks associated with these failure modes25.
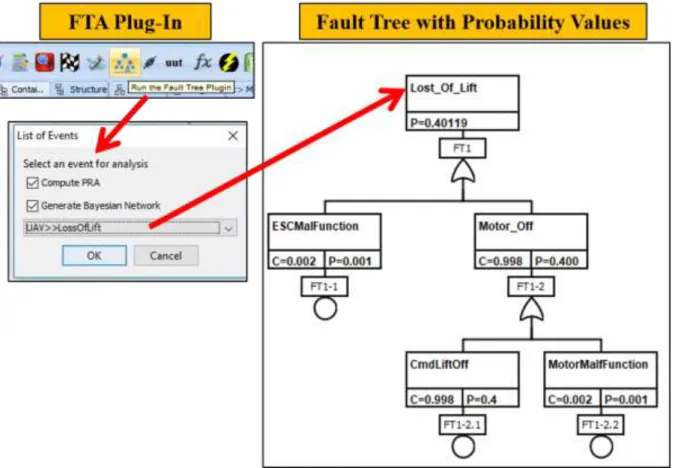
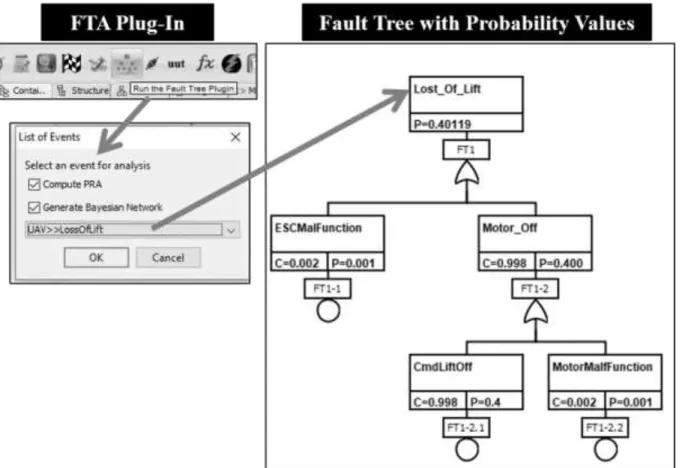
As projects advance, additional R&M products will need to be generated from the SysML models in order to support the future Project Lifecycle Phases Reviews. Recent work has been performed to extend the FTA tool to conduct PRA and to support the application of Bayesian probability theory. The FTA logic is used to traverse the model to assess probability attributes and determine contribution of all components. The tool was developed by NASA and demonstrated on a UAV model, a CubeSAT model, and a Deep Space Habitat Power System Architecture model. The FM meta-model was extended to include the capture of failure probability values. The FTA tool gives an option to compute PRA and to generate Bayesian Network. If selected, the tool generates the fault tree along with the PRA value calculations. It also extracts a .m file for MATLAB and a xbn file format for the Microsoft Bayesian Network (MSBNx) tool.
An example of the tool is provided using the UAV model. The event “Loss of Lift” is selected for analysis (see Figure 6). The Fault Tree is populated with probability and contribution values using fault tree logic as the basis for calculations.
The Bayesian Network files for MATLAB and MBSnx tool are extracted for additional analysis. To do the Bayesian Analysis, the xbn file is opened with pre-populated prior probabilities and with conditional probability tables (CPTs) automatically assigned to each node. Figure 7 shows the probability values from the fault tree imported to the Bayesian Analysis tool.
It is possible to then change the observations of failures for additional analysis in which the third party tools can then recalculate the probabilities based on new observed evidence. Figure 8 shows the probability of Motor Malfunction changed to “True” with the probability value changing from “0.001” to “1.0”, resulting in “Loss of Lift” event probability of “1.0”.
Extensions such as these will help to analyze and mature the design of systems and enable NASA to apply the method and tools to other spaceflight systems. Indeed, similar approaches are being pursued in JPL’s application of MBSE to robotic missions, where methodology and tooling has been developed for leveraging fault and failure information in the system model to conduct PRA26,27.
VI.
Incorporating Advanced Models
The emergence of MBSE and MBMA creates many opportunities for enabling reliability and safety engineering for complex missions. Advanced models and simulations can be incorporated into the SysML environment, taking advantage of a semantically rigorous and complete representation of the architecture on which to perform analysis early on in the development. As shown in the previous discussion this includes traversing these system models to automatically generate fault trees, given the appropriate meta-model, from which an understanding of failure scenarios can be derived. Calculation of the probability of the top-level event follows from conventional treatment of this type of logic structure and is a straightforward analysis.
For more advanced analysis, the logic structure of the fault tree can be passed from the SysML framework to a more rigorous analysis environment. For example, SysML diagrams can be translated into executable models for use by MatLab Simulink®28. It follows that the SysML generated fault trees can also be translated in a similar manner. In the
simulation environment, the fault tree can be operated on with more complex probability analysis. For example, an auto generated fault tree may be passed to MatLab Simulink, and with manipulation by analyst, and complexities in the system may be better addressed by dynamic analysis29. Fault trees also provide a logic structure consistent with
Bayesian probability theory30.
Complexities in real systems can best be handled with Bayesian Nets (BN) which can extend the ability to understand the system reliability, incorporate multiple sources of data and manage both aleatory and epistemic uncertainties in a single consistent framework. The utility of Bayesian Nets has been demonstrated with many types of systems including human operated systems used for spaceflight communications at GSFC; they are readily adaptable to include many system complexities and are promoted for safety analysis by NASA. They are widely used to make inferences about Human-In-The-Loop systems to better understand human –system interactions, including for automotive operation for assisted driving31.
The authors contend that meta-models and plug-ins can be extended to develop BNs. As discussed, RBDs and FTs are readily extracted from traversing the SysML models given the correct SysML framework and meta–model. These logic structures can be converted to BNs32, 33. Given a synthesized BN, it can be passed to a more rigorous analytical
environment as described previously. Clearly, the integration of SysML with analytical languages (e.g., AltaRica), with scripting languages (e.g., Python) and with environments that support both design and analysis (e.g., Simulink®) are extending the capabilities of SysML to enhance safety and to perform analysis on highly complex systems. A framework reflecting this is proposed in Figure 9.
VII.
Integrated Modeling Frameworks
The Reliability and Maintainability (R&M) objectives hierarchy described earlier has been applied to create an assurance case for the radiation reliability of an experiment board with a science objective to count the number of upsets in a 28nm commercial SRAM while on-orbit as part of a university CubeSat experiment. Figure 10 presents a simplified diagram of the CubeSat experiment board. The input power from the spacecraft is a regulated 3V rail (blue boxes in Figure 10). This 3V primary power is divided to the different power domains by load switches to create a rail that supplies the parts in green and a rail that supplies the part in orange. There are three regulators on the board to provide the three voltage domains for the SRAM and are the red boxes parts in Figure 10. The load switches provide current limiting to protect against single- event latch-ups on the board. These load switches also prevent high current conditions from propagating to the rest of the satellite. Load Switch A has an autorestart capability after a high current event and Load Switch B toggles a flag signal after a high current event. The load switches result in 5 isolated power domains on the experiment board. The microcontroller handles reading and writing to the SRAM, counting the number of upsets, and reporting the science data and health of the board on an I2C bus. The watchdog timer (WDT) is tasked to recover the microcontroller from single-event functional interrupts.
The assurance case for the radiation reliability of the experiment board was created using the Goal Structuring Notation (GSN) and SysML models implemented in WebGME, a web-based modeling tool that allows for the creation of domain-specific modeling languages34. SysML models supported in this platform include functional requirement
models and architectural models. The functional models capture the high-level functional requirements and their decomposition into more specific and concrete functions. Concrete functions are mapped to components in the architectural model that implement the associated functionality. The architectural models are built from a library of component block diagrams. The wiring between the components captures the interaction between the components and subsystems. The internals of the component block diagram models (and hence the system models) capture the component faults (for example, low output voltage in a regulator caused by TID degradation) induced by radiation effects and the propagation of the fault effects within the component and across the system.
The cause-effect relationships captured in the SysML functional and architectural models are used to derive the structure of Bayesian Network models that is used to provide a quantitative analysis of the component health and desired system functionalities under different radiation conditions. The nodes in the Bayesian Network capture the mission characteristics (elapsed mission time, radiation environment), component health and/ or desired system functionalities. The edges between the nodes capture the dependencies between the nodes. The network is pruned and refined with suitable values for the conditional probability tables based on information from radiation tests, past flight data, manufacturer supplied data sheets specifications, literature survey and expert knowledge. The GSN model for the board is a graphical assurance case that decision makers will access to accept risk. It also documents how risk has been mitigated. This case is part of what is presented in reviews from early on to the Critical Design Review. The overall goal, or claim, of this assurance case is that “Systems remains functional for intended radiation environment in order to complete the science mission requirement.” In order to complete this goal, understanding the radiation mechanisms and environment is required which is the overall strategy. Through understanding the radiation
mechanisms, two sub-goals for the system emerge - one, that the individual parts of the system can withstand the radiation stresses for the life of the missions, and two, that the system is tolerant to radiation faults and failure. Figure 11 presents this top-level case.
Goal 2 is expanded further in Figure 12, which presents a section of the part-level radiation tolerance assurance case. One way to show that the parts are tolerant to radiation is to perform radiation tests and present the results which is seen in Strategy 3, Goal 5, Goal 9 and Solution 2. If the part cannot be shown to be radiation tolerant, then a level mitigation scheme is implemented as seen in Strategy 5 and Goal 7. Figure 13 makes the argument for the system-level mitigation scheme of single-event effects . This includes detection (Goal 8), isolation (Goal 6), and recovery (Goal 10). The solution nodes can contain references to artifacts that serve as evidence such as test reports.
Figure 14 shows a functional decomposition model of the system. The lowest level functions are linked to components (references from architectural model) that provide the functionality. The GSN assurance case model can be linked to elements in other SysML models. The goals and strategy nodes in the GSN model can contain references (or links) to specific nodes in the functional model, architectural models and fault models. This allows for GSN models to interact with other models in an MBSE paradigm. Linking nodes in the GSN models to elements in other models helps establish the system-level context for the specific portions of the assurance argument. This context could be useful to track the functions, faults, components, and subsystems that are covered as part of the assurance and reliability argument and identify any gaps or inconsistencies particularly when system models evolve. By organizing the assurance case into goals and child-goals, the logic of the argument for radiation reliability is made explicit in the graphical model. In addition, the model allows for the mission assurance objectives to fit into the larger MBSE paradigm for system design which provides the ability to manage greater complexity. Assumptions, which would tend to be hidden within purely textual arguments, surface through the explicit assumption nodes, leading to rapid upfront consideration of reliability and safety. These arguments are eventually evaluated through the system tests summarized in solution nodes.
If there is limited time or budget for radiation testing, a Bayesian net model of the radiation-induced fault effects on the system can be used to prioritize testing. The result of the BN sensitivity analysis is a solution in the GSN argument and influences the construction of the GSN assurance case that prescribes the necessary radiation part characterization tests. The discrete Bayesian Network model was constructed and executed with GeNIe tool set36. The
structure of the net was derived from fault models of the parts in the SysML block diagram model of the system. Figure 15 shows a Bayesian Network model where the top two nodes, MissionTimeElapsed and SingleEventEnvironment, are deterministic nodes that allow the user to set the conditions for evaluating the probabilities for the rest of the nodes. The MissionTimeElapased may be set to any one of the three time frames of the mission, less than a year, between 1 and 2 years, and anything beyond 2 years. The SingleEventEnvironment may be set to either a low radiation region or a high radiation region such as the South-Atlantic Anomaly. The TID, SEL and SEU nodes capture the probability of faults and anomalies from these radiation effects that the system is exposed to based on the settings for MissionTimeElapsed and SingleEventEnvironment. The diagram shows the states in each node and a bar graph shows the probability of the node being in the specific state.
The Current node captures the probability of the current on the board being nominal (in-spec) or high (out-of-spec) based on radiation-induced faults (TID or SEL) in any of the interconnected components in the board. The nodes, VUC_Bus, WDT, LoadSwitchOperation, LinearRegulator, capture the health of the component functionalities related to power from the bus, Watch-dog timer, Load switch and the Linear Regulator respectively. The uController node captures the correctness and availability of the microcontroller operation given the state of its parent nodes. The SRAM node captures both the correctness and the availability of the SRAM operation. Since the microcontroller is responsible for instructing the SRAM as well as controlling the mitigation operation related to SRAM SEL, the SRAM node is influenced by the health of the microcontroller.
Figure 16 shows the posterior probabilities of the nodes (as bar graphs) when the MissionTimeElapsed node was set to less than one year and the SingleEventEnvironment node was set to a Low rate region. As expected during the early part of the mission, the components are functioning correctly, with limited downtime for the SRAM related to periodic restarts to scrub record single event upsets. Figure 17 shows the posterior probability when the MissionTimeElapsed is set to greater than 2 years (beyond the expected life of the mission) and the SingleEventEnvironment is set to a High rate region (such as South Atlantic Anomaly). The higher rate of single event effects (SEL, SEU), leads to a greater probability for higher currents (which is reflected in the posterior probability of Current being in the out-of-spec state). This decreases the availability of the SRAM due to repeated restarts as part of the SEL mitigation procedure. In addition the increased probability of SEUs and SEFIs in the microcontroller leads to a greater chance for system malfunction. Moreover, in the components involved in the mitigation, the WDT and LoadSwitch, the posterior probabilities reveal an increase in chances of degraded performance, thereby increasing the chances of malfunction in the microcontroller, reducing both availability and correctness in the SRAM. Figure 18
presents a sensitivity study relative to parameters in the conditional probability table that can influence the outcome of the target node like the functionality of the microcontroller. It confirms that the correctness of the microcontroller operation in the presence of higher TID degradation and SEE probability is sensitive to the correct operation of the Linear Regulator, WDT, VUC_Bus and Load Switch. These parts are then the top candidates for further radiation characterization testing.
The end result of the GSN argument construction along with the creation of system models with fault propagation and Bayesian network sensitivity analysis studies is an easy-to-follow graphical representation of factors affecting the radiation reliability of the CubeSat experiment that makes mitigation decisions and remaining risks transparent to a reliability review team which should improve the productivity of reliability reviews.
VIII.
Conclusion
The forward looking pivot to Objectives based approaches from OSMA and the emergence of MBSE and other model-based thinking has provided significant opportunities for the Assurance community. The ability to directly and quickly access “authoritative sources of truth”, the context in which they are found and the ability to use machines to mine, identify and correlate nearly any piece of information has the potential to revolutionize the way the various assurance disciplines are performed. While the integrated Model-Based Mission Assurance approach is still nascent, the various elements required to develop and implement this approach are moving forward rapidly.
Acknowledgements
This research was carried out at NASA HQ, NASA Johnson Space Center, Vanderbilt University, Jet Propulsion Laboratory, California Institute of Technology (under a contract with the National Aeronautics and Space Administration, sponsored by the NASA Office of Safety and Mission Assurance) and Goddard Space Flight Center. We thank Director Ken Vorndran for his useful insights and comments.
References
1Groen, F.J., Evans, J.W. and Hall, A.J., “A Vision for Spaceflight Reliability: NASA’s Objectives Based Strategy,” 2015 Annual Reliability and Maintainability Symposium (RAMS), pp. 1-6. IEEE, 2015.
2Evans, J., Cornford, S., and Feather, M.S., “Model Based Mission Assurance: NASA’s Assurance Future” 2016 Reliability and Maintainability Symposium (RAMS), pp. 1-7. IEEE, 2016.
3NASA “NASA’s Journey to Mars – Pioneering Next Steps in Space Exploration,” NP-2015-08-2018-HQ, 2015. 4Smitheran, D., and Griffin, B.N., “Habitat Concepts for Deep Space Exploration,” AIAA Space 2014 Conference and Exposition, AIAA, vol. 4477, 2014.
5Mhenni, F., Choley, J-Y., Riviere, A., Nguyen, N., and Kadima, H., “SysML and Safety Analysis for Mechatronic Systems,”
Mechatronics (MECATRONICS), 2012 9th France-Japan & 7th Europe-Asia Congress on and Research and Education in Mechatronics (REM), 2012 13th Int'l Workshop on, pp. 417-424. IEEE, 2012.
6“Research Challenges in Modeling & Simulation for Engineering Complex Systems,”
NSF/NASA/AFOSR/NTSA/NMSC Workshop Report, September 2016, Arlington, VA. (available at
http://trainingsystems.org/publications/Research-Challenges-in-
Modeling-and-Simulation-for-Engineering-Complex-Systems.pdf).
7U.K. Ministry of Defence, “Safety Management Requirements for Defence Systems.” Defence Standard 00-56, Issue 4, June 2007.
8Weinstock, C.B., Goodenough, J.B., and Hudak, J.J., “Dependability Cases.” CMU/SEI-2004-TN-016, Software Engineering Institute, 2004.
9 NASA, “Constellation Program Computing System Requirements,” CxP 70065, 2007.
10Jackson, D., Thomas, M., and Millett, L.I., (eds), Software for Dependable Systems: Sufficient Evidence? National Academies Press, 2007.
11Nguyen, E.A. and Alex G. Ellis. A.G., “Experiences with assurance cases for spacecraft safing,” 22nd International Symposium on Software Reliability Engineering (ISSRE), pp. 50-59. IEEE, 2011.
12Rinehart, D.J., Knight, J.C., and Rowanhill, J., Current Practices in Constructing and Evaluating Assurance Cases With Applications to Aviation, NASA/CR2015-218678.
13NASA, “NASA System Safety Handbook,” NASA/SP-2010-580, 2010.
14McDermid, J.A., “Support for Safety Cases and Safety Arguments using SAM,” Reliability Engineering and System Safety, 43, pp. 111-127, 1994.
15Kelly, T.P., “Arguing Safety – A Systematic Approach to Managing Safety Cases,” Ph.D. Dissertation, University of York. http://www-users.cs.york.ac.uk/tpk/tpkthesis.
2011, http://www.goalstructuringnotation.info/documents/GSN_Standard.pdf
17Greenwell, W.S., Knight, J.C., Holloway, C.M., and Pease, J.J., “A Taxonomy of Fallacies in System Safety Arguments,” NASA NTRS, 2006 https://ntrs.nasa.gov/archive/nasa/casi.ntrs.nasa.gov/20060027794.pdf
18Haddon-Cave, C., The Nimrod Review: an independent review into the broader issues surrounding the loss of the RAF Nimrod MR2 aircraft XV230 in Afghanistan in 2006 HC 1025, The Stationery Office, London, 2009.
19Duan, L., Rayadurgam, S., Heimdahl, M., Ayoub, A., Sokolsky, O., and Lee, I., “Reasoning About Confidence and Uncertainty in Assurance Cases; A Survey,” Software Engineering in Health Care, 2014.
20“OMG Systems Modeling Language,” http://www.omgsysml.org
21Cressant, R., David, P., Idiasiak, V., and Kratz, F., “Increasing Reliability of Embedded Systems in a SysML Centered MBSE Process: Application to LEA Project,” M-BED 2010, Dresden, Germany, 2010.
22Scholz, S., and Thramboulidis, K., “Integration of Model-based Engineering with System Safety Analysis,” International Journal of Industrial and Systems Engineering, 15(2), (2013) 193-215.
23Izygon, M., Wagner, H., Okon, S., Wang, L., Sargusingh, M.J., and Evans, J., “Facilitating R&M in Spaceflight Systems with MBSE,” 2016 Reliability and Maintainability Symposium (RAMS), pp. 1-6. IEEE, 2016.
24Wang, L., Izygon, M., Okon, S., Garner, L., and Wagner, H., “Effort to Accelerate MBSE Adoption and Usage at JSC,” AIAA Space 2016, p. 5542, 2016.
25Sargusingh, M. J., Okon, S., and Callahan, M. R., “Cascade Distillation System Design for Safety and Mission Assurance,” 45th International Conference on Environmental Systems, 2015.
26Castet, J.F., Bareh, M., Nunes, J., Jenkins, S., and Lee, G., “Fault Management Ontology and Modeling Patterns,” AIAA SPACE 2016, p. 5544, 2016.
27Schreiner, S.S., Rozek, M.L., Kurum, A., Everline, C.J., Ingham, M.D., and Nunes, J.A., “Towards a methodology and tooling for Model-Based Probabilistic Risk Assessment PRA,” AIAA SPACE 2016, p. 5545, 2016.
28Chabibi, B., Douche, A., Anwar, A., and Nassar, M.” Integrating SysML with Simulation Environments (Simulink) by Model Transformation Approach,” Enabling Technologies: Infrastructure for Collaborative Enterprises (WETICE), 2016 IEEE 25th International Conference on, pp. 148-150, IEEE.
29Dugan, J.B., Sullivan, K.J., and Coppit, D., “Developing a Low-Cost High-Quality Software Tool for Dynamic Fault-Tree Analysis,” IEEE Transactions on Reliability, 49(1), pp. 49-59, 2000.
30Kelly, D.L., and Smith, C.L., “Bayesian Inference in probabilistic risk assessment-the current state of the art,” Reliability Engineering and Systems Safety, 94(2), pp 628-643, 2009.
31Kumagai, T., Sakaguchi, Y., Okuwa, M., and Akamatsu, M., “Prediction of Driving Behavior through Probabilistic Inference,” Proc. 8th International Conference on Engineering Applications of Neural Networks, pp. 117-123. September, 2003.
32Dorociak, R., “Early Probabilistic Reliability Analysis of Mechatronic Systems,” 2012 Reliability and Maintainability Symposium (RAMS), pp. 1-6. IEEE, 2012.
33Torres-Toledano, J.G., and Succar, L.E., “Bayesian Networks for Reliability Analysis of Complex Systems,” Ibero- American Conference on Artificial Intelligence. Springer Berlin Heidelberg, 1998.
34Maroti, M., Kecskes, T., Kereskenyi, R., Broll, B., Volgyesi, P., Juracz, L., Levendoszky, T., and Ledeczi, A., “Next Generation (Meta)Modeling: Web- and Cloud-based Collaborative Tool Infrastructure,” 8th Multi-Paradigm Modeling Workshop, MoDELS, pp. 41-60, 2014.
35Witulski, A., Austin, R., Evans, J., Mahadevan, N., Karsai, G., Sierawski, B., LaBel, K., Reed, R., and Schrimpf, R., “Goal Structuring Notation in a Radiation Hardening Assurance Case for COTS-Based Spacecraft,” GOMAC Tech 2016 Government Microcircuits Applications & Critical Technologies Conference, Orlando FL, 2016, available from http://ntrs.nasa.gov/archive/nasa/casi.ntrs.nasa.gov/20160005315.pdf
36Marek J. Druzdzel. GeNIe: A development environment for graphical decision-analytic models. In Proceedings of the 1999 Annual Symposium of the American Medical Informatics Association (AMIA-1999), page 1206, Washington, D.C., November 6-10, 1999.
USE THIS FIGURE FOR THE COLOR VERSION OF THE PAPER; SEE NEXT PAGE FOR
THE EQUIVALENT FOR THE BLACK AND WHITE VERSION
Figure 1. A conceptual framework for assurance in a model
driven environment
2.
USE THIS FIGURE FOR THE BLACK AND WHITE VERSION OF THE PAPER; SEE
PREVIOUS PAGE FOR THE EQUIVALENT FOR THE COLOR VERSION
Figure 1. A conceptual framework for assurance in a model
driven environment
2.
USE THIS FIGURE FOR BOTH THE BLACK AND WHITE AND COLOR VERSIONS OF THE
PAPER
Figure 2. Interactions typical of complex systems of
future NASA missions. Human, hardware and software
elements share functionality.
USE THIS FIGURE FOR THE COLOR VERSION OF THE PAPER; SEE NEXT PAGE FOR
THE EQUIVALENT FOR THE BLACK AND WHITE VERSION
Figure 3. Transport module design based on International Space Station derived design concept. The
design supports a 500-day mission for a crew of four. The habitat mission depends on the integrity of
the structure but also on systems such as the Environmental Control and Life Support System (ECLSS)
4,
which provides for clean air and potable water. (Courtesy of David Smitherman, NASA Marshall Space
Flight Center)
USE THIS FIGURE FOR THE BLACK AND WHITE VERSION OF THE PAPER; SEE
PREVIOUS PAGE FOR THE EQUIVALENT FOR THE COLOR VERSION
Figure 3. Transport module design based on International Space Station derived design concept. The
design supports a 500-day mission for a crew of four. The habitat mission depends on the integrity of
the structure but also on systems such as the Environmental Control and Life Support System (ECLSS)
4,
which provides for clean air and potable water. (Courtesy of David Smitherman, NASA Marshall Space
Flight Center)
USE THIS FIGURE FOR THE COLOR VERSION OF THE PAPER; SEE NEXT PAGE FOR
THE EQUIVALENT FOR THE BLACK AND WHITE VERSION
USE THIS FIGURE FOR THE BLACK AND WHITE VERSION OF THE PAPER; SEE
PREVIOUS PAGE FOR THE EQUIVALENT FOR THE COLOR VERSION
USE THIS FIGURE FOR THE COLOR VERSION OF THE PAPER; SEE NEXT PAGE FOR
THE EQUIVALENT FOR THE BLACK AND WHITE VERSION
USE THIS FIGURE FOR THE BLACK AND WHITE VERSION OF THE PAPER; SEE
PREVIOUS PAGE FOR THE EQUIVALENT FOR THE COLOR VERSION
USE THIS FIGURE FOR THE COLOR VERSION OF THE PAPER; SEE NEXT PAGE FOR
THE EQUIVALENT FOR THE BLACK AND WHITE VERSION
USE THIS FIGURE FOR THE BLACK AND WHITE VERSION OF THE PAPER; SEE
PREVIOUS PAGE FOR THE EQUIVALENT FOR THE COLOR VERSION
USE THIS FIGURE FOR THE COLOR VERSION OF THE PAPER; SEE NEXT PAGE FOR
THE EQUIVALENT FOR THE BLACK AND WHITE VERSION
USE THIS FIGURE FOR THE BLACK AND WHITE VERSION OF THE PAPER; SEE
PREVIOUS PAGE FOR THE EQUIVALENT FOR THE COLOR VERSION
USE THIS FIGURE FOR THE COLOR VERSION OF THE PAPER; SEE NEXT PAGE FOR
THE EQUIVALENT FOR THE BLACK AND WHITE VERSION
USE THIS FIGURE FOR THE BLACK AND WHITE VERSION OF THE PAPER; SEE
PREVIOUS PAGE FOR THE EQUIVALENT FOR THE COLOR VERSION
USE THIS FIGURE FOR BOTH THE BLACK AND WHITE AND COLOR VERSIONS OF THE
PAPER
Figure 9. A notional diagram for SysML driven analyses. BNs will take on a
greater role enabled by SysML constructs and compatible analytical environments for simulation.USE THIS FIGURE FOR THE COLOR VERSION OF THE PAPER; SEE NEXT PAGE FOR
THE EQUIVALENT FOR THE BLACK AND WHITE VERSION
USE THIS FIGURE FOR THE BLACK AND WHITE VERSION OF THE PAPER; SEE
PREVIOUS PAGE FOR THE EQUIVALENT FOR THE COLOR VERSION
USE THIS FIGURE FOR THE COLOR VERSION OF THE PAPER; SEE NEXT PAGE FOR
THE EQUIVALENT FOR THE BLACK AND WHITE VERSION
USE THIS FIGURE FOR THE BLACK AND WHITE VERSION OF THE PAPER; SEE
PREVIOUS PAGE FOR THE EQUIVALENT FOR THE COLOR VERSION
USE THIS FIGURE FOR THE COLOR VERSION OF THE PAPER; SEE NEXT PAGE FOR
THE EQUIVALENT FOR THE BLACK AND WHITE VERSION
USE THIS FIGURE FOR THE BLACK AND WHITE VERSION OF THE PAPER; SEE
PREVIOUS PAGE FOR THE EQUIVALENT FOR THE COLOR VERSION
USE THIS FIGURE FOR THE COLOR VERSION OF THE PAPER; SEE NEXT PAGE FOR
THE EQUIVALENT FOR THE BLACK AND WHITE VERSION
USE THIS FIGURE FOR THE BLACK AND WHITE VERSION OF THE PAPER; SEE
PREVIOUS PAGE FOR THE EQUIVALENT FOR THE COLOR VERSION
USE THIS FIGURE FOR THE COLOR VERSION OF THE PAPER; SEE NEXT PAGE FOR
THE EQUIVALENT FOR THE BLACK AND WHITE VERSION
USE THIS FIGURE FOR THE BLACK AND WHITE VERSION OF THE PAPER; SEE
PREVIOUS PAGE FOR THE EQUIVALENT FOR THE COLOR VERSION
USE THIS FIGURE FOR THE COLOR VERSION OF THE PAPER; SEE NEXT PAGE FOR
THE EQUIVALENT FOR THE BLACK AND WHITE VERSION
USE THIS FIGURE FOR THE BLACK AND WHITE VERSION OF THE PAPER; SEE
PREVIOUS PAGE FOR THE EQUIVALENT FOR THE COLOR VERSION
USE THIS FIGURE FOR THE COLOR VERSION OF THE PAPER; SEE NEXT PAGE FOR
THE EQUIVALENT FOR THE BLACK AND WHITE VERSION
Figure 16. Bayesian Network inference for MissionTimeElapsed is less than 1 year and the SingleEventEnvironment is in the Low rate region.
USE THIS FIGURE FOR THE BLACK AND WHITE VERSION OF THE PAPER; SEE
PREVIOUS PAGE FOR THE EQUIVALENT FOR THE COLOR VERSION
Figure 16. Bayesian Network inference for MissionTimeElapsed is less than 1 year and the SingleEventEnvironment is in the Low rate region.
USE THIS FIGURE FOR THE COLOR VERSION OF THE PAPER; SEE NEXT PAGE FOR
THE EQUIVALENT FOR THE BLACK AND WHITE VERSION
Figure 17. Bayesian Network inference for MissionTimeElapsed greater than 2 years and the SingleEventEnvironment is in the High rate region (such as South Atlantic Anomaly).
USE THIS FIGURE FOR THE BLACK AND WHITE VERSION OF THE PAPER; SEE
PREVIOUS PAGE FOR THE EQUIVALENT FOR THE COLOR VERSION
Figure 17. Bayesian Network inference for MissionTimeElapsed greater than 2 years and the SingleEventEnvironment is in the High rate region (such as South Atlantic Anomaly).
USE THIS FIGURE FOR BOTH THE BLACK AND WHITE AND COLOR VERSIONS OF THE
PAPER
Figure 18. The “Tornado” diagram generated by the GeNIE tool, portraying results of sensitivity analysis on the probability of the uController running. The horizontal bars indicate absolute change to that probability as individual parameters’ probabilities change (in this analysis by +/- 10%). The bar width indicates magnitude of change, e.g., the widest bar shows the maximum sensitivity is to the correct operation of the LinearRegulator. The left-to-right shading of the bar from dark-to-light indicates the uController running probability is increased by the individual parameter’s probability increasing (bars 1 and 3), whereas shading in the opposite direction indicates it is decreased (bar 2, showing uController running probability is decreased as TID=high probability increases).