Artigo
*e-mail: [email protected]
FLOW INJECTION GREEN METHOD FOR THE QUANTITATIVE ANALYSIS OF KETOCONAZOLE IN PHARMACEUTICAL PREPARATIONS
Felipe Scatolin e Matthieu Tubino*
Instituto de Química, Universidade Estadual de Campinas, CP 6154, 13083-970 Campinas - SP, Brasil Marta Maria Duarte Carvalho Vila
Universidade de Sorocaba, Sorocaba - SP, Brasil
Recebido em 28/4/09; aceito em 19/10/09; publicado na web em 2/3/10
A flow injection method for the quantitative analysis of ketoconazole in tablets, based on the reaction with iron (III) ions, is presented. Ketoconazole forms a red complex with iron ions in an acid medium, with maximum absorbance at 495 nm. The detection limit was estimated to be 1×10 -4 mol L-1; the quantitation limit is about 3×10 -4 mol L-1 and approximately 30
determinations can be performed in an hour. The results were compared with those obtained with a reference HPLC method. Statistical comparisons were done using the Student’s t procedure and the F test. Complete agreement was found at the 0.95 significance level between the proposed flow injection and the HPLC procedures. The two methods present similar precision, i.e., for HPLC the mean relative standard deviation was ca. 1.2% and for FIA ca. 1.6%.
Keywords:quantitative analysis; ketoconazole; flow injection system.
INTRODUCTION
Ketoconazole, an imidazole derivative, is a broad spectrum anti-fungal agent used in the treatment of superficial and systemic anti-fungal mycoses, available as oral and topic preparations. The main effect of imidazole is the inhibition of the sterol 14-alpha-demethylase, an enzymatic system dependent upon cytochrome P450, with a conse-quent inhibition of fungal development.1,2
Ketoconazole, [1-[4-(4-{[(2R,4S)-2-(2,4-dichlorophenyl)-2-(1H - imidazol-1-ylmethyl)-1,3-dioxolan-4-yl]methoxy}phenyl)piperazin-1-yl]ethan-1-one], is a white or almost white powder, soluble in acids, with a molar mass of 531.4 Da and molecular formula C26H28Cl2N4O4 (Figure 1).3
Some methods have been reported for its determination in pharmaceutical and biological fluids including titrimetry,3 UV-Vis
spectrophotometry,4-12 spectrofluorimetry12,13 and chromatography,
especially, high perfomance liquid chromatography.3,4,14-20
It has been noted, there is an increasing employment of HPLC in the analysis of numerous substances.21 However, the sometimes
disdained spectrophotometric methods are reliable, present good limits of detection and determination and quite good precision and accuracy, adding benefits such as employment of simple devices of low cost; also the requirement of only small volumes of organic solvents, where they are strictly necessary.
Some spectrophotometric methods are described in the literature for the determination of ketoconazole, where the determination of
ketoconazole was done in the visible region of the spectrum after adequate reactions to obtain colored species. Organic solvents are frequently used in such methods.
Sadeghi and Shamsipur7 developed a procedure based on the
for-mation of a colored species between ketoconazole and picric acid at pH 2.5 in chloroform, followed by spectrophotometric determination at 410 nm. The system obeys Beer’s law in the concentration range from from 1 to 58 g L-1.
Kelani and Bebawy8 developed a method that depends on the
interaction of ketoconazole with 2,3-dichloro-5,6-dicyano-p-benzo-quinone (DDQ) to form a highly colored reaction product with lmax
at 588 nm. The mean percentage recovery was 100.4 ± 1.0%, the correlation coefficient of the calibration curve was 0.9989 and the concentration range was from 21 to 170 g L-1.
Farhadi and Maleki9 developed two methods; a
spectrophotome-tric one and also a titrimespectrophotome-tric one using the reaction of triiodide and alizarin red S. The visual titrimetric method can be used with solutions containing ketoconazole in the concentration range from 10-5 to 10-2
mol L-1. The extractive-spectrophotometric method is based on the
formation of a 1:1 ion-association complex between ketoconazole and alizarin red S in acidic citrate buffer that is extractable into chloroform with an absorption maximum at 425 nm. The system obeys Beer’s law in the concentration range from 2.7 to 80 g L-1. These methods
were applied for the analysis of the studied drug in pure form and in their commercial preparations.
Vojic et al.10 proposed an ultraviolet spectrophotometric method
(225 nm; linear range from 3 to 30 g L-1) for the direct quantification
of ketoconazole in commercial tablets after extraction with water. Khashaba et al.11 described two spectrophotometric methods
employing 2,3-dichloro-5,6-dicyano-1,4-benzoquinone (DDQ) in methanol and employing p-chloranilic acid in acetonitrile. The colored species formed show maximum absorption at 460 nm (liner range from 22.5 to 200 mg L-1) and 520 nm (linear range from 7.9 to
280 mg L-1), respectively.
Farhadi and Maleki12 developed a spectrophotometric method
based on the coupled redox-complexation reactions, which proceed in the ketoconazole-iron (III) and 1,10-phenanthroline systems for the determination of ketoconazole in tablet, cream and shampoo Figure 1. Ketoconazole chemical structure
samples. A linear calibration graph was obtained between 1.6-16.0 ppm of ketoconazole.
Abdel-Gawad6 described two other spectrophotometric methods.
The first was based on the reaction of ketoconazole with DDQ in ace-tonitrile. The orange-red color formed showed maximum absorbance at 460 nm. The second is based upon the interaction of the ketocona-zole in dry chloroform with bromophenol blue. This determination is done at 410 nm and the linear range was from 5 to 50 g L-1.
A spectrofluorometric method based on the measurement of the native fluorescence of ketoconazole at 375 nm with excitation at 288 nm has been reported.11 Methanol was used as solvent. Fluorescence intensity
versus concentration is linear for ketoconazole from 49.7 to 800 mg L-1.
El-Ragehy and El-Saharty22 related the formation of copper(II)
and cobalt(II) blue complexes with ketoconazole in dichloromethane. Maximum absorbances occur, respectively, at 720 nm and at 612.5 nm. Suggested procedures based on the stoichiometric reaction were successfully applied to the analysis of the pure drug and its pharma-ceutical formulations. The Beer’s law was obeyed in the range from 2 to 13 g L-1 in the case of copper(II) and from 1 to 8 mg L-1 in the
case of cobalt(II).
Thus, due to the fact that organic solvents are currently used in most spectrometric methods, creating a significant residue disposal problem, the development of spectrophotometric methods for the determination of ketoconazole employing an aqueous solution ins-tead of an organic one is very interesting. In addition it is possible to associate the spectrophotometric method to a flow injection system (FIA) for automation of the analytical procedure. As is known, FIA methods present some interesting qualities as, for instance, high analytical frequency, low cost and use of small aliquots.23
The aim of the present work is to develop a simple and reliable flow injection method with spectrophotometric detection for the quantitative analysis of ketoconazole in tablets using an aqueous iron (III) solution as reagent, working in the total absence of organic solvents and with small quantities of chemicals, therefore developing a green procedure. EXPERIMENTAL
Apparatus
Proposed FIA method
Spectrophotometer Femto model 600S. Optical cell - Hellma glass flow cell with 1.000 cm of optical path. Peristaltic pump – Gilson Minipuls 3. Potentiometric recorder - Linear model 92425.
Sampling valve – This sampling valve has been described previ-ously in detail.24 It essentially consists of three round pieces of black
polytetrafluoroethylene (PTFE) tightly connected through their cen-ters by a screw. Holes of about 1.8 mm in diameter are the paths for the solutions and also the connections for the polyethylene tubes (2.0 mm o.d.) that conduct these solutions to and from the valve. Two of the piecesof black PTFE are fixed on a metallic base and the third (on which is placed a small plastic tube that is the sampling loop of constant volume) is located between the other two as a sandwich. This central piece can be moved in a teeter movement around its axis. This movement allows the introduction of the sample and/or the reagent in an adequate flow. Polyethylene tubes – 1 mm i.d. Tygon® tubes -
(1.75 mm i.d. - Ismatec Two – Stop / Blue- Green). HPLC reference method
HPLC equipment - Waters 600 E with Waters 484 UV-Vis detector. General use
pHmeter – Analyzer model pH 300. Milli Q Plus water deionizer. Centrifuge - Fanem Excelsa II Model 206 BL. Spectrophotometer
- UV-Vis Pharmacia Biotech Ultrospec 2000. Optical cell - Hellma glass cells with 1.000 cm of optical path.
Chemicals, solvents and reagents
All reagents were of analytical grade except ketaconazole, which was a certified pharmaceutical product with 99.0% purity (Sharon Bio-M, batch SBML/KTN/610071). Samples of pharmaceutical for-mulations were purchased locally (200 mg ketoconazole per tablet). Acetonitrile and methanol were of HPLC grade.
Solutions
FIA proposed method
Stock solution of ketoconazole at 0.0300 mol L-1 (M =531.44
g mol-1): In a 100.0 mL volumetric flask 1.5939 g of ketoconazole
was dissolved in 10 mL of deionized water. The pH was adjusted to approximately 3.5 with drops of 2.0 mol L-1 nitric acid solution and
the volume was completed to the mark with water.
Ketoconazole working solutions: from the stock solution adequate dilutions were done with water in order to obtain the following con-centrations: 3.0×10 -4; 6.0×10 -4; 9.0×10 -4; 1.2×10 -3 ; 1.5×10 -3; 1.8×10 -3;
2.1×10 -3 ; 2.4×10 -3; 2.7×10 -3; 3.0×10 -3 mol L-1.
Nitric acid solution at 2.0 mol L-1: in a 100 mL volumetric flask
12.5 mL of concentrated nitric acid were added and the volume was completed to the mark with water.
Iron(III) nitrate solution at 0.100 mol L-1: in a 100.0 mL
volume-tric flask 4.040 g Fe(NO3)3.9H2O (M = 404.00 g mol-1)were dissolved
in 50 mL of water and the volume was completed to the mark. To obtain other concentrations, adequate volumes were pipetted into a 50.0 mL volumetric flask, completing to the mark with water. HPLC reference method20
Ketoconazole stock solution at 100 ppm for HPLC (w/v): in a 50.0 mL volumetric flask 0.01000 g of ketoconazole was dissolved in methanol.
Ketoconazole working solutions for HPLC: from the above 200 ppm ketaconazole stock solution the following concentrations were prepared by adequate dilutions with water: 10, 20, 30, 40, 50 and 60 ppm (w/v). These solutions were used to obtain the calibration curve.
HPLC mobile phase: 60% v/v aqueous acetonitrile solution con-taining 20 mmol L-1 disodium hydrogen orthophosphate and 0.2%
v/v of diethylamine, adjusted to pH 4.0 with orthophosphoric acid. Sample treatment
Proposed FIA method
Twenty tablets were weighed and powdered in a mortar and then kept in closed glass flasks. From these twenty tablets a mean mass of a tablet was calculated. A quantity of the powdered tablets contai-ning approximately 0.08 mg of the pharmaceutical was weighed and transferred to a 15 mL assay tube. Approximately 5 mL of water was added. The pH was adjusted to approximately 3.5 with drops of a 2.0 mol L- 1 nitric acid solution. The solutions were shaken during 1 min
and then centrifuged at 5000 rpm during 5 min. The supernatant was quantitatively transferred to a 50.0 mL volumetric flask. The solid residue was treated twice with 5 mL of water and centrifuged. The supernatant was transferred to the 50.0 mL volumetric flask. The vo-lume was completed to the mark with water and the final solution was homogenized. The residual solid in the centrifuge tube was discarded. HPLC reference method
A quantity of the powdered tablets equivalent to approximately 0.0100 g of the pharmaceutical was weighed and transferred to a 100
mL volumetric flask, shaken with 70 mL of methanol and ultrasonified for 30 min. The volume was completed to the mark with methanol. A quantity of this solution was centrifuged at 5000 rpm for 1 min. 5.00 mL of the clear solution was transferred to a 25 mL volumetric flask. 4 mL of methanol were added and the volume completed with water. Methods
Proposed FIA method
The method is based on the spectrophotometric detection of a colored complex formed between ketoconazole and iron (III) ions in an acidic medium.5 The flow injection manifold is very simple. It is
depicted in Figure 2. The aqueous solution containing ketoconazole is mixed with the aqueous reagent solution of iron (III) nitrate and nitric acid. The resulting solution contains the colored complex that presents an absorbance maximum at 495 nm.
HPLC reference method
As reference method the HPLC procedure described by Low and Wangboonskul,20 which is equivalent to the USP3 procedure, was
used. HPLC experiments were performed on a Waters HPLC 600E with Waters 484 UV-VIS detector operated at 232 nm. A Rheodyne injector (loop 20 mL) and interface Waters 746 were also used. The column was a Varianâ Microsorb C
18 (250 × 4.6 mm i.d.) with a particle
size of 5 micrometers. Statistical analysis
The statistical Student’s t-test25 was applied to compare the results
obtained by the two analytical methods, the proposed FIA and the reference HPLC procedures.20 The F-test was also applied in order
to compare the precision of the methods.25
RESULTS AND DISCUSSION The chemical reaction
The factors affecting the reaction such as pH, reagent concen-tration and solvent effect were studied. The influence of the counter anion of the iron salt used in the complex formation was investigated. The molar ratio between ketoconazole and iron (III) in the complex was also determined.
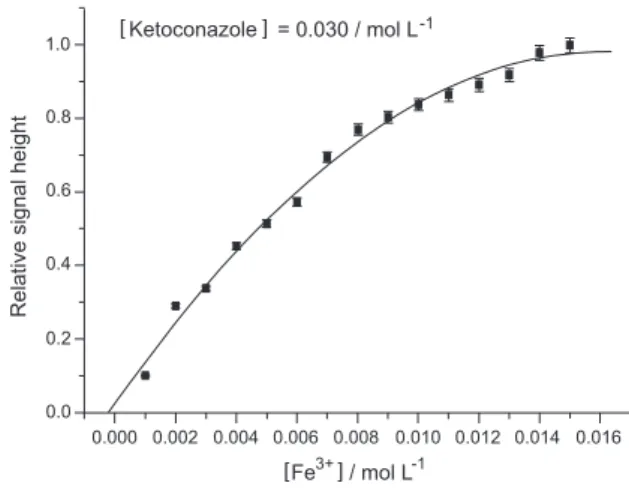
Differently from Abdel-Gawal,5 who used thiocyanate as an
intermediate ion to form the iron(III) ketoconazole complex that was then extracted with the organic solvent 1,2-dichloroethane, in our work the complex was formed in aqueous solution, directly reacting the dissolved drug with the ferric ions. The molar ratio of ketoconazole to iron(III) was found to be 2:1 as the signal intensity remains constant after this proportion (Figure 3). The same ratio was reported by Abdel-Gawal.6
Chloride (FeCl3.6H2O), sulfate (FeNH4SO4.12H2O) and nitrate (Fe(NO3)3.9H2O) salts were used to study the influence of the counter anion on complex formation. Equal volumes of a 0.0300 mol L-1
ketoconazole solution and of a 0.0300 mol L-1 of each salt solution
were mixed and the final absorbance was measured at 495 nm. In the cases where no acid was added the best results were obtained with iron(III) chloride.
The same studies were performed in presence of acid. 2.0 mol L- 1
hydrochloric, nitric or acetic acids were separately added in the salt solution until pH ca. 3.5. In the iron(III) chloride case no influence of any of these acids was observed. In the case of iron(III) nitrate, however, the best results, better than those with the chloride salt, were observed in presence of nitric acid. When the sulfate salt was used very small absorbance values were observed, indicating little formation of the complex. Therefore nitric acid and ferric nitrate were used in the analytical procedure.
The optimization of the effect of the molar proportion iron to ketoconazole on the analytical signal was studied and the relation 3:1 was found to be adequate. An excess of iron ions with respect to ketoconazole was used in order to guarantee the complete formation of the complex. The excess of iron, as expected, does not interfere in the analytical signal. Therefore the molar ratio of 3 iron to 1 ke-toconazole was adopted in this work.
The FIA system
Experimental parameters such as total flow rate, aliquot solution volume and reaction coil length were studied.
The influence of the total flow rate was investigated from 0.99 to 1.72 mL min-1. The flows of the reagent solution and of the carrier
were maintained equal. The iron concentration was maintained at 0.0150 mol L-1, and the ketoconazole concentration at 0.0300 mol
L-1; 300 mL was the aliquot volume. The reaction coil distance was
studied from 15 to 90 cm. The best results, according to Table 1, were 1.22 mL min-1 for the flow rate and 30 cm for the reaction coil.
Therefore they were adopted.
The influence of the aliquot volume was evaluated from 160 to 565 mL. The results are shown in Table 2. The best signals were obtained with aliquots of 500 mL, therefore this volume was adopted for the analytical method.
The calibration curve
Using the determined parameters of the flow system, a cali-bration curve was constructed, from 3.0 ×10 -4 to 3.0×10 -3 mol L-1.
It is described by the equation S =2.694 + 3312 C, where S is the signal height in centimeters and C the concentration of ketoconazole Figure 2. Scheme of the flow injection manifold: R reagent solution (iron(III)
nitrate solution, 0.100 mol L-1 ) ; C carrier (deionized water); S sample valve; P peristaltic pump; L reaction coil; D detector (spectrophotometer, l= 495 nm ); DR data recorder; W waste
Figure 3. Relative signal height with respect to iron(III) nitrate concentration. Total flow rate: 1.22 ml min-1; reaction coil length: 30 cm; aliquot volume: 300 mL; ketoconazole concentration: 0.0300 mol L-1
in mol L 1. The correlation coefficient, R, is 0.998. The detection
limit was estimated to be 1×10 -4 mol L-1 and the quantitation limit
is 3×10 -4 mol L-1.
Pharmaceutical preparations analyses
Seven pharmaceutical preparations from different laboratories were analyzed according to the proposed method and according to the HPLC reference method.20 The results obtained are described in Table 3.
The following excipients are present in the analyzed pharma-ceutical preparations; I: starch, microcrystalline cellulose, colloi-dal silicon dioxide, magnesium stearate, lactose monohydrate, povidone (polyvinylpyrrolidone); II: microcrystalline cellulose, pregelatinized starch, lactose monohydrate, magnesium stearate, colloidal silicon dioxide, sodium glycolate; III: lactose, povidone, starch, magnesium stearate, silicon dioxide; IV: ethyl alcohol, corn starch, colloidal silicon dioxide, magnesium stearate, lactose, povidone, sodium croscarmellose; V: lactose, starch, povidone, carboxymethylcellulose, colloidal silicon dioxide, magnesium
stearate; VI: lactose, starch, povidone, silicon dioxide, magne-sium stearate, microcrystalline cellulose; VII: lactose, povidone, magnesium stearate, silicon dioxide, sodium starch glycolate, microcrystalline cellulose.
All the preparations had nominal concentration of the active ingredients of 200 mg per tablet.
A total of fourteen excipients are present in the analyzed prepara-tions. They were present in the tablets in different combinations and proportions according to specific formulations of each pharmaceutical laboratory. No analytical interference was observed in any case on the precisions and accuracies obtained.
According to the results related in Table 3, a good correlation between the FIA and the HPLC reference methods at the 95% of confidence level is observed. The statistical comparison of the two sets of FIA analyses also shows complete agreement at 95% of confidence level.
CONCLUSION
The proposed method applied to ketoconazole pharmaceutical preparations offers quantitative analytical results of good precision and accuracy when compared to the HPLC method. This new procedure can be considered a green method as it avoids the use of organic solvents and of potentially toxic reagents, uses small quantities of reagents, is simple and fast and involves minimal sample preparation steps when compared to the reference HPLC procedure. Also, the instrumentation used is simple and of rela-tively low cost.
Seven different pharmaceutical preparations purchased in the local market were analyzed. The statistical Student’s t- test and the Snedecor F-test show that the proposed method correlates with the HPLC reference method at the 95% of confidence level.
These real samples present a total of fourteen excipients mixed in different combinations and proportions according to the specific formulation of each pharmaceutical laboratory. No interference on the analytical results was observed in any case.
Based on these results the method can be recommended for the quantitative analysis of ketoconazole in pharmaceutical tablets. ACKNOWLEDGEMENTS
The authors are grateful to CNPq, FAPESP and CAPES for fi-nancial support and to Prof. Dr. C. H. Collins for the English revision of the manuscript.
Table 3. Statistical comparison of the proposed FIA method with the HPLC procedure. The ketoconazole concentration is expressed in milligrams per tableta
Sample HPLC RSD % FIA1 RSD % FIA2 RSD % t1 t2 t3 F1 F2 F3
I 206 ± 3 1.5 214 ± 5 2.3 212 ± 2 0.9 1.94 2.35 0.53 2.78 2.25 6.25 II 215 ± 2 0.9 211 ± 4 1.9 207 ± 4 1.9 1.26 2.00 1.00 4.00 4.00 1.00 III 207 ± 3 1.5 212 ± 2 0.9 208 ± 3 1.4 1.96 0.39 0.62 2.25 1.00 2.25 IV 213 ± 2 0.9 216 ± 2 0.9 208 ± 2 1.0 1.50 2.50 2.25 1.00 1.00 1.00 V 210 ± 3 1.4 215 ± 2 0.9 209 ± 7 3.4 1.96 1.86 1.17 2.25 5.44 12.3 VI 215 ± 3 1.4 218 ± 3 1.4 208 ± 5 2.4 1.00 1.70 2.43 1.00 2.94 2.43 VII 209 ± 2 1.0 215 ± 3 1.4 207 ± 3 1.4 2.35 0.67 2.67 1.96 1.96 1.00 Mean RSD % 1.2 1.4 1.8
n = 2n-2=4, as n= 3; for a=0.05, critical t=2.78 and critical F = 19.0 25 aThe nominal value declared by the pharmaceutical laboratories is 200 mg per tablet.
The mean mass in g, and its standard deviation, of a tablet of each pharmaceutical preparation was determined on basis of the mass of 20 tablets: (I) 0.325 ±
0.005; (II) 0.384±0,005; (III) 0.297±0,004; (IV) 0.382±0.003; (V) 0.352±0.004; (VI) 0.313±0.006; (VII) 0.402±0.004. Student’s calculated t: t1 comparison between HPLC and FIA1 results on one day; t2 comparison between HPLC and FIA2, results obtained on different days; t3 comparison between two inter day FIA analyses. Snedecor’s F calculated values: F1between HPLC and FIA1; F2 between HPLC and FIA2; F3 between FIA1 and FIA2.
Table 1. Relative signal height with respect to the flow rate and to the length of the reaction coil
Reaction coil length/cm
15 30 60 90
Flow
rate/mL min-1 Relative signal height
0.99 0.62 0.92 0.92 0.92
1.22 0.77 1.00 0.87 0.99
1.49 0.70 0.96 0.91 0.91
1.72 0.59 0.84 0.84 0.93
Table 2. Relative signal height (RSH) with respect to the aliquot volume. Iron(III) nitrate concentration: 0.0150 mol L-1. Total flow rate: 1.22 mL min-1;
reaction coil length: 30 cm; ketoconazole concentration: 0.0300 mol L-1
Aliquot mL RSH 160 0.49 225 0.65 300 0.77 375 0.85 460 0.91 500 1.00 565 0.85
REFERENCES
1. Tavares, W.; Manual de antibióticos e quimioterápicos antiinfecciosos, 3a ed., Atheneu: São Paulo, 2001.
2. Murray, P. R.; Baron E.J.; Jorgensen J.H.; Pfaller, M.; Landry, M.L.; Manual of clinical microbiology. 8th ed., ASM: Washington, 2003, vol.
2.
3. The United States Pharmacopeia, 28th ed., United States Pharmacopeial
Convention Inc: Rockville, 2005.
4. Kedor-Hackmann, E. R. M.; Nery, M. M. F.; Santoro, M. I. R. M.; Anal. Lett.1994, 27, 363.
5. Abdel-Gawad, F. M.; Farmaco1997, 52, 119.
6. Abdel-Gawad, F. M.; J. Pharm. Biomed. Anal.1997, 15, 1679. 7. Sadeghi, S.; Shamsipur, M.; Anal. Lett. 1998, 31, 269. 8. Kelani, K.; Bebawy, L. I.; Anal. Lett.1997, 30, 1843.
9. Farhadi, K.; Maleki, R.; J. Pharm. Biomed. Anal.2002, 30, 1023. 10. Vojic, M. P.; Popovic, G. V.; Sladic, D. M.; Pfendt, L. B.; J. Serb. Chem.
Soc. 2005, 70, 67.
11. Khashaba, P. Y.; El-Shabouri, S. R.; Emara, K. M.; Mohamed, A. M.; J. Pharm. Biomed. Anal.2000, 22, 363.
12. Farhadi, K.; Maleki, R.; Anal. Sci. 2001, 17, 867. 13. Jalali, F.; Afshoon, A.; J. Fluoresc. 2008, 18, 219.
14. Hoffman, D. W.; Jones-King, K. L.; Ravaris, C. L.; Edkins, R. D.; Anal. Biochem. 1998, 172, 495.
15. Al-Meshal, M. A.; Anal Lett. 1989, 22, 2249.
16. Heyden, Y. V.; Nguyet, A. N. M.; Detaevernier, M. R.; Massart, D. L.; Plaizire-Vercammen, J.; J. Chromatogr., A 2002, 958, 191.
17. Nguyet, A. N. M.; Tallieu, L.; Plaizire-Vercammen, J.; Massart, D. L.; Heyden, Y. V.; J. Pharm. Biomed. Anal. 2003,32, 1.
18. Nguyet, A. N. M.; van Nederkassel, A. M.; Tallieu, L.; Kuttatharm-makul, S.; Hund, E.; Hu, Y.; Smeyers-Verbeke, J.; Heyden, Y. V.; Anal. Chim. Acta 2004, 516, 87.
19. Staub, I.; Bergold, A. M.; Acta Farm. Bonaer.2004, 23, 387. 20. Low, A. S.; Wangboonskul, J.; Analyst1999, 124, 158. 21. Görög, S.; J. Pharm. Biomed. Anal.2005, 36, 93.
22. El-Ragehy, N.; El-Saharty, Y. S. I.; J. AOAC Int.2001, 84, 563. 23. Reis, B. F.; Quim.Nova 1996,19, 51.
24. Tubino, M.; Barros, F.; Quim. Nova1991, 14, 49.
25. Eckschlager, K.; Errors, Measurement and Results in Chemical Analysis, van Nostrand Reinhold Company: London, 1972, p. 109-120.