Correlation
Approach
to
Identify Coding Regions
in DNA
Sequences
S. M. Ossadnik,* S. V. Buldyrev,* A. L. Goldberger,$ S. HavIin,*§ R.N. Mantegna,* C.-K.Peng,**
M. Simons," and H. E. Stanley**Center forPolymerStudies and DepartmentofPhysics,Boston University, Boston, Massachussetts 02215USA,tCardiovascular Division, Harvard Medical School,Beth IsraelHospital, Boston, Massachussetts 02215USA,§DepartmentofPhysics, Bar IlanUniversity,Ramat
Gan,Israel,and1DepartmentofBiology, MassachussettsInstitute ofTechnology, Cambridge, Massachussetts02139 USA
ABSTRACT Recently, itwasobserved that noncoding regions of DNAsequences possesslong-range power-law correlations, whereas coding regions typically display only short-range correlations. We develop an algorithm based on thisfinding that enables investigatorstoperformastatisticalanalysisonlongDNAsequencestolocatepossible coding regions. The algorithm is particularly successful in predicting the location of lengthy coding regions. For example, for the completegenomeof yeast chromosome III (315,344 nucleotides), at least 82% of the predictions correspond toputative coding regions; the algorithm
correctly identified all coding regions larger than 3000 nucleotides, 92% of coding regions between 2000and3000 nucleotides long, and 79% of coding regions between 1000 and 2000 nucleotides. The predictive ability of thisnewalgorithm supports the claim thatthere isafundamental difference in the correlation property betweencoding and noncodingsequences.Thisalgorithm, which isnotspecies-dependent, canbe implemented with other techniques for rapidly and accurately locating relatively long coding regions ingenomic sequences.
INTRODUCTION
One ofthemajor problems facing researchers workingwith long genomic DNA sequences is the need for arapid and
accuratemethodofidentifying coding regions. Currently, a
typical search foracodingregion involves scanningthe DNA sequencefor thepresenceofanopenreading frame(longer
thanacertainarbitrarilydefinedlength)forboth orientations
and forallpossible frame-shift positions.Theidentifiedopen
readingframes are thensearchedforcanonical intron splice sites and for the existence ofcDNA orprotein matches by using appropriate data bases. These methods are
labor-intensive and require considerableoperatorparticipation. In contrast, an idealtechnique wouldbe fast andaccurateand
require only minimal operator input.
Recently,amultiplesensorneuralnetworkapproachwas
developed by Uberbacher and Mural(1991)tolocate protein-coding regions. Their approach involves calculating the
val-uesofagroupofseven sensoralgorithmsover awindowof 99 consecutive bp. Aneural network training procedure is
thenperformed on atraining setof human DNA sequences
foroptimizing the weights of the differentsensoralgorithms.
Thisapproachhas been usedtodetectcoding regionsin
hu-man DNA withgood predictive power. However, because
most ofthose sensor algorithms are species-sensitive, the parameters needto be adjusted for otherorganisms (espe-ciallynonmammalian DNAsequences). Therefore,an
algo-rithm basedon amoregeneral principle that can be applied
acrosstheentirephylogeneticspectrumwithout modification would bedesirable.
Receivedforpublication22February 1994 and in finalform 18April 1994. Addressreprint requeststo H.Eugene Stanley, Center for Polymer Studies,
DepartmentofPhysics,590Commonwealth Avenue, Boston, MA 02215. Tel.:617-353-2617;Fax:617-353-3783; E-mail: [email protected].
i 1994bytheBiophysical Society 0006-3495/94/07/64/07 $2.00
Wehavedevelopedsuchatool forrapid identificationof DNAcodingelements based on ourobservation of the
ex-istence ofpower-law long-range correlationsin noncoding,
but not in coding, sequences (Peng et al., 1992). The key general concept underlying this new technique, which we
call the "coding sequence finder" (CSF) algorithm, is to
"drag"anobservation boxalong theDNA sequenceand to measurecontinuouslythe"signal" fromadevice that quan-tifiesthedegree of power-law long-range correlation.
Non-coding regions aretypically characterized by a correlation
that is long-range in that it decays not exponentially but, rather, as a power law. On the otherhand, coding regions typically display only short-range correlations, which decay exponentially.
WetesttheCSFalgorithmon avarietyoflongDNA se-quences, including the recently sequenced Yeast III
chro-mosome,whichcomprises 315,344 bp (Oliveretal., 1992).
Thealgorithm is foundtowork well when thecoding regions
aremoderately large(over1000bpinlength).Wealso
con-firm its accuracy on long, artificially generated "control" sequencescomprised ofknowncoding and known noncod-ing sub-sequences.
POWER-LAW LONG-RANGE CORRELATIONS
To quantify thecorrelation properties of a DNA sequence, itisconvenienttointroduceagraphicalor"landscape"
rep-resentation, termed a DNA walk (Peng et al., 1992). For the conventional one-dimensional random walk model
(MontrollandShlesinger,1984),awalkermoveseither"up" [u(i)= +1]or"down" [u(i)= -1]oneunitlengthfor each step i of the walk. For thecaseofanuncorrelatedwalk, the directionofeachstepisindependentoftheprevioussteps. Forthe case ofa correlatedrandomwalk, the direction of each stepdependsonthehistory("memory")of the walker.
Coding DNA Sequences
One possible choice for the DNA walk can be defined asfollows: the walker steps"up" [u(i) = +1] ifa pyrimi-dine (C or T) occurs at position a linear distance i along the DNAchain, whereas the walker steps "down" [u(i) =
-1] if apurine (AorG) occursatposition i.Other
defini-tions are discussed in Discussion and Summary. A key question is ifsuch awalk displaysonly short-range
corre-lations (asin an n-step Markov chain)or power-law
long-range correlations (as in critical phenomena and other
scale-free "fractal"phenomena).
TheDNAwalkprovidesagraphicalrepresentation forany DNA sequenceandpermits the degree of correlation inthe
basepair sequence to bevisualizeddirectly.Toquantify this correlation, one calculates the"net displacement,"
y(f),
ofthe walker after fsteps, which is the sumof the unitsteps
u(i) foreach step i. Thus,y(f) u(i).
One difficulty in analyzing DNA sequences by random walk method is that DNA sequences are highly
heteroge-neous.Thus, the problem of howtodistinguish "patchiness" fromtruly fractal(scale-invariant)typeofbehavior needsto
be addressed (Karlin and Brendel, 1993). In Peng et al.
(1992), a"min-max"methodwasproposedtotake into ac-count the nucleotide heterogeneity and changes in strand
bias. Apotentialdrawback of this methodisthat itrequires the investigator to judge how many local maxima and
minima ofalandscapetoutilize in theanalysis. Recently,we
presented a new method: "detrendedfluctuation analysis" (DFA),thatisindependentofinvestigator inputandpermits
thedetection ofpower-law long-range correlations embed-ded inapatchylandscape,and also avoids thespurious
de-tection of apparent power-law long-range correlations that
are anartifact ofnucleotide patchiness (Penget al., 1994). TheDFAmethodis carriedout asfollows:first,wedivide the entire sequence of length N into Nle nonoverlapping boxes, each containing enucleotides, and define the "local
trend" ineachboxtobe the ordinate ofalinearleast-squares fit for the DNA walk displacement in that box. Next we
define the "detrended walk," denoted byye(n), as the dif-ference between theoriginal walky(n) andthelocal trend.
Wecalculate the variance about the local trend for each box
andcalculatethe average ofthesevariancesoveralltheboxes
of size e, denotedF2(e). Thus,
l N
F2()
)-NI
y2(n).
(1)n=1
It was shown (Peng et al., 1994) that the calculation of
Fd(f)canclearly distinguishtwodifferenttypesof behavior:
(i)
Fd(4)
-V1/2
forpatchybut otherwiseuncorrelated(or onlyshort-range correlated) sequences,and (ii)
Fd(e) 4ea (2)
witha 0 1/2, ifthere is no characteristiclength for the
cor-relations.
Typical data for Fd(e) are linear on double logarithmic plots,confirming that, indeed,Fd(e) -
e3.
Aleast-squares fitof suchdata produces a straight line with slope a. Itwas
observed that for
coding
sequences, ac 1/2, whereas fornoncodingsequences,aissubstantiallylarger than 1/2(Peng
et al., 1992, 1994).
CODING SEQUENCE FINDER
(CSF)
ALGORITHMThe focus of the CSF algorithm is the calculation ofthe
correlationexponentafordifferentsub-regionsof the DNA sequence. If a,measured from asub-region, iscloseto0.5 it meansthatthis sub-region ismorelikelytobelongto the coding part of the sequence, which is in accord with our
finding that the coding sequences do nothave power-law long-range correlations. If,onthe otherhand,the value ofa
foraregionis muchlargerthan0.5, then thisregion ismore
likely tobelongto the noncodingpart of the sequence. Note, however, that a cannot be calculatedfor a single nucleotide. Instead, theexponent a,defined by the behavior
of thefluctuationFd(f), canbecalculatedonlyfor a
subse-quence of nucleotides withlength w >>4.
Therefore, we have devised the following 6-step proce-dure:
Step 1. CalculateFd(e)forthesubsequence(windowofsize w) from nucleotide n - w/2 to nucleotide n + w/2, for a
continuous sequence ofpositions n ranging from the first nucleotide (n = w/2)tothe last(n= N- w/2),where Nis
the total number ofbp.
Step 2. Constructalog-log plot ofFd(f)vs.4. Theexponent a a(n)is estimated from theslopeof theplot.Tocalculate theslope,we makealinearregression fit for thedatainthe
rangefrom
3I
to42.
Thus,thelocalvalueofa(n) isafunction ofwindow sizewand fittingrange[l,
4].Step 3. Select an appropriate window size w and fitting
range
le,
42].
Thelower cutoffvalue 4 is chosen such thataisnotaffectedbytheshort-range(Markovian) correlations. Althoughwe prefertohavevery large
42
we musttake 2much smaller than w, because theerror ofestimation ofa
rapidly increases when4approachesw.The ratio
w/f2
rep-resents the number of statistically independent measure-mentsby which the valueFd(e)is obtained. The error ofais, therefore, inversely proportional to the square rootofthis ratio. Indeed,wehave shownrigorously(Pengetal.,1993)that the SDoaof the value ofacanbecalculatedby the formula
(J=CW,
(3)
whereC isacoefficientthatiscloseto0.1.Ourselection criterion forwand 2is that theSDor"error"a.mustbe muchsmaller
thanthe difference ofavalues betweencodingandnoncoding
sequences,i.e.,thesignal-to-noise ratiomustbeaslargeas pos-sible.
Ourunpublished observations, basedonsamplingover a
widerange ofphylogeneticspectrum, reveal that the average value ofaforcoding regionsobtainedbyDFA for thefitting
range
El
= 10,42
= 100 is 0.51, whereas for noncoding regions it is 0.59. Therefore, wechoose w 2 1042, which from(3) gives or'0.03,an errorconsiderably smaller than theexcursionsinabetweencoding and noncoding regions, 0.59 - 0.51 = 0.08.Furthermore, thereis a trade-off in our choice of param-eters: by increasingthe window size and thefitting range,one
increases the accuracy of the value ofabut decreasesthe
accuracy oflocatingthis value alongthe sequence. Step 4. Smoothouttheresultingfunctiona(n).The function
a(n) is a rather irregular oscillatory function with many minima and maxima.Twofactors contributetothisirregular spatial fluctuation: (i) alternating coding and noncoding
re-gions have different exponenta(this is the "signal" thatwe
want); and (ii) the error inestimating a from afinite sub-sequence(this is the "noise"that wedonotwant).Therefore,
our goal is not to smooth arbitrarily but, rather, only to
smooth in suchafashionas tominimize the effectof(ii).The twoeffectsaredistinguishable, because the fluctuations that
are more likely caused by the noise are "high-frequency" comparedwith thefluctuationscausedby alternationof cod-ing andnoncoding regions. For this reason, a simple low-pass filter(Pressetal., 1991) is quite effective. Alternatively, we maysimply average together a(n)for severalnearbyvalues
ofn. Ourpreliminary calculationsshow that bothsmoothing procedures give similar results.
Step 5. Comparethea(n)function with locations of known
coding regions. The smoothed function a(n) usually has minima ofabout 0.5,whichcorrespondtothe local absence ofpower-law long-range correlations (seeFig. 1). Indeed, comparing the function a(n) for the sequence of yeast chromosomeIII (for which many of the coding regionsare
known), wecan seethatminima of a(n) correspond
remark-YeastChromosome III (315344 nt)
a nucleotide position 40000 50000 nucleotideposition nucleotideposition 0.7 0.6 a 0.5 60000 0.430000 40000 50000 nucleotideposition
FIGURE 1 (a) Analysisof section ofyeastchromosome IIIusing the sliding box CSF algorithm. The value of the long-range correlationexponenta
is shownas afunctionofposition along the DNA chain.Inthis figure, the results for about 10% of theDNAareshown(from base pair30,000tobase
pair 60,000). Shownasvertical barsaretheputativegenesandopenreading frames; denoted by the letter "G"arethosegenesthat have beenmorefirmly
identified(March1993 version ofGenBank).Note that thelocal value ofatypically displays minima wheregenesaresuspected, whereas between thegenes
adisplaysmaxima. This behaviorcorrespondstothe fact thatthe DNAsequencesofcoding regions lack power-law long-range correlations (a=0.5 in
the idealizedlimit),whereas the DNA sequences in betweencodingregionspossesspower-law long-rangecorrelations(a 0.6).Parameter values:w= 800,el=8, 42= 64.(b)The solidcurveis thesameasinparta,whereas the dottedcurveis thesameanalysis applied after 0.5% of the bp have in the
samesequencebeenrandomlymutated.(c)The solidcurveisthesame asinparta,whereas the dottedcurveis thesameanalysis applied after 0.5% of thebpinthesamesequencehave beenrandomly shiftedtoarandomly-chosen position. (d) The solidcurveis thesame asinparta,whereasthedotted
curveis thesameanalysis appliedafter both theoperations ofpartsb andchave been carriedout.
0.7
0.6
0.5
0.4 LW
Coding DNA Sequences
ably wellto thepositions ofputativecoding regions
(iden-tified genes or openreadingframes),whereas intergenomic sequencesusually correspondto thelocal maxima of a(n). Step6. The aboveprocedure(steps 1-5) outlines thebasic CSFalgorithm.Step6demonstrateshowthe CSFalgorithm canbecombinedwith other local criteria formoreprecise identification of coding sequences. For example, for yeast
chromosome III, where thecoding regionsaretypically
un-interrupted by introns,one canincorporate information about
openreading framesand stop codons. Areadingframeisone ofthree possiblewaysofdividingsequences oneachof two
complementary DNA strands into subsequent codons. An openreading frame is areading framewithout thestop sig-nalsTAG,TGA, and TAA. Therefore,topredict the actual
boundaries ofcoding regions from ourcalculated function
a(n),
wecancarry outthe following additional procedure:(a) Find all local minima ofa(n).
(b) Identify thesix openreading frames(threeoneachof
the complementaryDNAstrands).
(c) Define thelongestopenreading framecorresponding
to aminimumvalueof a.Long open readingframeswithout power-lawlong-range correlations are very likely to be
ac-tualcoding regions.
EVALUATION OFTHE CSF ALGORITHM Test foryeastchromosome III
Tocharacterizequantitatively the goodnessof ouralgorithm,
weconsider the relative positionsoflocalminima,maxima, andthe boundaries ofcoding regions.
For example, the outcome of the CSF algorithm (steps 1-5) for the test case ofyeast chromosome III, using the
parameterchoicesw = 800,
el
= 16,f2=
64 canbe char-acterizedby the following table:* Total number ofputative codingregionsknown from work
ofothers (Oliveretal., 1992): 218.
* Fraction of the 315,344 bpbelonging toputative coding regions:p = 0.66.
* Number of minima in a(n): 176.
* Numberofsuch minimabelongingtoputativecoding
re-gions(true positives): 138. * Number offalsepositives: 38.
Thus,of 176minima,all but 38correspondtoputative coding regions. A key statistical test of the CSF algorithm is to
demonstrate that the apparently strikingagreementbetween
theputativecoding regionsand thedipsin
ae(n)
is notsimplyaresult of random coincidence. Therefore, we assume the contrary, i.e., that the dips are occurring at random. Then, becausethere are 176minimain oura(n) plot, 176 Xp =
176 X(0.66)= 116of the minima shouldlieinside putative coding regions,and 176 X (1 -p) = 176 X(0.34) = 60 of
the minimashould lie outside putative coding regions.The
SD forthe above estimation(assumingthatthese176minima
are occurring at random) is given by the formula cr =
V176
XpX (1 -p).Hence,inthe present case, we would expector=\/176
X 0.66 X0.34 = 6.3.The actual numberoffalsepositives is38, three SD smaller than the
expected
value 60. The probability of obtaining this result if the minima didnotcorrespondtothecodingregions,therefore,
is the chance offinding a signal 3 SD from the expected value, or 0.0014.
Thecombination of the CSFalgorithm (based onglobal
criteria ofpower-lawlong-range correlations)withlocal cri-teria (stop codons; see step 6 above) is very successful in
identifyingtheprecise boundariesoflong codingregions. It enablesus toidentifycorrectlyintheyeastchromosome III
100% of theputative coding regions with more than 3000
nucleotides, 92% ofcoding regionswithbetween 2000 and 3000nucleotides long and79% ofcoding regionsbetween 1000 and 2000 nucleotideslong.
The "false positives" identified by the CSF algorithm
might actually indicate the presence of formercoding ma-terial, such aspseudo-genes, jumpinggenes, and retroviral inserts. Forexample,for yeastchromosome III,wefounda
clearminimum in a(n)nearthepositionn = 149200, a re-gionthat isknowntocontainprimarily noncodingsequences. Wesubmitted the sequence from nucleotide position 149120
tonucleotideposition149401 to the experimentalGENINFO
BLAST(Altschuletal., 1990)networkattheNational Center for Biotechnology Information, which indicated a
remark-ably high similarity score ofthesubmitted sequence to the
jumpinggene known asretroelementTy4-476.
We measured"falsenegatives"by focusingon asubset of all open reading frames, those of more than 1000 bp. We
definefalsenegatives to be the absence of anunambiguous
pronounced minimum in a(n). We find that the CSF
algo-rithm failstolocateonly12%(3/25)oftheknown genes, but failsto locate 27% (16/60)of theopen readingframesthat
arenotknowntobegenes.Thus,theCSF algorithm is much
moresuccessfulontheknown genes than on putative genes.
Robustness of the CSF algorithm with respect to
sequencing
errorsWeperformedthree testsdesigned to test therobustnessof theCSFalgorithmwithrespect tosequencingerrors,by in-tentionally "mutating" a small fraction of thebp: 0.5%.The CSFalgorithmwould be most useful if itcould still be able to identify most of thecoding regions. Fig. 1 b shows the sameregion as shown in Fig. 1 a of the paper. The solid curve isidentical to the solid curve inFig. 1 a, namely, the CSF
algorithmresultfor thelong-rangecorrelation exponent aas
afunction of position in yeast chromosome III. The dotted curveis the sameanalysis applied to an"artificiallymutated" yeast chromosome III in which 0.5% of the bp were ran-domly substituted by a differentbp.There isalmostno dif-ference between the two curves whatsoever.
Another test is to randomly shift the reading frame, as shown inFig. 1 c. Thesolid curve is the same as inFig. 1.
Thedottedcurve isthe same analysis appliedto amutated chromosomeIII, in which 0.5% of the bp wererandomlycut outfrom one place and inserted in anotherrandomlyselected
locus of the chromosomein suchawayastoshift thereading frame. There is almost no changewhatsoever.
Finally, we show in Fig. 1 d what happens when both operationsofFig. 1,b andc,have beencarried out, sothat in fact twice asmany (1%) of the bp are mutated intotal.
Parameter optimization
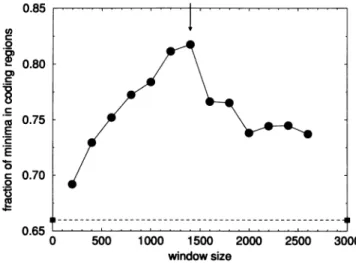
Wenote thattheaccuracy of thealgorithm depends
impor-tantly on thewindow sizeparameter. Fig. 2 shows the
de-pendenceonwindow size of the fraction of minima thatoccur in coding regions for yeast chromosome III. Reducing the window sizeincreases the number oftruepositives (the sen-sitivity of thealgorithm) but increasesthe number of "false
positives" and "false negatives." This is the reasonthe
al-gorithm initspresent formischallenged forfindinggenes in mammalian sequences, whicharehighly fragmented by introns.Although theaveragesize ofanexoninmammalian DNAisonly about 186 bp (Watsonetal., 1992) (closetothe
lower threshold ofapplicability ofouralgorithm), thereare
many mammalian exons larger than the average that our method shoulddetect readily.
We have also studied how the fluctuations of the DNA
landscapes created by otherrules ofmappingcanbeused for
detectingcoding regionsaswellasvarious two-dimensional
DNAwalks(Berthelsenetal., 1992).In thegeneralized defi-nitionofaone-dimensional DNAwalk, one canassign dif-ferent values
SA,
SC, SG,
orSTtoanincrementof the ith step u(i)dependingonwhich nucleotideA, C, G,orToccurs on the ith place. For example,we studied correlations ofone nucleotidewithitself;inthiscase, one canassign u(i) = +1ifnucleotideAoccurs onthe ithplace andu(i) = -1
oth-0.85 0 ._C 0 " 0.80 E 0.75 E r 0.70 0 0.65 t 0 500 1000 1500 2000 2500 3000 windowsize
FIGURE 2 Dependence of sensitivity of CSF algorithmonwindow size,
w,foryeastchromosome III.Sensitivity here is definedasthepercentage of theminima ofca that lie withinputative coding regions (see Fig. 1). Window size is defined inthetext(Step 1 of the algorithm).The solid circles
showthe results for the yeastchromosome III. Forwindowsizes less than 600,thefittingrangewaschosentobee,=8, 42=32.For windowsizes
largerorequal 600,wechose 42= 64. Theverticalarrowindicates the optimal nucleotide window size. The dashed line is the expected sensitivity
ofthealgorithm basedonrandom coincidence (see text).
erwise (incaseof C, G,or T). Similarly,westudied corre-lations ofpairs of nucleotides, suchasthepurine-pyrimidine ruleweused above.Except for the definition of u(i), therest
of theanalysisremains thesame asfor theoriginal purine-pyrimidine rule. Our calculations show that the original bi-narypurine-pyrimidine rule (Peng etal., 1992) is themost
robustone for detecting coding regions.
Test of the CSF algorithm on other long genomic sequences
We also applied the CSF algorithm (steps 1-5)to four ad-ditional long genomicsequences and observed comparable predictabilityasfor theyeastchromosome III. Thesequences were:liverwort marchantiapolymorpha chloroplastgenome
(GenBankname:CHMPXX, 121024 bp; 59% coding region, CSFsensitivity=74%withwindowsizew =1000); tobacco chloroplastgenomeDNA(CHNTXX, 155844bp; 53% cod-ingregions, CSF sensitivity = 72% with window sizew =
1200); rice complete chloroplast genome (CHOSXX, 134525bp; 50% coding regions,CSFsensitivity=68% with window size w = 2200); and Epstein-Barr virus (EBV ge-nome,172281bp; 71% coding, CSF sensitivity =90% with
window size w = 1400).
Test of the CSFalgorithm on control sequences
Notall "coding regions" for theyeastchromosome IIIand
othergenomicsequences we testedare confirmed (in fact, they are termed "putative coding regions" (Oliver et al., 1992)). Toobtainadditional evidence about thereliability of
the CSF algorithm, we analyzed "control sequences" that
containonly firmly identified codingandnoncoding regions. To thisend,wehave selectedfrom GenBank40 known cod-ingsequences(includingexonsandcDNAsequences) and 39 known noncoding sequences (including introns and in-tergenomic sequences). These samples (total length 80,000 bp) represent awide phylogenetic spectrum (including
se-quencesfromhuman, chicken,tobacco, bacterial, andviral DNA). The selection criteria for thesesequences are:(i) they areall oflengthgreaterthan 500bp, and (ii) thepercentage ofcodingandnoncodingmaterialapproximatesthat ofyeast chromosome III.
Next we "assembled" an artificial nucleotide sequence ("TypeIcontrols") by randomlysplicing together coding and noncodingsequences(inanalternating fashion) from thetwo
sample pools. We then applied the CSF algorithm to this controlsequenceandcomputedthenumber of minimainside and outside the known coding regions. We found that for window sizew= 800,almost90%of the minimacoincided
with coding regions. The percentage ofcorrect identifica-tions decreased to 60% with increases or decreases in w,
which iscomparablewiththe results obtained for the actual yeastchromosome III sequence(Fig. 3).
This test confirms that for coding and noncoding se-quencesof length larger than 500bp, theCSF algorithm is
highlyaccurate. It also illustrates anothergenericfeature of
I
-- ---I
Coding DNASequences 1.00
t07I
0 . CD CD 0.80 E 0 0 0.60 0 500 1000 1500 window sizeFIGURE 3 Dependence of sensitivityofCSFalgorithmonwindowsize, w,forcontrolsequences.Sensitivityis definedinFig.2caption.The solid
circles showthe results foraTypeIcontrolsequence,and theopencircles
show theaveraged results for three TypeIIcontrolsequences(see text).The errorbars showthe SD. Thehorizontalarrow onthe left indicatesthe
per-centageofcoding regionsintheTypeI controlsequence(66%).Westarted
ouranalysisfor window size100and increasedthe window sizeupto1200.
Forlarger window sizes, the total number of minima decreases (downto15), thus thestatisticalerrorincreases.For smallwindow sizes(-100),thesignal isverynoisy,sothat thedetectionrateis aboutthe valueexpectedfora
randomsignal, i.e., 66%. With increasing window sizes, the sensitivityof
theCSFalgorithmincreases.Themaximumsensitivityof the CSFalgorithm fordetectingcoding regions (90%)for both classesof controlsequencesis obtained with window size 800.
the CSFalgorithm, i.e., that it can, inprinciple, beapplied
to DNAsequences ofvery differentorganisms because the underlyingmechanismfordetecting codingsequencesis the
same.
Finally,wetested theCSFalgorithmon asecondtypeof
control sequences ("Type II controls") constructed as fol-lows: for the artificial chromosome sequence described
above, we replaced each coding part by an uncorrelated computer-generatedsequenceof randomlettersA, C, G,and
T. We also replaced each noncoding sequence by a computer-generated sequence of letters with "built-in" power-law long-range correlations having correlation
pa-rameteraof0.62, using themethod inPengetal.(1993).We thencalculated the percentage ofcorrectpositivesforseveral
independent realizations of sucha sequence, and we com-putedtheSE of this value. The result shows90%sensitivity
for w = 800.
Whenwe compare Fig. 3 with Fig. 2, we find that our highest sensitivityfor theartificial chromosomesequenceis 90%, whereas for the yeastchromosome III sequence, we
achieved asensitivity of 82% with optimumparameter se-lection. Itisnot surprising that the results for the artificial chromosome sequence are somewhat better: (i) we elimi-nated theproblem of the putative coding regions,and (ii)we only considered codingand noncoding regions larger than 500nucleotides.
Wenotethatthe value of the exponent ameasuredover
previously describedquantities suchasthe length distribu-tion of tandem nucleotide repeats (Uberbacher and Mural, 1991). This isnotsurprising becausethe tandem repeatsof
length more than 10 may contribute to the value ofa cal-culated for these smallfitting ranges.However, tandem re-peatsbythemselvesdonotfullyaccountforthepower-law
long-range correlation we observed. Furthermore, because power-lawlong-range correlations witha>0.5 generateatype
ofpersistence (one nucleotide is more likely to be followed
by another of thesameclass), tandem repeatsare more likely
tobe found incorrelated ratherthanuncorrelatedsequences.
DISCUSSION AND SUMMARY
Theresults ofthe CSFanalysispresentedinthisstudyareof interest for twoprimary reasons:
First, these results providethe mostcompelling evidence
todateconfirmingtheclaimthatnoncodingsequences typi-cally possess long-range power law correlations whereas codingsequencesdonot.Theinitialreport(Pengetal.,1992) describing long-range (scale-invariant) correlations only in
noncoding DNA sequences generated contradictory
re-sponses (Karlin and Brendel, 1993; Li and Kaneko, 1992;
Munson et al., 1992; Grosberg et al., 1993; Nee, 1992; Chatzidimitriou-Dreismann and Larhammar, 1993; Voss,
1992; Prabhu and Claverie, 1992). Although some reports
supported this finding(LiandKaneko, 1992;Munson etal., 1992; Grosbergetal., 1993), it has also been challengedon two fronts: (i) by those claiming that no DNA sequences possess power-law long-range correlations (Karlin and
Brendel, 1993; Nee, 1992; Chatzidimitriou-Dreismann and
Larhammar, 1993; Prabhu andClaverie, 1992), and (ii) by thoseclaiming that introns andexonsbothcontain power-law
long-range correlations (Voss, 1992). The data presented
aboveandgraphically displayed in Figs.1-3unambiguously confirm that there is a systematic correspondence between
lower values of thescalingexponent aandcoding sequences,
andbetween higher values ofa and noncoding sequences.
Furthermore, these results applyin astatistically significant
waybothtothe entireyeastchromosome III and otherlong
genomic sequences as well as to control sequences
con-structed by alternating known coding and noncoding
sequences ofvariable lengths. These findings, along with
a recent re-analysis of the patchiness of DNA sequences
(Peng et al., 1994), disprove the contention ofKarlin and Brendel (1993) that power-law long-range correlations are
simplyanartifact of theheterogeneous(mosaic)structureof DNA.Furthermore,the results of the CSFanalysiscontradict Voss' (1992)report that power-law long-range correlations
are found in bothcoding and noncoding sequences. We also note the recent study by Prabhu and Claverie
(1992) claiming that their analysis of the putative coding
regions of the yeast chromosome III produced a wide range
of exponent values, some larger than 0.5. Thus, they too
failedtofindstatistical difference,basedon thecorrelation
exponent, between coding and noncoding regions. In contrast,the CSFanalysisdoes demonstratestatistically
sig-69 Ossadniketal.
nificantagreementbetweendipsina(n)and the presence of
putativecodingregionsfor yeast chromosome III. This ap-parentdiscrepancy results fromthe fact that Prabhu and and
Claverie (1992) aswell as Karlin and Brendel (1993) and Voss(1992) didnot accountfor thepresenceoflong regions
of strandbiascodingsequences. Asrecentlyreported (Peng
et al., 1994), the detrended fluctuation analysis (DFA) method (used in the CSF algorithm) can successfully dis-tinguishtruepower-lawlong-range correlations (e.g., those in noncoding sequences) from spurious correlations due to DNA"patchiness."
The fact that the value ofaforcoding regions is closeto
thatof randomuncorrelatedsequencesmight be relevantto
thetheoryofproteinfolding and is consistent with therecent
claim of Shakhnovich and Gutin(1990) that the aminoacid sequencesofbiologically activeproteinsarealsostatistically similar to uncorrelated random sequences. In contrast, the correlated properties ofnoncoding sequences might be
re-latedto evolutionary mechanisms involving nucleotide de-letionand insertion (Buldyrevet al., 1993a, b).
Second,we show how thenewalgorithm basedonthese biologic differencesincorrelationproperties canbe usedto screenlongDNA sequences toidentify coding and
noncod-ing regions. The CSF algorithm is ableto detect relatively long coding regions withahighdegreeofreliability.Its
ad-vantages include speed, simplicity ofuse, and operator in-dependence. Furthermore, because it is based primarily on
global statisticalmeasurements,it isnotaffectedby the
par-ticularspeciesexaminedorbysequencingerrors. Its major
limitations relate to the requirement for a relatively large window(>800bp)and theinabilitytoprecisely locateintron/ exon boundaries. Given these limitations, the optimal
ap-plication of the CSFalgorithm might betorapidlyscanlarge genomic sequences, to identify any potential coding sites, andthentoapply standardcoding-sequence finding toolsto
adetailed analysis of these selectedareas. Indeed, identifi-cation ofeven asingle putativeexonwouldimplythenearby location ofa gene that can then besearched for with
con-ventional techniques.
TheCSFalgorithm isparticularly attractive because itcan
be applied to sequences fromorganisms acrossthe phylo-geneticspectrum.Furthermore,becauseitisbasedon a glo-balstatistical measurement, it is notaffectedby local
mu-tationorlabsequencingerrors. On theotherhand, its global statisticalnature, as emphasized above, limits its ability to
locateprecisely the boundaries of codingandnoncoding
re-gions. Therefore, in its present form, CSF canbe used in
concertwith otheralgorithms(see "Step6"in ourprocedure)
that apply local property measurements.
Wewish tothank C. R.Cantor, C. DeLisi, and T. M. Sanders for valuable discussions, and an anonymous referee for having sug-gested the calculations that led toFig. 1 b-d.
Partial supportwas providedtoC.-K. PengbyNational Institutes ofHealth/National Institutes of MentalHealth,toA. L.Goldberger by the G. Harold and Leila Y. Mathers Charitable Foundation,the National Heart, Lung and Blood Institute, andthe National Aero-nautics and Space Administration, toM.Simons by the American HeartAssociation, andtoS. V.Buldyrev, S. Havlin, R. N. Mantegna, S. M. Ossadnik, and H. E. Stanley by the National Science Foun-dation andOffice of Naval Research.
REFERENCES
Altschul, S. F., W.Gish,W.Miller, E. W. Myers, and D. J. Lipman. 1990. Basic localalignment search tool. J. Mol. Bio. 215:403-410. Berthelsen, C. L., J. A. Glazier, and M. H. Skolnick. 1992. Global fractal
dimension of human DNA sequences treatedaspseudorandom walks. Phys.Rev. A. 45:8902-8913.
Buldyrev, S. V., A. L.Goldberger,S.Havlin,C.-K.Peng, H. E.Stanley,
M. H. R.Stanley, and M. Simons. 1993a. Fractallandscapesand
mo-lecular evolution:modeling themyosinheavy chain gene family. Biophys. J. 65:2673-2679.
Buldyrev,S. V.,A.L.Goldberger,S.Havlin,C.-K.Peng,M.Simons,and H. E.Stanley.1993b.GeneralizedLevywalk model for DNA nucleotide sequences.Phys.Rev.E.47:4514-4523.
Chatzidimitriou-Dreismann, C.A., and D. Larhammar. 1993.Long-range correlationsin DNA. Nature. 361:212-213.
Grosberg,A.Yu., Y.Rabin,S.Havlin,and A. Nir. 1993.Self-similarityin DNAstructure.Europhys.Leu. 23:373-378.
Karlin,S., and V. Brendel. 1993. Patchiness andcorrelationsin DNA
se-quences.Science. 259:677-680.
Li, W., and K. Kaneko 1992. Long-range correlations and partial l/f'
spectrum in a noncoding DNA sequence. Europhys. Lett. 17: 655-658.
Montroll,E.W., and M. F.Shlesinger. 1984. Thewonderful world of
ran-dom walks. InNonequilibriumPhenomena II: From Stochastics To
Hy-drodynamics. J. L. Lebowitz and E. W.Montroll, editors.North-Holland,
Amsterdam. 1-121.
Munson, P. J., R. C.Taylor,and G. S.Michaels. 1992.Long range DNA correlations extendoverentire chromosome. Nature. 360:636-636. Nee, S. 1992. Uncorrelated DNA walks. Nature. 357:450-450.
Oliver,S. G.etal. 1992. ThecompleteDNAsequenceof yeastchromosome III. Nature. 357:38-46.
Peng, C.-K., S. V. Buldyrev,A. L. Goldberger,S. Havlin,F. Sciortino,
M.Simons,and H. E.Stanley. 1992.Long-rangecorrelationsin nucle-otide sequences. Nature. 356:168-170.
Peng,C.-K., S. V. Buldyrev, A. L.Goldberger,S.Havlin,M.Simons, and H. E. Stanley. 1993. Finitesize effectsonlong-range correlations: im-plications for analyzing DNA sequences. Phys. Rev. E. 47:3730-3733.
Peng,C.-K., S. V. Buldyrev, S.Havlin, M. Simons, H. E. Stanley,and A. L.Goldberger. 1994. On the mosaicorganization of DNA sequences.
Phys.Rev. E.49:1685-1689.
Prabhu,V.V., and J.-M. Claverie. 1992.Correlationsinintronless DNA. Nature. 359:782-782.
Press, W.H., B. P.Flannery, S. A. Teukolsky, and W. T. Vetterling. 1991. Numerical Recipes in C: TheArtof ScientificComputing.Cambridge
University Press,Cambridge.
Shakhnovich,E.I., and A.M.Gutin. 1990.Implicationofthermodynamics
ofprotein folding for evolution ofprimary sequences. Nature. 346: 773-775.
Uberbacher,E.C.,andR. J.Mural. 1991.Locatingprotein-coding regions
inhuman DNA sequencesbyamultiple sensor-neural network approach.
Proc.Natl.Acad. Sci. USA. 88:11261-11265.
Voss, R. 1992. Evolution oflong-rangefractalcorrelationsandl/fnoise in
DNAbase sequences.Phys.Rev.Lett. 68:3805-3808.
Watson,J.D.,M.Gilman,J.Witkowski,andM.Zoller. 1992. Recombinant DNA.Scientific AmericanBooks,NewYork.