An educational intervention to improve knowledge about prevention
against occupational asthma and allergies using targeted maximum
likelihood estimation
Daloha Rodríguez-Molina
1,2, Swaantje Barth
1, Ronald Herrera
1, Constanze Rossmann
3,
Katja Radon
1, Veronika Karnowski
41: Occupational and Environmental Epidemiology & NetTeaching Unit; Institute and Outpatient Clinic for Occupational, Social and Environmental Medicine; University Hospital of Munich (LMU); Munich, Germany. 2: Department of Medical Informatics, Biometry and Epidemiology (IBE); Ludwig-Maximilians University Munich (LMU); Munich, Germany.
3: Department of Media and Communication Science; University of Erfurt; Erfurt, Germany.
4: Department of Communication Studies and Media Research (IfKW); Ludwig-Maximilians University Munich (LMU); Munich, Germany.
Corresponding author: Katja Radon1
A
BSTRACT
Background. Occupational asthma and allergies are potentially preventable diseases affecting 5-15% of the working population. However, the use of preventive measures is often low. The aim of this study was to estimate the average treatment effect of an educational intervention designed to improve the knowledge of preventive measures against asthma and allergies in farm apprentices from Bavaria (Southern Germany). Methods. Farm apprentices at Bavarian farm schools were asked to complete a questionnaire evaluating their knowledge about preventive measures against occupational asthma and allergies (use of personal protective equipment, personal and workplace hygiene measures). Eligible apprentices were randomized by school site to either a control or an intervention group. The intervention consisted of a short educational video about use of preventive measures. Six months after the intervention, subjects were asked to complete a post-intervention questionnaire. Of the 116 apprentices (70 intervention group, 46 control group) who answered the baseline questionnaire only 47 subjects (41%; 17 intervention group, 30 control group) also completed the follow-up questionnaire. We therefore estimated the causal effect of the intervention using targeted maximum likelihood estimation. Models were controlled for potential confounders.
Results. Based on the targeted maximum likelihood estimation, the intervention would have increased the proportion of correct answers on all six preventive measures by 18.4% (95% confidence interval: 7.3% - 29.6%) had all participants received the intervention versus had they all been in the control group.
Conclusions. These findings indicate the improvement of knowledge by the educational intervention.
Keywords: occupational asthma and allergies, educational intervention, targeted maximum likelihood estimation, preventive measures, causal effect.
I
NTRODUCTION
Occupational asthma and allergies are potentially preventable diseases [1]. However, 5-15% of asthma cases in the adulthood are due to the occupation, and estimates for allergies are moving at a similar pace [2]. Occupational asthma is defined as a disease attributable to the occupational environment and not to stimuli outside the workplace, and characterized by variable airflow limitation as well as hyperresponsiveness under inflammatory conditions [3]. Similarly, occupational allergies -such as occupational rhinoconjunctivitis- are characterized by variable nasal airflow limitation and hypersecretion due to conditions of the occupational environment [4]. Respiratory causes, including asthma and allergies, are the most common occupational diseases in industrialized countries [2], and generate great costs: current estimates from the UK on direct and indirect lifetime costs per average case of occupational asthma range from £120k to £130k [5]. The development of work-related allergies or asthma not only has consequences in terms of health status, but can also make re-training necessary. Unemployment is very common due to the lack of alternatives for a job in the same area without known asthma and allergy risk [6,7].
In Bavaria (Southern Germany), at least 21,000 apprentices are trained every year in occupations with an increased risk of allergies, i.e. farmers, hairdressers, bakers and metalworkers [8], and for many of these trainees, presenting allergic symptoms means a premature end of training. About 9% of young Bavarians drop out of training [8], and approximately one-third of the young people who drop out due to health reasons suffer from skin and respiratory diseases [9]. In order to prevent these diseases, technical and organizational measures at the workplace as well as personal protective measures are recommended [10,11]. Therefore, training about occupational asthma and allergies as well as preventive measures should be included in the curricula in general education and especially vocational schools educating apprentices in high risk occupations such as farming. Therefore, the Social Security of Agriculture, Forestry and Horticulture in Bavaria (SVLFG) provides vocational schools with the required study curriculum for occupational safety and health. We have previously shown that the knowledge and acceptance of preventive measures -especially during training age- is low (see Supplemental Material, Table 4). This is probably related to a lack of interest and personal relevance. Only about a third of employees adhere to the recommended preventive measures [12]. Despite the lack of specific data in the farming context, we assume that the use of personal protective equipment (PPE) and other preventive measures between apprentices and workers is similar, and that these figures are also similar between farming and other professions.
Therefore, the aim of this study was to apply an educational intervention designed to improve the knowledge of preventive measures against asthma and allergies in farm apprentices from Bavaria (Southern Germany), and to estimate the average treatment effect of this intervention using double robust and semi-parametric methods.
M
ATERIALS
&
M
ETHODS
D
ESIGN AND
P
ARTICIPANTS
Farm apprentices on their second and third year of training from Upper Bavaria were personally invited to participate from March to April 2014 in this 6-month, two-armed, randomized controlled interventional study. All students were asked to fill out a questionnaire and a consent form. Before the beginning of the study, appointments were set for visiting the students at their place of study as part of their training. The recruitment of participants for the control and intervention groups was performed during these visits. Eligible were those apprentices who already had turned 18 years, excluding 37 apprentices who were younger at the time of recruitment. We performed cluster randomization taking into account the number of participants and the school they belonged to, in order to rule out systematic error.
During the visits, apprentices were informed about the study and completed the baseline questionnaire about their knowledge of preventive measures against asthma and allergies. For the intervention groups, and following an educational intervention known as Learning with errors[13,14], the completion of the questionnaire was followed by the first version of an educational video in which a farming student did not comply with the recommended measures to protect against asthma and allergies (see supplementary material, Video 1). After that, they were invited to identify errors in a group discussion. In the end, a second version of the video was shown in which the farming student behaved correctly (see supplementary material, Video 2). The time for the training unit was about 20 minutes. The control group did not receive any training unit. Six months after recruitment (between September and October 2014), all study participants were contacted by phone for the follow-up interview during which their knowledge about preventive measure was again assessed.
Only those who signed the informed consent with their contact data and successfully completed the baseline questionnaire were eligible for follow-up. Of 277 eligible students at baseline, 40 (14.4%) refused to participate. Of the remaining 237, 120 (50.6%) did not provide their email address (n=29), their phone number (n=72) or neither (n=19). One additional subject (0.4%) was removed due to missing information on sociodemographic variables. Of the remaining 116 apprentices, 46 belonged to the control group and 70 to the intervention group (n = 70). Of them, 47 (40.5%; 17 intervention group, 30 control group) completed the follow-up questionnaire (figure 1).
Q
UESTIONNAIRE
The baseline questionnaire included sociodemographic factors such as year of birth, schooling years, smoking behavior, occupational and private contact with animals and plants, as well as personal and parental history of asthma. Additionally, the questionnaire included a section about knowledge regarding prevention of asthma and rhinoconjunctivitis. The post-intervention survey was similar to the baseline questionnaire.
V
ARIABLE DEFINITION
Sociodemographic variables and medical history
Age was collected as a continuous variable and dichotomized in either younger than 25 years old, or older. According to the European Community Respiratory Health Survey [15] smoking was defined as either ever smoked at least 20 packages of cigarettes or 360 grams of tobacco, or having smoked at least one cigarette per day or one cigar per week for at least one year, or having smoked in the last month.
Risk perception was explored by using a 1-5 Likert scale to ask how likely would it be for the subject to present an episode of nasal allergies or asthma in the next 5 years, and how bad would it be for the subject to present an episode of nasal allergies or asthma. Answers such as “very unlikely” and “not bad at all”, respectively, were given the highest score. The scores of these two items were summed up, and a cut-off point corresponding to the 75th percentile was chosen a-priori to dichotomize the sum into apprentices with normal level of risk perception
(below 75th percentile) and low level of risk perception (≥75th percentile).
Presence of asthma or rhinoconjunctivitis was defined as either self-reported wheezing without having a cold, currently taking asthma medication or symptoms of rhinoconjunctivitis during the 12-months prior to survey.
Outcomes of interest
The main outcome variable of interest was knowledge about six potentially preventive measures against asthma and allergies, based on the subject’s response to the question ‘which of the following measures can be applied in farming to avoid getting asthma and rhinoconjunctivitis?’: washing hair after work (yes), wearing work shoes (no), keeping work clothes outside of the living environment (yes), disinfecting stables (no), wearing protective goggles (no), avoid wearing work clothes inside the living environment (yes). Correct answers are given in parenthesis. Each of these six measures was given one point if correct, and zero if not correct. The scores were summed up. Our outcome of interest was to answer all six measures correctly. Sensitivity analyses were carried out using both at least five correct answers, and at least four correct answers.
S
TATISTICAL ANALYSES
Since previous analyses already show that logistic regression models are not well suited to model the effect of the intervention on the main outcome[16] (see Supplemental Material, Table 4) we applied Targeted Maximum Likelihood Estimation methods (TMLE) along with Machine Learning (ML) techniques. Logistic regression models did not converge to provide estimates for interpretation because of the low study sample size and high proportion of missing values on the outcome (drop-outs). Preliminary analyses showed that subjects who completed the intervention were not statistically different on confounders of interest from those who did not. TMLE –also found in the literature as Targeted Minimum Loss based Estimation- is a double robust method providing an effect estimator based on the exposure, on the outcome, or on both, while also allowing to include missing values as a parameter for modeling [17,18]. TMLE is performed in two stages. In the first stage, it models the outcome Y as a function of both the exposure A (treatment group) and the covariates (W1, W2, …,
Wn). At the same time, it performs a joint modeling analysis of the missing values, and includes it in the model
as a parameter. The second stage is a bias reduction step, where TMLE iteratively updates parameter estimates by using exposure models given the covariates, i.e. modeling the treatment mechanism. Within a counterfactual framework [19,20], the effect of the exposure on the probability distribution P0 of the outcome of interest is,
ultimately, a difference in effect between the exposed and the unexposed (the target parameter), which could be measured on an additive or a multiplicative scale, e.g. relative risk (RR) or odds ratio (OR) [18]. As a consequence, the additive average treatment effect (ATE) as the true target parameter can be defined as:
!"#= !! ! ! !=1,! − ! ! !=0,!)]
where E(Y | A=a, W) is the conditional mean of the outcome given the exposure, either in the intervention (A = 1) or the control group (A = 0), and the covariates (W) [18,21]. This second step makes use of semi-parametric techniques through ML that, unlike traditional parametric methods such as linear or logistic regression, are able to reduce bias and increase efficiency [17,22-24]. One of the main advantages about using ML techniques is that we allow the data to guide the controlled estimation of the best possible set of terms or interactions to include in the final model because the function ‘learns’ from the data itself [25].
Further, we estimated the average treatment effect on the treated (ATT) and the average treatment effect on the controls (ATC) in order to have a better understanding of the effect of the exposure only among those who actually receive the intervention, or those who were randomized into the control group, respectively [25-27].
.
In other words, the ATT is the average difference on the outcome between the exposed subjects had they been exposed, and the same exposed subjects had they been unexposed [17]:
!""= ! ! ! !=1,! −! ! !=0,!)| !=1)
In contrast, the ATC is the average difference on the outcome between the control subjects had they been exposed, and the same control subjects had they been unexposed [25]:
!"#= ! ! ! !=1,! − ! ! !=0,!) | !=0)
These results were adjusted for the potential confounders sex, age, education level, smoking status, presence of asthma or rhinoconjunctivitis, risk perception, parental asthma, and knowledge about preventive measures against asthma and allergies before the intervention. All statistical analyses were performed using R Statistical Software version 3.3.0 [28]. TMLE implementation was performed using the tmle package version 1.2.0-4 [29]. ML learning implementation within TMLE was performed using the SuperLearner package version 2.0-19 [30]. Estimation of ATT and ATC was done using the tmlecte package version 0.3.1 [31].
R
ESULTS
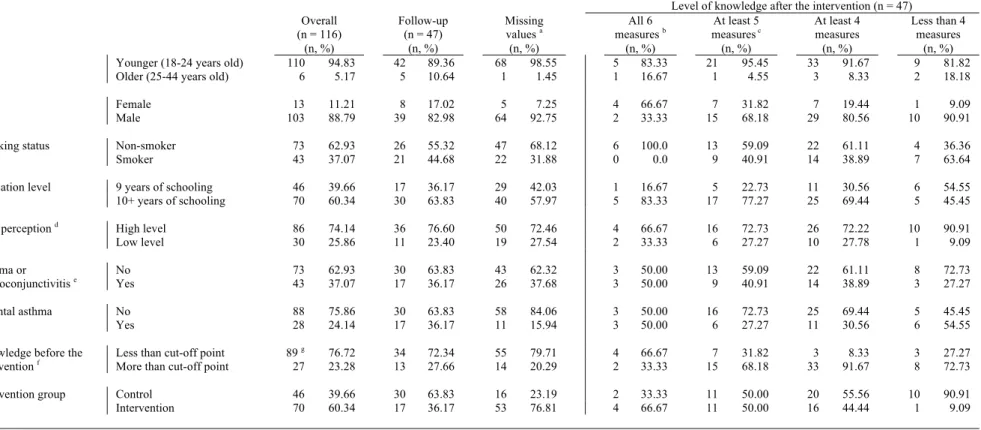
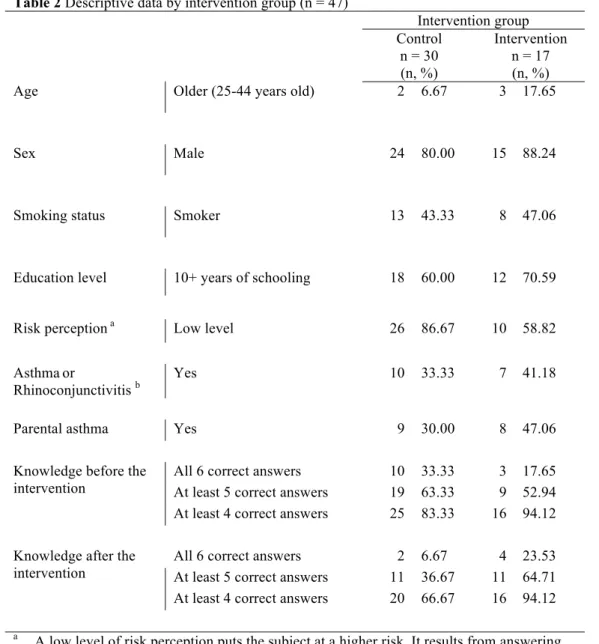
The majority of the population (n = 116) consisted of males (88.8%), 24 years old or younger (94.8%), non-smokers (62.9%), with more than 10 years of schooling (60.3%), with no personal history of asthma or rhinoconjunctivitis (62.9%) or parental history of asthma (75.9%) (Table 1). At baseline, only 23.3% correctly answered all six questions about preventive measures against asthma and allergies, and this proportion increases to 27.7% at follow-up (Table 1). On subjects who completed the intervention phase (n = 47), the proportion of correct answers in the intervention group increased from 17.7% to 23.5% for the main outcome, and from 52.9% to 64.7% for having at least five correct answers (Table 2). This proportion remained unchanged for having at least four correct answers (Table 2). There were no statistically significant differences before the intervention.
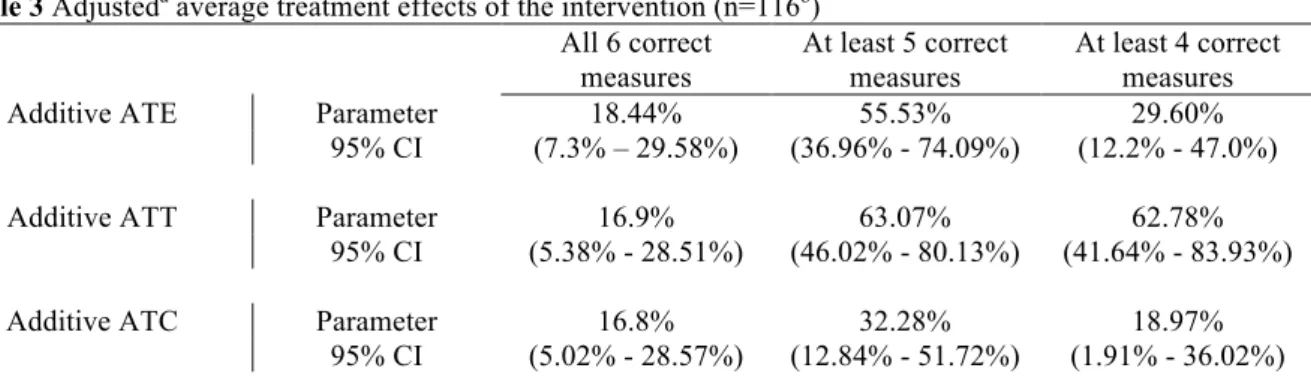
The adjusted additive ATE of the educational intervention was 18.4% (95% Confidence Interval (CI) 7.3% - 29.6%) for the main analyses. In other words, the intervention would have increased the proportion of correct answers on all six preventive measures by 18.4%, had all participants received the intervention versus had they all been in the control group (Table 3). The adjusted additive treatment effect on the treated (ATT) was 16.9%, (95% CI 5.4% - 28.5%), while on the controls (ATC) it was 16.8% (95% CI 5.0% - 28.6%).
In the sensitivity analyses, the additive ATE was the highest when the cut-off point for knowledge was at least 5 correct measures (55.5%, 95% CI 37.0% - 74.1%). The additive ATT was 63.08% (95% CI 46.02% - 80.13%), while the additive ATC was 32.28% (95% CI 12.84% - 51.72%). Furthermore, for knowledge of about 4 correct measures, ATE dropped to 29.60% (95% CI 12.2% - 47.0%), while ATT was 62.78% (95% CI 41.64% - 83.93%), and ATC was 18.97% (95% CI 1.91% - 36.02%).
D
ISCUSSION
We found that using an instructional video as educational intervention is an effective approach to improve knowledge about preventive measures against occupational asthma and allergies in Bavarian farm apprentices. Our data shows that the intervention would be able to increase the proportion of correct answers by 18% had all participants taken the intervention vs. had nobody taken it. The magnitude of the effect changed depending on the selected cut-off point for knowledge, but remained to be positive and statistically significant for all selected outcomes.
Our results are consistent with current literature on the topic. Previous studies on apprentices and practicing farmers [32-34], hairdressers [35-37] and welders [38,39] have reported that knowledge about preventive measures varies from poor to average, the use of PPE is low, and several types of interventions tend to increase the level of knowledge and compliance with preventive measures. Kim et al.[32] demonstrated in a pilot study among farmers that one educational workshop consisting of rotating stations with information on causes of work-related asthma, spirometry and use of PPE, aiming at increasing the knowledge about safety training and occupational health and safety (OHS) was feasible and effective, while Levesque et al.[33] showed that farmers who received traditional pesticide safety training were more likely to use PPE; however, their confidence intervals were wide due to low number of participants. Meanwhile, Pounds et al.[34] implemented a different kind of intervention: a social media campaign promoting the use of respiratory protection devices (RPD) among farmers, and results showed that communication via e-mail increased knowledge about RPD, as well as intention to use these devices in dusty conditions.
Our study has several strengths. Our educational intervention is easy to apply and to measure. Moreover, all relevant information about correct and incorrect practices are embedded in the videos, and students have the opportunity to discuss these practices and learn from mistakes made by a third party and not themselves[13,14]. A consequence of this dynamic is that the instructor does not need to possess any relevant information about the topic. We would recommend, however, elaborating an info sheet for the instructor, as extra material on how to lead the session. Furthermore, by using a double-robust method such as TMLE, we were able estimate the parameter of interest in presence of small sample size and with a high proportion of missing values on the outcome. The combination of TMLE and ML (SuperLearner) as semi-parametric techniques allowed us to have more flexibility and to reduce common modeling errors due to incorrect parametric assumptions [40], therefore reducing bias and increasing efficiency [17,41,42]. Simulation studies have shown that TMLE has many
advantages over other methods such as the G-computation formula, inverse probability of treatment weighting (IPTW) or propensity score matching (PS) [40,43], namely that these other methods are inconsistent if the initial regression estimator is inconsistent (while TMLE remains consistent), and that TMLE still performs relatively well even if there are violations to the experimental treatment assignment (ETA) assumption. A practical ETA violation occurs when the conditional probability of receiving treatment is below some small ε, typically ranging between (0.1 and 0.01), depending on the number of observations [42]. Unlike traditional regression methods (e.g. logistic regression), TMLE is able to provide a measure of effect on the additive scale, which makes interpretation easier. Finally, our study is unique on its kind, and provides data and analyses on a population of young Bavarian farmers, thus filling a prior gap of knowledge on this specific subpopulation. Nevertheless, our study also has limitations. We analyzed only knowledge as main outcome, but it would be also interesting to measure and analyze behavioral change before and after the intervention. The cut-off point for the main outcome (all six correct measures) was chosen arbitrarily and might have been too strict. Nevertheless, we decided to use this cut-off point in order to be conservative and we performed sensitivity analyses taking into account less strict cut-off points, which confirmed the same results. Further, we modeled our outcome as binary instead of ordinal. Several methods have been proposed for randomized clinical trials with ordinal outcomes, which could increase the relative efficiency of the estimator [44]. Hence, the results of our study could be further improved by applying these methods. The main challenge was the huge number of losses to follow up we faced, which did not permit to use e.g., logistic regression models (see Supplemental Material, Table 4). We have overcome this limitation by using TMLE to model these missing values simultaneously with estimators for both the exposure and the outcome. Thus, we were able to obtain interpretable results that allow us to answer our research question.
A popular criticism done to the counterfactual model is the possibility of individual treatment effects, which may introduce treatment-effect heterogeneity bias [45-49]. This type of bias is less common in randomized controlled trials because several assumptions are met: no interference among subjects, one unique version of the treatment, a non-zero probability of treatment assignment for each subject, and independence between treatment level and potential outcomes given observed covariates [48,50]. When treatment effects are homogeneous for all subjects, the values for the ATE, ATT and ATC are identical [45,46]. Our results show that the ATE, ATT and ATC on the main outcome are fairly similar. Hence, the presence of treatment-effect heterogeneity bias is unlikely. Additionally, all causal frameworks might still be susceptible to unmeasured confounding, especially
in observational studies [51,52]. In our study, however, we have made sure to measure and include all possible covariates that might be related to both our exposure and outcome. This approach, along with our study design and randomization strategy, provides us with an adequate amount of confidence to make statements about the results of our data.
It is also important to take into account a possible community effect that may ‘contaminate’ the effect of the intervention between those treated and those untreated [53]. After all, young apprentices take courses and perform daily activities together. However, we reduced the possibility for interaction between treated and untreated subjects when we performed clustered randomization. In other words, all participants of one study center were randomized either to receive the intervention or to be in the control group, thus decreasing the possibility of disturbing the effect on the outcome. Moreover, apprentices in this population tend to meet only occasionally if they have lectures, while the rest of the time they are working on the farms, so they do not see each other as frequently as trainees in other areas. This study was performed in a very well characterized population of young Bavarian farm apprentices. Extrapolation of results to other populations must be done cautiously, since risk perception, work practices, and other variables may vary according to strong local cultural patterns [54].
Even though we have obtained positive and significant results with our intervention, we believe we are still short in closing the breach of knowledge about preventive measures against asthma and allergies in the workplace. A valid point for discussion is whether or not an 18% increase in the proportion of correct answers is sufficient. Taking into account that 23% of our population had a full score on all six preventive measures at baseline (Table 1), and that our intervention would increase this proportion by 18%, we are still left with more than 50% of apprentices with inadequate knowledge on prevention. Further, it is still unclear if an increase in knowledge would effectively relate to an increase in the correct use of preventive measures.
In summary, our findings suggest that our educational intervention improves the knowledge about preventive measures against asthma and allergies in about 20% of young Bavarian farm apprentices, and that TMLE is an efficient double-robust and semi-parametric method able to provide causal effect estimates where traditional regression methods cannot.
D
ISCLAIMER
A
UTHORS
’
CONTRIBUTIONS
Study conception and design: KR, CR, SB, VK; Fieldwork and data collection: SB; Data analysis: DRM, RH; Interpretation of the data: DRM, KR, RH; Drafting of the manuscript: DRM, KR. All authors read and approved the final manuscript.
F
UNDING
This study was funded by Gesund.Leben.Bayern. http://www.gesundheit.bayern.de
C
ONFLICT OF
I
NTEREST
The authors declare that they have no conflict of interest.
E
THICAL APPROVAL
This study was approved by the Ethics Committee of the University of Munich (LMU) (Project-No. 6-14). All procedures performed in studies involving human participants were in accordance with the ethical standards of the institutional and/or national research committee and with the 1964 Helsinki declaration and its later amendments or comparable ethical standards.
A
CKNOWLEDGEMENTS
Special thanks to Jenny Schlichtiger for her valuable collaboration and hard work in the data collection process, and to Iven-Alex Heim for acting in the educational videos. The authors would also like to thank all farm apprentices who kindly participated in our study. Furthermore, we would like to thank Thomas Brendel and Thomas Bischoff from the Instituf für Didaktik und Ausbildungsforschung in der Medizin (LMU) for their help in creating the educational video.
Table 1 Descriptive data of subjects, and level of knowledge after the intervention
Level of knowledge after the intervention (n = 47) Overall (n = 116) (n, %) Follow-up (n = 47) (n, %) Missing values a (n, %) All 6 measures b (n, %) At least 5 measures c (n, %) At least 4 measures (n, %) Less than 4 measures (n, %) Age Younger (18-24 years old) 110 94.83 42 89.36 68 98.55 5 83.33 21 95.45 33 91.67 9 81.82
Older (25-44 years old) 6 5.17 5 10.64 1 1.45 1 16.67 1 4.55 3 8.33 2 18.18 Sex Female 13 11.21 8 17.02 5 7.25 4 66.67 7 31.82 7 19.44 1 9.09 Male 103 88.79 39 82.98 64 92.75 2 33.33 15 68.18 29 80.56 10 90.91 Smoking status Non-smoker 73 62.93 26 55.32 47 68.12 6 100.0 13 59.09 22 61.11 4 36.36 Smoker 43 37.07 21 44.68 22 31.88 0 0.0 9 40.91 14 38.89 7 63.64 Education level 9 years of schooling 46 39.66 17 36.17 29 42.03 1 16.67 5 22.73 11 30.56 6 54.55 10+ years of schooling 70 60.34 30 63.83 40 57.97 5 83.33 17 77.27 25 69.44 5 45.45 Risk perception d High level 86 74.14 36 76.60 50 72.46 4 66.67 16 72.73 26 72.22 10 90.91 Low level 30 25.86 11 23.40 19 27.54 2 33.33 6 27.27 10 27.78 1 9.09 Asthma or
Rhinoconjunctivitis e Yes No 43 73 62.93 37.07 30 17 63.83 36.17 43 26 62.32 37.68 3 3 50.00 50.00 13 9 40.91 59.09 14 22 38.89 61.11 3 8 72.73 27.27 Parental asthma No 88 75.86 30 63.83 58 84.06 3 50.00 16 72.73 25 69.44 5 45.45 Yes 28 24.14 17 36.17 11 15.94 3 50.00 6 27.27 11 30.56 6 54.55 Knowledge before the
intervention f Less than cut-off point 89
g 76.72 34 72.34 55 79.71 4 66.67 7 31.82 3 8.33 3 27.27 More than cut-off point 27 23.28 13 27.66 14 20.29 2 33.33 15 68.18 33 91.67 8 72.73 Intervention group Control 46 39.66 30 63.83 16 23.19 2 33.33 11 50.00 20 55.56 10 90.91 Intervention 70 60.34 17 36.17 53 76.81 4 66.67 11 50.00 16 44.44 1 9.09 a Missing values of the outcome
b Includes 4 and 5 correct c Includes 4 correct
d A low level of risk perception puts the subject at a higher risk. It results from answering the questions ”how likely would you think it is to present an episode of nasal allergies or asthma in the next five years” and “how bad do you think it would be to present an episode of nasal allergies or asthma?” For details on how this variable was constructed, see text
e Defined as the 12-months prevalence of either self-reported wheezing without a cold, currently taking medication for asthma or rhinoconjunctivitis
f Each outcome was compared against the same outcome at baseline: all six correct measures at baseline vs. all six correct measures at follow-up, at least 5 correct measures at baseline vs. at least 5 correct measures at follow-up, at least 4 correct measures at baseline vs. at least 4 correct measures at follow-up
Table 2 Descriptive data by intervention group (n = 47) Intervention group Control n = 30 (n, %) Intervention n = 17 (n, %) Age Older (25-44 years old) 2 6.67 3 17.65
Sex Male 24 80.00 15 88.24
Smoking status Smoker 13 43.33 8 47.06
Education level 10+ years of schooling 18 60.00 12 70.59
Risk perception a Low level 26 86.67 10 58.82
Asthmaor
Rhinoconjunctivitis b
Yes 10 33.33 7 41.18
Parental asthma Yes 9 30.00 8 47.06
Knowledge before the intervention
All 6 correct answers 10 33.33 3 17.65 At least 5 correct answers 19 63.33 9 52.94 At least 4 correct answers 25 83.33 16 94.12
Knowledge after the intervention
All 6 correct answers 2 6.67 4 23.53 At least 5 correct answers 11 36.67 11 64.71 At least 4 correct answers 20 66.67 16 94.12 a A low level of risk perception puts the subject at a higher risk. It results from answering
the questions ”how likely would you think it is to present an episode of nasal allergies or asthma in the next five years” and “how bad do you think it would be to present an episode of nasal allergies or asthma?” For details on how this variable was constructed, see text
b Defined as the 12-months prevalence of either self-reported wheezing without a cold, currently taking medication for asthma or rhinoconjunctivitis
Table 3 Adjusteda average treatment effects of the intervention (n=116b) All 6 correct measures At least 5 correct measures At least 4 correct measures Additive ATE Parameter 18.44% 55.53% 29.60%
95% CI (7.3% – 29.58%) (36.96% - 74.09%) (12.2% - 47.0%) Additive ATT Parameter 16.9% 63.07% 62.78%
95% CI (5.38% - 28.51%) (46.02% - 80.13%) (41.64% - 83.93%) Additive ATC Parameter 16.8% 32.28% 18.97%
95% CI (5.02% - 28.57%) (12.84% - 51.72%) (1.91% - 36.02%) Abbreviations: ATE = Average treatment effect; ATT = Average treatment effect on the treated; CI =
Confidence Interval; ATC = Average treatment effect on the controls; TMLE = targeted maximum likelihood estimation.
a Adjusted for sex, age, education level, smoking status, presence of asthma or rhinoconjunctivitis, risk perception, parental asthma, and knowledge about preventive measures against asthma and allergies before the intervention
b The adjusted model using TMLE allowed including both observed data (n = 47) and missing values (n = 69) as parameters
R
EFERENCES
1. Tarlo SM, Lemiere C. Occupational asthma. N Engl J Med. 2014;370(7):640–649.
2. Peden D, Reed CE. Environmental and occupational allergies. J allergy Clin Immunol. 2010;125(2 Suppl 2):S150–60.
3. Baur X, Sigsgaard T, Aasen TB, Burge PS, Heederik D, Henneberger P, et al. Guidelines for the management of work-related asthma. Eur. Respir. J. 2012;39(3):529–545.
4. Ameille J, Hamelin K, Andujar P, Bensefa-Colas L, Bonneterre V, Dupas D, et al. Occupational asthma and occupational rhinitis: the united airways disease model revisited. Occup Environ Med.
2013;70(7):471–475.
5. Ayres JG, Boyd R, Cowie H, Hurley JF. Costs of occupational asthma in the UK. Thorax. 2011;66(2):128–133.
6. Mahmud N, Schonstein E, Schaafsma F, Lehtola M, Fassier J, Reneman M, et al. Pre-employment examinations for preventing occupational injury and disease in workers. The Cochrane Database of Systematic Reviews. 2010.
7. Vandenplas O, Dressel H, Wilken D, Jamart J, Heederik D, Maestrelli P, et al. Management of occupational asthma: cessation or reduction of exposure? A systematic review of available evidence. Eur. Respir. J. 2011;38(4):804–811.
8. Patuzzi M. Ausbildungsreport 2012 Bayern. Bayern DJ, editor. München; 2012;1–40.
9. Thomas M, Bahemann A, Voss H, Borsch-Galetke E. Gesundheitlich begründete Ausbildungsabbrüche. Arbeitsmedizin Sozialmedizin Umweltmedizin. 2005;(40):182.
10. Moscato G, Pala G, Boillat M, Folletti I, Gerth van Wijk R, Olgiati-Des Gouttes D, et al. EAACI Position Paper: Prevention of work-related respiratory allergies among pre-apprentices or apprentices and young workers. Allergy. 2011;66(9):1164–1173.
11. Tarlo S, Liss G. Prevention of occupational asthma—practical implications for occupational physicians. Occ. Med. 2005;55(8):588–594.
12. Kütting B, Weistenhöfer W, Baumeister T, Uter W, Drexler H. Current acceptance and implementation of preventive strategies for occupational hand eczema in 1355 metalworkers in Germany. Br. J. Dermatol. 2009;161(2):390–396.
13. Seifried J, Baumgartner A. Lernen aus Fehlern in der betrieblichen Ausbildung-Problemfeld und möglicher Forschungszugang. bwp@ Berufs-und Wirtschaftspädagogik online. 2009;17. 14. Hainich R. Fehlerkultur in der Ausbildung auf der Intensivstation. Intensiv. 2010;18(2):62–69.
15. Burney PG, Luczynska C, Chinn S, Jarvis D. The European Community Respiratory Health Survey. Eur. Respir. J. 1994;7(5):954–960.
16. Petersen ML, Porter KE, Gruber S, Wang Y, van der Laan MJ. Diagnosing and responding to violations in the positivity assumption. Stat Methods Med Res. 2012;21(1):31–54.
17. Colson KE, Rudolph KE, Zimmerman SC, Goin DE, Stuart EA, van der Laan M, et al. Optimizing matching and analysis combinations for estimating causal effects. Sci Rep. 2016;1–11.
18. van der Laan M, Rose S. Targeted Learning. 1st ed. New York City: Springer; 2011. p. 626. 19. Rubin D. Estimating causal effects of treatments in randomized and nonrandomized studies. J. Educ.
Psychol. 1974;66(5):688.
20. Rubin D. Bayesian inference for causal effects: The role of randomization. Ann. Stat. 1978;1:34–58.
21. Gruber S, van der Laan MJ. A Targeted Maximum Likelihood Estimator of a Causal Effect on a Bounded Continuous Outcome. Int. J. Biostat. 2010;6(1).
22. van der Laan MJ, Polley EC, Hubbard AE. Super learner. Stat Appl Genet Mol Biol. 2007;6:Article25. 23. Lee BK, Lessler J, Stuart EA. Improving propensity score weighting using machine learning. Statist.
Med. 2010;29(3):337–346.
24. Pirracchio R, Petersen ML, van der Laan M. Improving propensity score estimators' robustness to model misspecification using super learner. Am J Epidemiol. 2015;181(2):108–119.
Application to Anti-recidivism Policies in Colombia. Polit Anal. 2016;24(4):434–456.
26. Lendle SD, Subbaraman MS, van der Laan MJ. Identification and Efficient Estimation of the Natural Direct Effect among the Untreated. Biom. 2013;69(2):310–317.
27. Lendle SD. Targeted Minimum Loss Based Estimation: Applications and Extensions in Causal Inference and Big Data [Internet]. [Berkeley]: University of California, Berkeley; 2015. p. 1–77. Available from: http://escholarship.org/uc/item/4cs716rc
28. Team RC. R: A Language and Environment for Statistical Computing [Internet]. Vienna, Austria: R Foundation for Statistical Computing; 2016. p. 1–3501. Available from: https://www.R-project.org/
29. Gruber S, van der Laan M. tmle: An R package for targeted maximum likelihood estimation. 2011. 30. Polley E, LeDell E, van der Laan M. SuperLearner: Super Learner Prediction [Internet]. 2016. p. 1–32.
Available from: https://CRAN.R-project.org/package=SuperLearner
31. Lendle S. tmlecte: Estimates the NDE and ATT with TMLE [Internet]. 2015. p. 1–1. Available from: https://github.com/lendle/tmlecte
32. Kim J, Arrandale VH, Kudla I, Mardell K, Lougheed D, Holness DL. Educational intervention among farmers in a community health care setting. Occ. Med. 2012;62(6):458–461.
33. Levesque DL, Arif AA, Shen J. Effectiveness of Pesticide Safety Training and Knowledge About Pesticide Exposure Among Hispanic Farmworkers. J. Occup. Env. Med. 2012;54(12):1550–1556. 34. Pounds L, Duysen E, Romberger D, Cramer ME, Wendl M, Rautiainen R. Social marketing campaign
promoting the use of respiratory protection devices among farmers. J Agromedicine. 2014;19(3):316– 324.
35. Crippa M, Torri D, Fogliata L, Belleri L. [Implementation of a health education programme in a sample of hairdressing trainees]. La Medicina del lavoro. 2006;(1):48–54.
36. Ling TC, Coulson IH. What do trainee hairdressers know about hand dermatitis? Contact Derm. 2002;47(4):227–231.
37. Nixon R, Roberts H, Frowen K, Sim M. Knowledge of skin hazards and the use of gloves by Australian hairdressing students and practising hairdressers. Contact Derm. 2006;54(2):112–116.
38. Bonow CA, Cezar-Vaz MR, Almeida MCV de, Rocha LP, Borges AM, Piexak DR, et al. Risk
Perception and Risk Communication for Training Women Apprentice Welders: A Challenge for Public Health Nursing. Nurs. Res. Pract. 2013;2013(1):1–11.
39. Cezar-Vaz M, Bonow C, Vaz J. Risk Communication Concerning Welding Fumes for the Primary Preventive Care of Welding Apprentices in Southern Brazil. IJERPH. 2015;12(1):986–1002.
40. Schnitzer M, van der Laan M, Moodle E, Platt R. Effect of breastfeeding on gastrointestinal infection in infants: a targeted maximum likelihood approach for clustered longitudinal data. Ann. Appl. Stat. 2014;8(2):703–725.
41. Ahern J, Karasek D, Luedtke AR, Bruckner TA, van der Laan MJ. Racial/Ethnic Differences in the Role of Childhood Adversities for Mental Disorders Among a Nationally Representative Sample of
Adolescents. Epidemiology. 2016;27(5).
42. Lendle SD, Fireman B, van der Laan MJ. Targeted maximum likelihood estimation in safety analysis. J. Clin. Epidemiol. 2013;66(8):S91–S98.
43. van der Laan MJ, Gruber S. Targeted Minimum Loss Based Estimation of Causal Effects of Multiple Time Point Interventions. Int. J. Biostat. 2012;8(1).
44. Díaz I, Colantuoni E, Rosenblum M. Enhanced precision in the analysis of randomized trials with ordinal outcomes. Biom. 2016;72(2):422–431.
45. Breen R, Choi S, Holm A. Heterogeneous Causal Effects and Sample Selection Bias. SocScience. 2015;2:351–369.
46. Xie Y, Brand JE, Jann B. Estimating Heterogeneous Treatment Effects with Observational Data. Sociol Methodol. 2012;42(1):314–347.
47. Grimmer J, Messing S, Westwood S. Estimating heterogeneous treatment effects and the effects of heterogeneous treatments with ensemble methods. Stanford, CA: Unpublished manuscript, Stanford
University; 2014.
48. Imai K, Ratkovic M. Estimating treatment effect heterogeneity in randomized program evaluation. Ann. Appl. Stat. 2013;7(1):443–470.
49. Angrist JD. Treatment Effect Heterogeneity in Theory and Practice. Econ J. 2004;114:C52-C83.
50. Rosenbaum P, Rubin D. The central role of the propensity score in observational studies for causal effects. Biometrika. 1983.
51. VanderWeele TJ, Arah OA. Bias Formulas for Sensitivity Analysis of Unmeasured Confounding for General Outcomes, Treatments, and Confounders. Epidemiology. 2011;22(1):42–52.
52. Fewell Z, Davey Smith G, Sterne JAC. The Impact of Residual and Unmeasured Confounding in Epidemiologic Studies: A Simulation Study. Am J Epidemiol. 2007;166(6):646–655.
53. Fischer K, White I. Causal inference in clinical trials. Causality: Statistical perspectives and applications. First edition. John Wiley & Sons; 2012.
54. Peres F, Rodrigues KM, da Silva Peixoto Belo MS, Moreira JC, Claudio L. Design of risk communication strategies based on risk perception among farmers exposed to pesticides in Rio de Janeiro State, Brazil. Am. J. Ind. Med. 2013;56(1):77–89.