Open Source Development in a
Differentiated Duopoly
St´ephane Verani
∗School of Economics and Commerce
The University of Western Australia
February, 2006
Abstract
Open source software is released under an open source license giv-ing individuals the right to use, modify, and redistribute freely the programs. This paper proposes a model of differentiated duopoly in which firms invest in the development of proprietary or open source software. The main findings are: (i) firms invest more when the prod-ucts are substitutes; (ii) for substitute prodprod-ucts, firms’ investment in software development is greatest when the software is open source; (iii) for close to perfect complements, firms’ investment in software development is greatest when the software is proprietary; and (iv) for substitute products, investment in open source software yields higher profits than investment in proprietary software.
Keywords: Open Source Software, Differentiated Duopoly, Two-Stage Game, Bertrand Competition.
JEL codes: C72, D21, D43, L11, L13.
∗This research greatly benefited from early talks with Felix Chan, Vitaly Pershin,
and MoonJoong Tcha. I would like to aknowledge the constructive comments of Ken-neth Clements, Timothy Kam, James Fogarty, David Butler, and Darrell Turkington. This research was partially supported by the C.A. Vargovic Bursary and the Honours Research Paper Scholarship from the School of Economics at the University of WA. [email protected]. Tel.: + 08-6488-2896; fax: + 08-6488-1016.
1
Introduction
Open source software is typically developed by volunteers from around the globe and has attracted considerable interests in recent years. Typing “open source” in Google yields more than 640 million hits; almost three times as many as the old favourite “sex.” In its first article on the topic, The Econo-mist (1999a) concluded the following about firms’ investment in open source software:
It is too early to say whether such approaches will work. But open-source is here to stay.
Exactly six years later, The Economist (2005)’s opening sentences in a recent article on the topic were:
The computing industry has been transformed by open-source software, threatening business models while creating lucrative op-portunities for some firms. Might the same happen in biotech-nology?
Clearly, much has happened in a short period if time, and this was largely unexpected.
So what exactly is open source? While it now refers to a mode of infor-mation production (Benkler (2002)), the term open source originated with a particular type of software development. Open source software are programs released under an open source licence. An open source license gives individ-uals the right to use, modify, and redistribute freely open source software. A necessary condition to exercise these rights is free access to the program’s source code. The source code is the human readable set of instructions that makes up a program – e.g., programs written in C, C++, or Java. This is in contrast to the object code, which is the translation of the source code into the computer-readable language, a series of 0’s and 1’s – the binaries, or the executable file. Consequently, open source software implies that anyone can study the source code of a program and contribute to its development. Free access to the source code implies making a profit from the direct sale of the program is difficult since at all time the source code must be included, and can be freely redistributed. In general, open source software are developed by loosely organised teams of volunteers scattered around the planet and
connected via the Internet.1
Why has open source software attracted so much attention? Lerner and Tirole (2002) give three reasons:
1. the rapid diffusion of open software;
2. the significant capital investments in open source projects; and 3. the new organisational structure underpinning open source projects.
Several open source software dominate their market. One of the most talked about open source software is the web-server Apache whose market share has further increased to approximately 70 percent in May 2005.2 This
implies more than two thirds of the Internet rely on Apache. Other examples include: Sendmail that processes almost all e-mails sent over the Internet; GNU/Linux, the operating system argued to be Microsoft Windows’ most fierce competitor; and Wikipedia, the free high-quality encyclopedia started in 2001 and written collaboratively by many of its readers.3
Furthermore, the growth in the number of open source projects is as-tonishing. Sourceforge.net is the major incubator of open source software.4
According to Lerner and Tirole (2005), the number of projects hosted by Sourceforge.net was around 40,000 in early 2002. By May 2005, the number of projects had more than doubled and exceeded 100,000.5
Firms are increasingly using and supporting open source software. In recent years, Fortune 500 companies have initiated programs to implement open source programs in their organisation. Large IT corporations including Hewlett-Packard, Sun, IBM, Apple, and AOL have invested large sums of
1
More information on the history and development of open source software can be found in DiBona et al. (1999), Wayner (2000), Raymond (2001), Lerner and Tirole (2002), and Fink (2003).
2
http://news.netcraft.com/ (Accessed 16 May 2005). Netcraft’s survey queries server across the Internet. The results of the May 2005 survey that queried more than 63 million sites revealed Apache’s market share was 69.37 percent compared to 20.54 percent for Microsoft.
3
Wikipedia counts more than half a million articles for its English version only. For more information on Wikipedia, visit http://en.wikipedia.org/ (Accessed 16 May 2005).
4For more information on Sourceforge.net, see http://sourceforge.net/index.php
(Ac-cessed 12 December 2004) and Lerner and Tirole (2005).
5As of May 2005, there were 100,054 registered projects and 1,072,901 registered users
money in the development of open source software, and directly and indi-rectly support the development of popular projects.6 Other companies like
Red Hat and VA Linux have attracted the attention of the media by being the first distributors of open source software to float their company on the stock exchange (The Economist, 1999b). In addition to corporations, many gov-ernments around the world are turning to open source to avoid being tied to a proprietary standard, and to reduce expenditure while increasing security. Some of the pro-open source governments have instigated the development of critical open source software. Prominent examples are the joint effort of China, South Korea, and Japan regarding the development of a native Asian version of the GNU/Linux operating system, and the support of the German government for the development of GPG, a critical cryptographic software.
The success of open source software suggests a new mode of production which challenges traditional business models. Analysts have started investi-gating whether the open source model could be applied to areas other than software, including medical research, biotechnology, education, and academic research. Open source software raise four broad questions: (i) Why do top developers contribute their skilled labour for free? (ii) What characteristics make open source communities sustainable and evolve over time? (iii) How do proprietary software firms compete with open source communities? (iv) What determines firms’ investment in developments that benefits their direct competitors? This paper contributes some answers to (iv) above. More for-mally, we provide some answers on the following question: Why do for-profit firms invest in open source software?
The economic literature on open source software has largely concentrated on the motivation of open source developers (Dempsey et al., 1999; Lerner and Tirole, 2002; Benkler, 2002; Johnson, 2002; Ghosh et al., 2002; Hann et al., 2002; Lakhani and von Hippel, 2003; Hertel et al., 2003; Rossi, 2004). The results of a few years of intensive research show that what appeared first as a puzzle to economists could be largely explained by standard eco-nomic theory. However, an extensive literature search failed to reveal any paper published in a refereed journal that analysed the effect of the devel-opment regime – proprietary or open source – on firms’ investment decision in software development. The major contribution of this paper to the eco-nomics of open source software is to derive the relationship between market
6Lerner and Tirole (2004) report IBM has spent over USD 1 billion on open source
structure, development regime and investment in software development. The main findings of the paper are:
1. firms invest more in the development of their software when the prod-ucts are substitutes;
2. in the case the products are substitutes, firms’ investment in software development is greatest when the software is open source;
3. in the case the products are close to perfect complements, firms’ in-vestment in software development is greatest when the software is pro-prietary; and
4. in the case the products are substitutes, investment in open source software yields higher profits than investment in proprietary software. Consequently, our results yield sharp predictions regarding observable conditions that make the wide spread adoption of open source software more likely. Take for example the case of the numerous commercial distributions of the GNU/Linux operating system. Linux distributors, some of which are listed on the stock exchange, sell close to perfect substitute products (includ-ing the GNU/Linux operat(includ-ing system and services), and contribute actively to the development of the Linux kernel and its related applications, which are common to all. After several years of operations, none of the commercial distributors went bankrupt, the development of the GNU/Linux operating system increased dramatically, and the quality of GNU/Linux made it the fiercest competitor to the quasi-monopolist proprietary Microsoft Windows. Such examples are well captured by our model.
The remainder of this paper is organised as follows. Section 2 discusses the different types of open source license and their impications for developers. Section 3 reviews the relevant literature. Section 4 presents the assumptions of the model. Section 5 analyses the solutions. Section 6 and Section 7 investigate the effect of market structure and development regime on software development. Section 8 discusses the results using a numerical example, and Section 9 concludes.
2
Open Source licenses and Business Models
Open source has become a relatively broad definition encompassing a great variety of open source licences allowing individuals and for-profit firms to
interact in different ways.7
2.1
Open Source Licenses
Open Source licenses can be segregated in two broad category: Copyleft and
BSD-type.8
The first version of the General Public License (GPL) embodied reci-procity. Reciprocity requires all modifications and extensions to a program to be released and distributed under the same license; a requirement code-named copyleft.9 Under copyleft, the developer of an original OSS benefits
from the modifications or extensions made by a third party to the original software in the same way the third party, making the modifications, initially benefited from the original software. Mixing proprietary and copylefted code is not possible as the license requires the proprietary portion of the code to become open source. This prevents for-profit firmsappropriating and exploit-ing open source developments and innovations in their proprietary products (Lerner and Tirole, 2005). Nevertheless, the GPL does not forbid the use of OSS together with proprietary software.
Coexisting with copyleft licences are BSD-type licences which do not en-force reciprocity. Under BSD-type licences, modifications to an open source code need not be licensed under an open source license, and a third party is not only allowed to keep private the new developments made on the code, but can release the whole modified program under a proprietary license. As there is in principle no risk ofcontaminating proprietary code (as it is the case with copylefted code), BSD-type licences are very popular among for-profit firms and organisations.10
2.2
Business Models
While making money from the direct sale of OSS is rather difficult, there are many examples of companies such as Red Hat, Apple Computers, Netscape,
7
See Lerner and Tirole (2005) for an investigation of the determinants of open source license choice by individuals and firms.
8
See Fink (2003, Chap. 3) for a comprehensive and practical discussion of the most popular open source licences.
9
The term copyleft was chosen as a wordplay on copyright; see
http://www.gnu.org/copyleft/ (Accessed 18 January 2005).
and O’Reilly Associates successful making profits using OSS. There are presently four business models using OSS, called indirect sale-value models by Ray-mond (2000): Support sellers, loss-leaders, widget frosting, and accessoris-ing.
2.2.1 Support Sellers
Support sellers generate revenue from the sale of services which complement existing OSS. Typical examples of support sellers include commercial Linux distributors such as Red Hat, Novell/Suse, Mandrake, and Red Flag.11
Com-mercial distributors typically make revenue through the sale of substantially differentiated and specialised services – e.g., bundled updates, specialised and customised consultancy services, and after-sale customer service – com-plementary to the free Linux distribution.
Every commercial distributor benefit from improvements made on the Linux kernel (the core of the GNU/Linux operating system), and thus have an incentive to commit resources to its development. However, we expect firm’s decision invest in the development of the kernel to be hindered by the presence of strong spillovers due to the copyleft license and the fact Linux distributions are gross substitutes. As a result, we expect commercial distrib-utors to allocate more resources to the development of the complementary applications and services that do not benefit competitors.
2.2.2 Loss-Leader or Market Positioner
A firm selling complementary software may strategically choose to release one of its software under an open source license to become the loss-leader keeping the other programs proprietary. While it means foregoing direct revenue from the sale of the newly open program, the firm benefits from increased profit induced by the increased sales of its complementary proprietary programs. Opening a proprietary code is an attractive strategy if the software is lagging behind a leader, and may have to be discontinued in the near future (Lerner and Tirole, 2004).
Netscape is an example of a firm successful implementing this strategy. In the late 1990s, at the time Microsoft started bundling Internet Explorer with Microsoft Windows, revenues from the sale of Netscape’s Internet browser,
11
As of January 2005, there are 339 Linux distributions recorded on
Navigator, were low and dropping rapidly (Raymond, 2000).12 This meant
the cost of opening the browser was low; yet, if the browser remained in the market, the possibility of making profit from the sale of complementary products such as Netscape Enterprise Server increased. In addition, it made the ascension of Internet Explorer as a monopoly impossible, and reassured current users the software would not disappear (Raymond (2000) and Lerner and Tirole (2004)).
The Mozilla Foundation was created to guarantee the consistent devel-opment of Mozilla, the open source version of Navigator, and its derivatives Firefox (an Internet browser) and Thunderbird (an e-mail client). As of Jan-uary 2005, Firefox alone has 18 million users, and an increasing adoption rate, and became a serious threat to Microsoft’s Internet Explorer.13
2.2.3 Widget Frosting
Widget frosting is generally used by hardware manufacturers for whom the software component of their product is largely a cost, and most of the firms’ profit is contributed by the sale of hardware.
A prominent example is Apple Computers who, in 1999, decided to make the kernel of its new operating system (OS), Mac OS X, open source.14
Ap-ple’s OS blends an open source kernel with other proprietary technologies and software that make up the complete OS, and run exclusivley on Ap-ple’s computers. The result was a substantial reduction development costs without decreasing users’ willingness to pay for the computer.
Another example of widget frosting is the pervasive adoption of Linux in embedded applications such as smart phones. Smart phones are third-generation (3G) mobile phones that rely on operating systems similar to the one used on PCs. Motorola was the first manufacturer to implement Linux on one of its smart phones in 2003 while retaining proprietary systems – such as Microsoft’s Windows Mobile OS, and Symbian OS – on other models. Mo-torola was was followed by Samsung, E28, NEC and Panasonic/Matsushita in 2004. Interestingly, the market for smart phones brings two business models
12
See Gilbert and Katz (2001)’s An Economist’s Guide to U.S. v. Microsoft for more details about the court case against Microsoft that followed the shady bundling practice.
13
See http://www.mozilla.org/ (Accessed 18 January 2005) for more information and Hamm (2005) reporting on the growing market share of the Firefox browser in the U.S.
14For more, visit: http://developer.apple.com/darwin/projects/darwin/ (Accessed 10
together: support sellers providing the commercial Linux distribution, and smart phone manufacturers engaging in widget frosting.
2.2.4 Accessorising
Accessorising refers to firms selling accessories to OSS (Raymond, 2000). Accessories range from typical branding items such as T-shirts and mugs, to high-end documentation. O’Reilly & Associates’ involvement in open source began in 1991 with the publication ofProgramming Perl, a complete reference on the Perl programming language co-authored by Larry Wall, the creator of Perl.15 Part of O’Reilly’s business strategy is to employ full time key
developers of popular OSS, such as Larry Wall, to further in any way they like the development of the open source applications. Having key developers as major contributor give O’Reilly a quasi-monopolistic status.
Nevertheless, there exist some spillover effects as improvement of OSS triggers greater demand for documentation, which is beneficial for all pub-lishers. However, this type of spillover is different from the ones addressed above since contributing to OSS does not improve the quality of other firms products, but rather gives every publisher access to a greater market.
3
Some Recent Contributions
As pointed out by Lerner and Tirole (2004), analysis of situations where there is direct competition between proprietary software and OSS is relatively scarce. Two working papers providing some preliminary results are Gaudeul (2004) and Casadesus-Masanell and Ghemawat (2003). The two studies con-struct a model of duopoly involving a firm developing a proprietary software substitute to an OSS developed by a group individuals. Gaudeul (2004) was inspired by the development of LATEX.16 The main assumptions in Gaudeul
(2004) were that open source developers concentrate their effort on the num-ber of features – highly valued by advanced users – rather than on the de-velopment of a comprehensive graphical user interface (GUI) – highly valued
15Perl stands for
Practical Extraction and Report Language, for a concise history of the program and its development, see Lerner and Tirole (2002).
16LATEX is a high-quality typesetting system, with features designed for the production
of technical and scientific documentation. For more information see http://www.latex-project.org/ (Accessed 11 May 2005).
by basic users.17 Furthermore, the open source team may lack co-ordination
leading to code being written twice, or not at all. Proprietary firms, on the other hand, with the aim of targeting the larger population of basic users, concentrate on the development of the program’s GUI at the expense of a larger set of features. The results were (i) if it emerges, the OSS will be used by either low-income consumers who cannot afford a proprietary license, or by advanced users who value the number of sophisticated features, and (ii) as long as it does not discourage the development of the proprietary software with the more complete interface, OSS may lead to a rise in welfare.
The work of Casadesus-Masanell and Ghemawat (2003) was inspired by the growing success of GNU/Linux in a market dominated by Microsoft Win-dows. In their duopoly model, two operating systems are competing where one is available at no cost. The main feature of the model is a demand re-sponsive to the systems’ market share. That is, a larger market share makes the software more attractive from a user’s perspective. One implication of the model is that the firm will charge a lower price when competing with the open source alternative. However, sharing the market implies a market share less than 100 percent. This in turn leads to a lower valuation of the proprietary software by the consumers, than in the case of monopoly. The intuition behind this result is given by considering third-party complemen-tary products. A lower market share for one of the alternatives implies a lower incentive for a third party firm to develop complementary products, making the alternative less attractive. Therefore, and similarly to Gaudeul (2004), the model cannot give unambiguous predictions about welfare when an OSS competes directly with proprietary software.
Another working paper analysing for-profit firms’ investment in OSS is Henkel (2004). Henkel (2004) was motivated by the increasing number of embedded devices, such as the ones discussed in section 2.2.3. He develops a duopoly model of quality competition. In the model, firms require two complementary technologies as inputs. The two technologies are of different relative importance to the two firms. Firms can choose to develop one or both technologies, and can choose to keep private or make public their
de-17While this assumption is representative of the
early OSS, it is no longer valid for a large number of projects. Indeed many OSS concentrate on the development of GUI and Desktop Environment similar to Microsoft Windows and Apple Macintosh OS. Two leading open source desktop environments are KDE and GNOME; see http://www.kde.org (Accessed 11 December 2004) and http://www.gnome.org (Accessed 11 December 2004) for more information.
velopments. The main findings are as follows. When the technology is open source, an equilibrium exists where each firm specialises in the development of one technology. When the goods are substitutes, but close to independent: (i) a duopoly emerges if the technologies are kept private but does not emerge otherwise, and (ii) profits are higher when the technologies are open source than when they are proprietary. When the goods are substitutes, but close to independent, and/or the heterogeneity of the need for the two technologies is high: (i) the quality of the product is higher under the open source regime, and (ii) full disclosure of innovation by both firms is an equilibrium when the degree of openness is endogenised.
Clearly, the variety of business models and open source licences makes it difficult to construct a general model of firms’ involvement in OSS. The above contributions addressed different questions associated with different types of OSS. Therefore, one must bear in mind the results might only hold for a limited number of cases, andmight be sensitive to the key assumptions. As explained in section 2.1, there are two broad categories of licences: BSD-type licences which allow firms to keep their developments on an existing OSS private; and copyleft licences, such as the GPL, which enforce reciprocity. It follows, altering the assumption with respect to the type of licence used could alter the conclusion of the model. In the above, Gaudeul (2004) was inspired by the LATEX project released under a BSD-type license. His model however
assumed the software is released under a GPL license. Since his results are consistent with what was observed with the LATEX project, one may wonder
what effect assuming a BSD-type license would have on the results. The work of Casadesus-Masanell and Ghemawat (2003) and Henkel (2004) was inspired by GNU/Linux for personal computers and embedded devices. The two authors consequently assumed the software developed in their model is released under GPL. Hence, the results apply to copyleft software, a subset of open source software.
4
The Model
Consider two firms producing a single good made up of two components, one of which is software. The goods may range from perfect complements to perfect substitutes. The demand for the firm’s good is responsive to changes in quality, and changes in prices. Now, consider a two-stage game. In the first stage, firms may choose to increase the quality of their product by investing in
the development of the software component. We assume the cost of increasing the quality of the product is known in advance by the firm so there is no uncertainty about the outcome. When the firms are using an OSS in their product,and all, or part of it, is common tobothfirms, there exists a spillover effect. When we assume the software being developed/improved is released under GPL, the reciprocity requirement implies any developments made by one firm also benefit the other firm. If, on the other hand, firms develop proprietary software, no such spillover effect exists. In the second stage of the game, firms engage in Bertrand competition to set the price of their product. This model aims to answer the following two questions: (i) how do different market structures affect the quality improving investment decision, and (ii) what is the impact of the presence of spillovers on investment decisions.
4.1
A Demand System and the Duality of Duopoly
The two classical reference points for discussions of imperfect competition are the Cournot and Bertrand models. The former uses quantity as the strategic variable, while the latter uses price. The duality of the Cournot and Bertrand models in differentiated duopoly was first noted by Sonnenschein (1968), and further analysed by Singh and Vives (1984) in a paper which extends Dixit (1979). In order to analyse different market structures, our model uses Singh and Vives (1984)’s demand system. The properties of the demand system are outlined below.
Consider an economy composed of a monopolistic sector, and a compet-itive sector. The monopolistic sector is made up of two firms producing a differentiated good, and the competitive sector is treated as the num´eraire
sector. There is a single type of consumer with a utility function separable and linear in the num´eraire good. This implies there are no income effects on the monopolistic sector, and so, we can perform partial equilibrium analy-sis concentrating on the monopolistic sector alone. Assume a representative consumer has the following quadratic utility function,
U(q1, q2) = α1q1+α2q2 −
1 2(β1q
2
1 + 2γq1q2+β2q22) (1)
where qi is the quantity of goodi, and pi its price. For U to be concave over
the domain of interest, we assume αi and βi are > 0, βiβj −γ2 > 0, and
αiβj −αjγ > 0 for i 6= j, and i = 1,2. A composite good representing all other goods can be modelled by adding an extra term which enters the utility
function linearly (See Dixit (1979), and H¨ackner (2000)), but is not included since it does not change the analysis.
The representative consumer wishes to maximise his utility. That is,
max q1,q2 U(q1, q2) − 2 X i=1 piqi (2)
The first order conditions of the above problem yield the following linear inverse demands functions for product 1 and product 2:
p1 = α1−β1q1−γq2 (3)
p2 = α2−γq1−β2q2 . (4)
The above demand functions are defined in the region where prices are pos-itive. Because we are dealing with linear demand functions, an inverse func-tion exists and corresponds to the direct demand funcfunc-tions:
q1 = a1−b1p1+cp2 (5)
q2 = a2+cp1−b2p2 . (6)
Where ai = (αiβj −αjγ)/δ, bi = βi/δ, c = γ/δ, and δ = β1β2 − γ2 for
i6=j, and i= 1,2. By assumption, ai and bi are positive, and the condition
for U to be concave is now b1b2−c2 > 0. Furthermore, the direct demand
functions are defined in the region where quantities are positive. That is, where ai−bipi−cqj >0, for i6=j, and i= 1,2.
Definition 4.1. The goods are substitutes, independent, or complements ac-cording to whether γ is superior, equal, or inferior to 0 respectively.
That is, demand for good i is always downward sloping in its own price, increases with increases in pj if the goods are substitute, and decreases with
increases in pj if the goods are complements. The goods are perfect
substi-tutes if α1 =α2 and β1 =β2 =γ. Furthermore, in the caseαi =αj, γ2/βiβj
expresses the degree of product differentiation. For a positive γ, the closer
γ2/β
iβj is to 1, the more homogeneous the market.18 18A word of caution: β
i andβj in the above refers to the slope of the indirect demands.
This is not to be confused with β, which refers to the spillover rate introduced in the below. Our model does not use the indirect functions, and hence the confusion should be minimal.
The two systems of equations show the duality of the problem. Clearly, one can switch back and forth from the Cournot model to the Bertrand model by simply interchanging the Greek letters with their Roman counterparts. Hence, the duality allows one to prove two theorems for the price of one (Varian, 1992, p. 295). When constructing a model of software development, only Bertrand price competition appears reasonable. As such, this framework is used below.
4.2
Software Development with Spillover
Denote byxi, firmi’s unit quality improvement corresponding to a particular
investment in an OSS. The cost schedule of quality improvement is known by the firm, and is denoted by f(xi). The cost function for a unit quality
improvement f(xi) is quadratic such that f(xi) = φ(x2i/2), where φ is a
constant. The quadratic cost function allows for diminishing returns due to capacity restrictions.19
Firm i’s product quality is indexed by ai the intercept of its product’s
direct demand curve. Let ai be a linear function of firm i’s effective quality
improvement such that:
ai(xi, xj) =a+xi+βxj, (7)
wherexi+βxj is firmi effective quality improvement. Hencexi is the firm’s
own quality improvement, while βxj is the indirect quality improvement
leaking from firm j given an exogenous spillover rate β. In this context, β
takes some value between zero and one. A spillover of one implies firms are investing in the development of OSS common to both firms – equivalent to a public good – while a spillover rate of less than one implies only a portion of the OSS are common to both firms. For example, consider the Linux distributors discussed in section 2.2.1. While all distributors benefit from improvements on the Linux kernel, not all benefit from improvement to the OSS specific to each distributor. The parameter a is a benchmark index of quality, and is assumed to be equal across firms at the start of the game. That is, a is the status quo to which improvements can be made.
In what follows, we assume all software is released under a Copyleft li-cense. Note however the above formulation of investment with spillovers can
19
This formulation of cost is standard in models of R&D with spillover effect. See for instance d’Aspremont and Jacquemin (1988).
also accommodate BSD-type licences. All that changes is the interpretation of the parameter β. With GPL license, β refers to the portion of OSS com-mon to both firms. With BSD-type licences, β is the degree to which firms release their private development under the open source license.
For simplicity and without loss of generality, we consider prices net of marginal cost. Following Singh and Vives (1984) for a marginal cost mi
assumed to be constant and positive, we can replace αi and ai by αi −mi
and ai−bimi+cmj respectively. It follows that firm i’s payoff function is
simply its profit minus its cost of quality improvement. That is,
Πi(p;x) =piDi(p;x)−f(xi), (8)
where p = (pi, pj), x = (xi, xj), and Di(p;x) is the direct demand for firm
i’s product.
Before proceeding to the analysis of the model in Section 5, let us inves-tigate the dimensions of the above model. First, by using Singh and Vives (1984)’s demand system, we are able to analyse situations where the firms in the monopolistic sector produce goods ranging from perfect complements to perfect substitutes. Second, our formulation of investment with spillovers in section 4.2 allows us to compare the investment decision for firms producing OSS (β >0) with firms producing proprietary software (β= 0). Lastly, it is possible to analyse firms’ investment decision with Copyleft and BSD-type licences. The following concentrates on the case where firms develop a soft-ware released under a Copyleft licence in the first stage of the game, and engage in Bertrand price competition in the second stage.
5
Analysis
Because we are looking for the Sub-Game Perfect Nash Equilibrium (SPNE), we solve the game using backward induction.
5.1
Stage 2: Price Competition
Given history (xi, xj), we find a Nash equilibrium in stage 2 in terms of action
profile (pi, pj). The first order conditions corresponding to Equation 8 are:
∂Πi(p;x)
∂pi
Solving equations 9 forpi yields the reaction functions of firm ifor any price
level set by firm j given history (xi, xj):
pr
i(pj,x) =
ai(x) +cpj
2bi
i6=j . (10)
The above expression gives are the well known upward sloping best response functions for Bertrand competition. Solving Equations 9 (i= 1,2) forp1 and
p2 yields the following equilibrium prices as a function of all level of quality
improving investment. That is,
p⋆ i(x) =
2ai(x)bj −aj(x)c
4bibj−c2
i6=j . (11)
Given our assumptions and the demand system, this equilibrium is a pure strategy subgame equilibrium. Furthermore, it is unique and symmetric.
Proposition 5.1. The equilibrium price is increasing with an increase in the quality of its own product, and is increasing, neutral, or decreasing with an increase in the other firm’s product quality when the goods are substitutes, independent, or complements respectively.
Proof. We have ∂p⋆ i(x) ∂ai = 2bj D , and ∂p⋆ i(x) ∂aj = c D (12)
where D = 4bibj −c2. Given our assumption on the concavity of U, D is
always positive. Since demands are always downward sloping, bj is always
positive. Clearly∂p⋆
i(x)/∂ai >0, and the sign of∂p⋆i(x)/∂aj depends on the
sign of c.
5.2
Stage 1: Investment in Software Development
Substituting p⋆
i(x) into the profit functions Πi(p,x), for i = 1,2, we derive
the reduced game as a function of the pair (xi, xj) and the other exogenous
parameters. Solving ∂Π1(x)/∂x1 = 0 and ∂Π2(x)/∂x2 = 0 for x1 and x2
yields the pair (x⋆
1, x⋆2) which is the unique and symmetric Nash equilibrium
in stage 1. Unfortunately, the solutions generated by this problem do not lend themselves well to straightforward interpretation. To continue our analysis,
let us consider the case where b1 =b2 = b. From section 4.1, it follows the
goods are perfect substitutes when c=b, and are perfect complements when
c=−b. The corresponding equilibrium investments are:
x⋆ i =
2ab(2b+cβ)
φ(8b3 +c3)−4b2(1 +cφ+β)−2bc(cφ+β(1 +β)) , (13)
and the corresponding equilibrium prices are:
p⋆ i =
aφ(4b2−c2)
φ(8b3+c3)−4b2(1 +cφ+β)−2bc(cφ+β(1 +β)) , (14)
for i= 1,2.
6
Investment and Market Structure
The results presented in Table 1 are the equilibrium valuesx⋆
i andp⋆i given by
Equations 13 and 14 evaluated atcwhen the goods are perfect complements, independent, and perfect substitutes. Propositions 6.1 and 6.2 show how the equilibrium investment changes when the goods move from perfect comple-ments to perfect substitutes. That is, how x⋆
i and p⋆i change as c increases
from −b tob.
Proposition 6.1. A firm’s equilibrium quality improving investment is monoton-ically increasing when the goods move from complements to substitutes.
Proof. We simply need to show x⋆
i is strictly increasing incover [−b, b]. For
clarity of exposition, let us consider a full spillover, β = 1. The equilibrium investment x⋆
i corresponding to b1 =b2 =b, and β = 1 is:
x⋆ i =
2ab
(φ(4b2+c2)−4b(1 +cφ)) , i= 1,2. (15)
Differentiating 15 with respect to cyields:
∂x⋆ i ∂c = 4aφb(2b−c) (φ(4b2+c2)−4b(1 +cφ))2 , i= 1,2. (16) Clearly,∂x⋆
i/∂cis superior, equal, or inferior to zero whencis inferior, equal,
Table 1: Equilibrium Investment and Price
Relation between products:
Variable Complements Independent Substitutes
Full Spillover (β = 1) Investment 2a 9bφ−4 a 2bφ−2 3a bφ−4
Price 9bφ3aφ+4 2bφaφ
−2 aφ bφ+4 Open source (0< β 61) Investment −2a(β−2) 9bφ+2(β−2)(β+1) a 2bφ−(β+1) 2a(β+2) 3bφ−2(β+2)(β+1) Price 9bφ 3aφ −2(β−2)(β+1) aφ 2bφ−(β+1) 3aφ 3bφ+2(β+2)(β+1) Proprietary (β = 0) Investment 4a 9bφ−4 a 2bφ−1 4a 3bφ−4 Price 9bφ3aφ −4 aφ 2bφ−1 3aφ 3bφ−4
Hence, c < 2b always holds, implying ∂x⋆
i/∂cis strictly positive over [−b, b].
Clearly, the sign of∂x⋆
i/∂conly depends on (2b−c). One can check that this
is true for any value of β between zero and one. While, the result is obvious when differentiating Equation 13 with respect to c, the obtained derivative is fairly large, and for this reason is not reported here.
Proposition 6.1 implies firms invest a greater amount of resources to im-proving the quality of their product when the products are (gross) substitutes than when they are (gross) complements. The intuition behind this result is firms have a greater incentive to improve the quality of their product when they face competition. When the firms are monopoly, the existence of spillovers creates an incentive to collaborate while the pricing decisions of the two firms are independent. When the firm are producing complementary products, the more complementary the products, the more firms rely on each others sales. That is, the more complementary are the goods, the more firms free-ride on one another, which inhibits the incentive to improve the quality of their own products.
Proposition 6.2. A firm’s equilibrium price is monotonically increasing when the goods move from complements to substitutes.
Proof. The equilibrium price p⋆
i as a function of x⋆1 and x⋆2 simplifies to:
p⋆i(x ⋆ ) = a+x ⋆ 1+x⋆2 2b−c , i= 1,2, (17) where x⋆ = (x⋆
1, x⋆2) . Differentiating 17 with respect to c, and using the fact
our equilibria are symmetric yields:
∂p⋆ i(x⋆) ∂c = a (2b−c)2 + 2 2b−c ∂x⋆ i ∂c +x ⋆ i . (18)
From the monotonicity ofx⋆
i over [−b, b], it follows∂p⋆i(x⋆)/∂cis positive over
[−b, b]. Furthermore, similar to∂x⋆
i/∂c, the sign of∂p⋆i(x⋆)/∂conly depends
on (2b−c) for any β between zero and one.
The result of Proposition 6.2 is expected since increasing the quality of a product is costly for the two firms. That is, even when the firms produce substitute goods, their cost increases by the same amount, and we expect their equilibrium price to move in the same direction as costs.
7
Proprietary Software
vs.
Open Source
Soft-ware
Under the assumptions of the model, proprietary development is a special case occurring when β = 0. Therefore, we can compare the investment in software development when firms develop proprietary and open source software for any market structure between perfect complements and perfect substitutes. From section 4.2,β = 0 implies the quality parameter of a firm’s product becomes:
ai(xi) =a+xi . (19)
The corresponding equilibrium investment is:
x⋆ i =
4ab2
(c−2b)2(c+ 2b)φ−4b2 , (20)
and the corresponding equilibrium price is:
p⋆ i =
a(4b2−c2)φ
(c−2b)2(c+ 2b)φ−4b2 . (21)
Table 1 summarises the equilibrium x⋆
i and p⋆i for the three extreme cases
including when the software is proprietary. From Proposition 6.1, equilibrium investment and price are monotonically increasing when goods move from complements to substitutes.
Having established the relationship between quality improving investment and market structure, it is natural to investigate the effect of different devel-opment regimes on quality improving investment for each market structures.
Proposition 7.1. A firm’s equilibrium quality improving investment is in-creasing in the spillover rate when the goods are substitutes and independent, but is decreasing in the spillover rate when the goods are close to perfect complements.
Proof. Differentiating Equation 13 with respectβ, one can check that∂x⋆ i/∂β >
0 if and only if
c4φ+ 8b3(1 +cφ)−4b2c(cφ−2β) + 2bc2(β2−cφ)>0. (22) For any positiveb andφ, and anyβ between zero and one, the above inequal-ity is always satisfied whenctakes values in [0, b]. However, the inequality 22
does not hold when c=−band for values in the neighbourhood of−b. That is ∂x⋆
i/∂β 60 for c∈[−b, e), where e≪ 0. Unfortunately, a simple
expres-sion for this turning point could not be found.
Proposition 7.1 shows that the higher the spillover rate, the higher the in-vestment in software development for monopoly and competing firms. This implies that quality improving investment is greater when the software is open source than when the software is proprietary. However, quality im-proving investment for firms producing close to perfect complements is lower
when the software is open source than when it is proprietary. This result is in line with the intuition of Proposition 6.1. It suggests a strong free-riding effect when firms produce close to perfect complements. For instance, firms free-ride on each others’ sales when the software is proprietary, and free-ride on both sales and on each others’ developments when the software is open source.
8
Discussion: A Numerical Example
The above analysis can be illustrated using a simple numerical example. Consider the model with parameters taking the values from Table 2. The results of our propositions are general and hold for any downward sloping demand curves, positive prices and quantities, and convex utility. From our assumption on the demand curve, the own price elasticity of demand is −1 at the equilibrium point for the three extreme market structure, and for any positive value b such that b1 = b2 = b. Each equilibrium is expressed as a
function of the indicator of market structure c ∈ [−1.5,1.5], corresponding to the region on which the utility function is convex, and the spillover rate
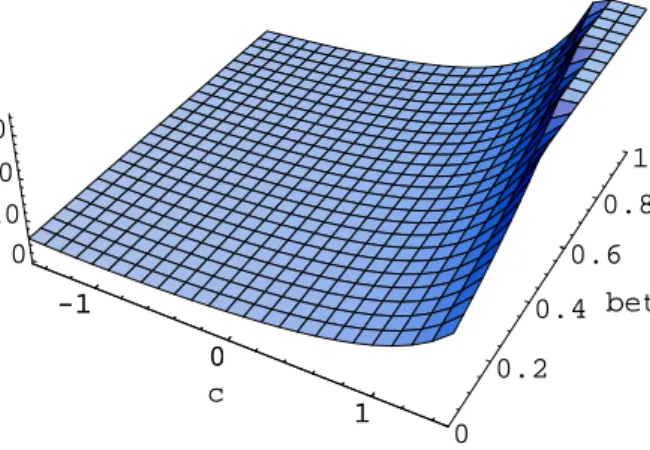
β ∈[0,1]. Recall the parameterφ is the slope of the marginal cost of quality improving investment, andais the benchmark index of quality. Figures 1, 2, and 3 give a graphical representation of the equilibrium investment, price, and profit of a firm respectively.
The results of Propositions 6.1 and 7.1 are clearly illustrated by Figure 1. Investment in software development increases when goods move from perfect complements to perfect substitutes under both proprietary and open source regimes. Investment is greatest when the goods are close to perfect substi-tutes, and the spillover is highest. On the other hand, investment is lowest when firms produce close to perfect complements, and is decreasing as the spillover increases. That is, when the goods are close to perfect complements,
Table 2: Numerical Example Parameter Values a 50 b1 1.5 b2 1.5 φ 3
investment is lower under an open source regime. While Figure 1 shows a rather flat surface, the slope of the surface computed with the expressions of Table 1 is approximately constant and equal to −0.9.
-1 0 c 1 0 0.2 0.4 beta 0.6 0.8 1 0 10 20 30 -1 0 1
Figure 1: Equilibrium Investment, x⋆ i(c, β)
While based on different assumptions, our model encompasses Henkel (2004)’s model when the open source decision is not endogenised. Recall β
measures the degree to which firms’ (GPL) software are similar. Hence, the measure of heterogeneity of need in the two technologies in Henkel (2004) is equivalent to the spillover β in our model. Henkel (2004) shows when the goods are substitutes but close to independent, and the heterogeneity of the
need for the two technologies is high, the quality of the product is higher under the open source regime. In our model, this situation occurs when c
takes a positive value close to 0, and we compare investment when β = 0 (proprietary) with investment when β is non-zero and low (OSS with high heterogeneity). Clearly, this is consistent with the results of Proposition 7.1. However, according to our model and using Henkel (2004)’s terminology, investment increases as firms’ needs become more homogenous and as the goods move closer to perfect substitutability.
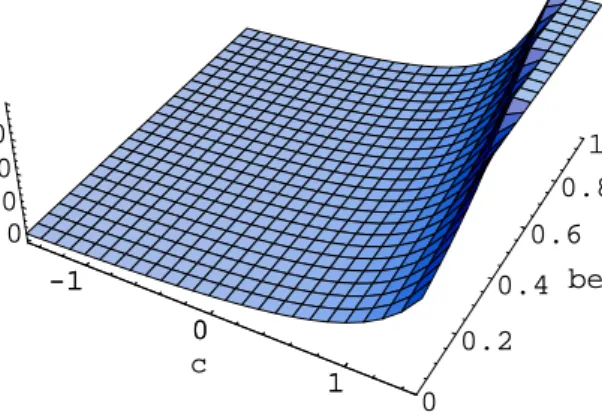
-1 0 c 1 0 0.2 0.4 beta 0.6 0.8 1 20 40 60 -1 0 1
Figure 2: Equilibrium Price, p⋆ i(c, β)
Henkel (2004) also shows when the goods are substitutes but close to independent, profits are higher when the technologies are open source than when they are proprietary. Figure 3 shows equilibrium profit, according to our model, follows a similar pattern to investment. Here again, our results are consistent with Henkel (2004). That is, when c takes a positive value close to 0, firm’s equilibrium profit when β = 0 is lower than when β is non-zero and low. However, equilibrium profit rises as firms’ needs become more homogeneous, and the goods move closer toward perfect substitutes. As shown in Figure 2, this occurs despite the fact equilibrium price rises with equilibrium investment. The intuition is that while consumers react negatively to prices, they react positively to increases in quality and are willing to pay a higher price for a product of higher quality. In addition,
-1 0 c 1 0 0.2 0.4 beta 0.6 0.8 1 0 1000 2000 3000 4000 -1 0 1
Figure 3: Equilibrium Profit, Π⋆ i(c, β)
open source implies that greater quality can be reached at a lower cost. As a result, firms’ profit is highest when they invest in a common software, and
the goods are close to perfect substitutes. Therefore, both Henkel (2004) and our model show that investments in OSS for competing firms is a strategic complement, while the pricing decisions is a strategic substitute.
The emergence of the numerous Linux distributors discussed in section 2.2.1 clearly supports the above hypothesis. Linux distributors sell close to per-fect substitutes (software plus services), and contribute actively to the de-velopment of the Linux kernel and its related applications. That is, Linux distributors are located where cis close to b and β is close to 1. Clearly, the emergence of GNU/Linux as a fierce competitor to the quasi-monopolist pro-prietary platform Microsoft Windows, and the popularity of the first Linux-powered smartphones in an industry dominated by the proprietary Symbian OS are well explained by our model.
9
Concluding Remarks
The model presented in this paper is the first to derive the relationship between market structure, development regime and investment in software development from a formal model of differentiated duopoly. This approach
allows for the complete and direct analysis of investment in software devel-opment in the three dimensions: market, regime, and common technology.
We proposed and analysed a model of firms’ investment in software de-velopment under different market structures. We constructed a two-stage game where firms chose first how much resources to invest to improve the software component of their product, and second, the price of their product. The results were as follows: (i) firms invest more in the development of their software when their products are substitutes for those of other producers; (ii) in the case when the products are substitutes, firms’ investment in software development is greatest when the software is open source; (iii) in the case the products are close to perfect complements for those of other producers, firms’ investment in software development is greatest when the software is proprietary; and (iv) when the products are substitutes, investment in open source software yields higher profits than investment in proprietary software. Last, we showed our model encompassed and extended the results of previous works.
Future works (currently in progress) should focus on extending and gen-eralising the model. A natural extension is to endogenise the development regime. This could be done by considering a three-stage version of this model where firms choose their regime in the second stage, and their investment de-cision in the third stage. However, while solvable, our assumptions regarding the demand system yield rather large and complex expressions. Therefore, a more general formulation of the demand system with similar properties is needed. One way to generalise the results to arbitrary demand functions is to appeal to the theory of supermodular games introduced by Topkis (1978).20
Assuming a unique SPNE price and quantity exist in the second stage of the game, we could derive the best response functions as functions of the equilibrium investment. From the above, the reduced form game is char-acterised by strategic complementarity. Hence, it can be shown the best response correspondences for investment are in fact supermodular. Conse-quently, all the results from the theory of supermodular games could be used to analyse the equilibrium of the model without the assumptions of concavity of the function, convexity of the set of arguments, or differentiability. Amir and Wooders (2000) is an application of a supermodular game to two-period duopoly R&D investment that could be adapted to the above situation.
20The theory of supermodular games and their application are extensively covered in
References
Amir, R., Wooders, J., 2000. One-way spillovers, endogenous innova-tor/imitator roles, and research joint ventures. Games and Economics Be-haviour 31, 1–25.
Benkler, Y., December 2002. Coase’s penguin, or, linux and the nature of the firm. The Yale Law Journal 112 (3), 369–446.
Casadesus-Masanell, R., Ghemawat, P., 2003. Dynamic mixed duopoly: A model motivated by linux vs. windows, iESE Research Papers No D/519, IESE Business School.
d’Aspremont, C., Jacquemin, A., 1988. Cooperative and noncooperative r&d in duopoly with spillovers. American Economic Review 78, 1133–1137. Dempsey, B. J., Greenberg, J., Jones, P., Weiss, D., 1999. A quantitative
profile of a community of f/oss linux developers, sILS Technical Report TR-1999-05.
DiBona, C., Ockman, S., Stone, M., 1999. Open Sources: Voices from the Open Source Revolution. O’Reilly, Sebastopol, CA.
Dixit, A., 1979. A model of duopoly suggesting a theory of entry barriers. The Bell Journal of Economics 10 (1), 20–32.
Fink, M., 2003. The Business and Economics of LINUX and Open Source. Prentice Hall PTR, Upper Saddle River, NJ.
Gaudeul, A., 2004. Competition between open-source and proprietary soft-ware: the case study, economics Working Paper Archive at WUSTL. Ghosh, R. A., Rudiger, G., Kreiger, B., Robles, G., 2002. The free/libre
and f/oss software developers survey and study – floss final report, http: //www.infonomics.nl/FLOSS/report; Accessed 29 November 2004. Gilbert, R. J., Katz, M. l., 2001. An economist’s guide to u.s. v. microsoft.
Journal of Economic Perspectives 15 (2), 25–44.
H¨ackner, J., 2000. A note on price and quantity competition in differentiated oligopolies. Journal of Economic Theory 93 (2), 233–239.
Hamm, S., 2005. Mozilla is gaining on godzilla, http://www.businessweek. com/technology/content/jan2005/tc20050112 0827 tc119.htm; Ac-cessed 15 January 2005.
Hann, I., Roberts, J., Slaughter, S., Fielding, R., 2002. Delayed returns to f/oss participation: an empirical analysis of the apache http server project, working Paper Available athttp://www.idei.asso.fr/commun/ Conferences/Internet/OSS2002/Papiers/Hann.PDF; Accessed 13 Sep-tember 2004.
Henkel, J., 2004. The jukebox mode of innovation – a model of commercial open source development, cEPR Discussion Papers No 4507.
Hertel, G., Nieder, S., Herrman, S., 2003. Motivation of software developers in open source projects: an internet-based survey of contributors to the linux kernel. Research Policy 32, 1159–1177.
Johnson, J. P., 2002. Open source software: Private provision of a public good. Journal of Economics & Management Strategy 11 (4), 637–662. Lakhani, K., von Hippel, E., 2003. How f/oss software works: ‘free’
user-to-user assistance. Research Policy 326, 923–943.
Lerner, J., Tirole, J., 2002. Some simple economics of open source. Journal of Industrial Economics 52, 197–234.
Lerner, J., Tirole, J., 2004. The economics of technology sharing: Open source and beyond, nBER Working Papers No 10956.
Lerner, J., Tirole, J., 2005. The scope of open source licensing. Journal of Law, Economics, and Organization 21, forthcoming.
Raymond, E., 2000. The magic cauldron, http://www.tuxedo.org/∼esr/;
Accessed 29 September 2004.
Raymond, E. S., 2001. Cathedral & the Bazaar: Musings on Linux and Open Source by an Accidental Revolutionary. O’Reilly, Cambridge, MA.
Rossi, M. A., 2004. Decoding the “free/open source (f/oss) software puz-zle” a survey of theoritical and empirical contributions, quaderni No 424, Dipartimento di Economia Politica, Universit`a degli Studi di Siena.
Singh, N., Vives, X., 1984. Price and quantity competition in a differentiated duopoly. The RAND Journal of Economics 15 (4), 546–554.
Sonnenschein, H., 1968. The dual of duopoly is complementary monopoly: or, two of cournot’s theories are one. Journal of Political Economics 76, 316–318.
The Economist, 1999a. Hackers rule. Feb. 20, p.63.
The Economist, 1999b. Venture communism. Jun. 12, p.60.
The Economist, 2005. The triumph of the commons. Feb. 12, p.61.
Topkis, D. M., 1978. Minimizing a submodular function on a lattice. Opera-tions Research 26, 305–321.
Topkis, D. M., 1998. Strategic Complementarity and Supermodularity. Princeton University Press, Princeton, NJ.
Varian, H. R., 1992. Microeconomic Analysis. W. W. Norton & Company, Inc., New York, NY.
Vives, X., 1999. Oligopoly Pricing: Old Ideas and New Tools. The MIT Press, Cambridge, MA.
Wayner, P., 2000. Free for All: How Linux and the Free Software Movement Undercut the High-Tech Titans. Harper Collins, New York, NY.