2014 Internship &
Co-op Survey
4 | 2013
National Association of Colleges and Employers
62 Highland Avenue • Bethlehem, PA 18017-9085 • 610.868.1421 www.naceweb.org©Copyright April 2014 by the National Association of Colleges and Employers
About the Survey ... 3
Executive Summary ...4
An Overview of Internship and Co-op Programs ... 6
The Purpose of Internship/Co-op Programs How Interns/Co-ops Spend Their Time Figures 1 – 7
Hiring Projections ... 10
Internship and Co-op Hiring Projections by Industry and Region Returning Students Figures 8 – 14 Recruiting ... 16 Cycle Time School Selection Figures 15 – 20 Conversion/Retention ... 23
Internship and Co-op Conversion Rates Internship and Co-op Retention Rates Figures 21 – 27
Compensation ... 27
Unpaid vs. Paid Internships Salaries Signing Bonuses Benefits Relocation Assistance Figures 28 – 37 Summary ...33 Appendix ...34 Survey Respondents
TABLE OF CONTENTS
ABOUT THE SURVEY
NACE’s 2013 Internship & Co-op Survey was conducted from November 18, 2013, through January 24, 2014. The survey was sent to 1,116 NACE employer members; 264, or 23.7 percent, took part. More than 20 industries were represented. By region, 22.7 percent of respondents were from the Northeastern United States; 25.8 percent were from the Southeast; 33.0 percent were from the Midwest; 17.8 percent were from the West; and 0.8 percent were from outside of the United States. Where possible, selected data are presented by industry and region.
Participating NACE members receive a complimentary copy of the survey report. Customized results of the survey are also available. Participants receive a 50 percent discount on custom reports. For more information, contract Kenneth C. Tsang, NACE research associate, at 610.625.1057 or [email protected].
NACE RESEARCH
Edwin W. Koc, Director of Strategic and Foundation Research Andrea Koncz, Employment Information Manager
Kenneth C. Tsang, Research Associate Anna Longenberger, Research Assistant
EXECUTIVE SUMMARY
Employers responding to the 2014 Internship & Co-op Survey once again affirm that internships and co-operative education programs are essential components of their college recruiting programs.
The following are key findings of the survey:
HIRING
• The number of internships is expected to decrease by 3.4 percent in 2014.
o About two-thirds of industries plan to decrease their intern hires in 2014, while the other one-third plan to increase their 2014 intern hires.
o By region, decreases are not expected in the Northeast, where employers expect an increase of 10 percent.
• The number of co-ops is expected to increase by 4.4 percent in 2014.
o About half of the industry groups have plans to increase co-op hiring in 2014, while the other half plans to decrease 2014 co-op hiring.
o Only employers in the Midwest plan to decrease their number of co-op hires in 2014.
RECRUITING
• Employers continue to prefer “high-touch” methods for recruiting interns and co-ops.
o Career fairs and on-campus recruiting comprise more than half of employers’ recruiting budgets for interns and co-op students.
o Career fairs and on-campus recruiting are rated highest in terms of effectiveness for recruiting interns and co-op students.
• School selection for recruiting interns and co-op students is based on the these top three reasons:
o Academic majors offered at the institution;
o Perceived quality of the programs from which the recruiter will obtain new interns and/or co-op students; and
CONVERSION AND RETENTION
• The conversion rate for interns rose this year to 51.2 percent.
• Employers made full-time offers to 64.8 percent of their interns; the acceptance rate dropped from 85.6 percent in 2013 to 79.0 percent in 2014.
• The co-op conversion rate increased from 36.9 percent in 2013 to 46.7 percent in 2014.
• The rate at which employers made full-time offers to their co-op students dramatically and steadily increased from 48.8 percent in 2013 to 56.8 percent in 2014. The rise in the offer rate coincided with a rise in the acceptance rate—an increase from 75.5 in 2013 to 82.2 percent in 2014.
• Employees who completed an internship or co-op program with their employer are more likely to be with the company at both the one-year and five-year retention benchmarks.
COMPENSATION
• The average hourly wage rate for interns at the bachelor’s degree level ranges from $15.05 to $17.94.
• The average hourly wage rate for interns at the master’s degree level ranges from $22.21 to $23.06.
• Class year and academic major show distinct differences in hourly wage rates for interns:
o Senior class interns are paid, on average, $2.89 more than freshman class interns.
o Among majors at the bachelor’s degree level, the highest pay rates are for engineering
students—$20.18 per hour—while liberal arts majors have the lowest pay rates at $17.02 per hour.
• The average hourly wage rate for co-ops at the bachelor’s degree level ranges from $15.17 to $19.24 per hour.
• The average hourly wage rate for co-ops at the master’s degree level ranges from $23.46 to $26.82 per hour.
• Employers continue to provide benefits to their interns and co-ops, although the least expensive benefits continue to be the most common—social activities, paid holidays, and service time.
o Relocation assistance is offered to interns by just over half of employers, and to co-ops by just under half.
AN OVERVIEW OF INTERNSHIPS AND
CO-OP PROGRAMS
THE PURPOSE OF INTERNSHIP/CO-OP PROGRAMS
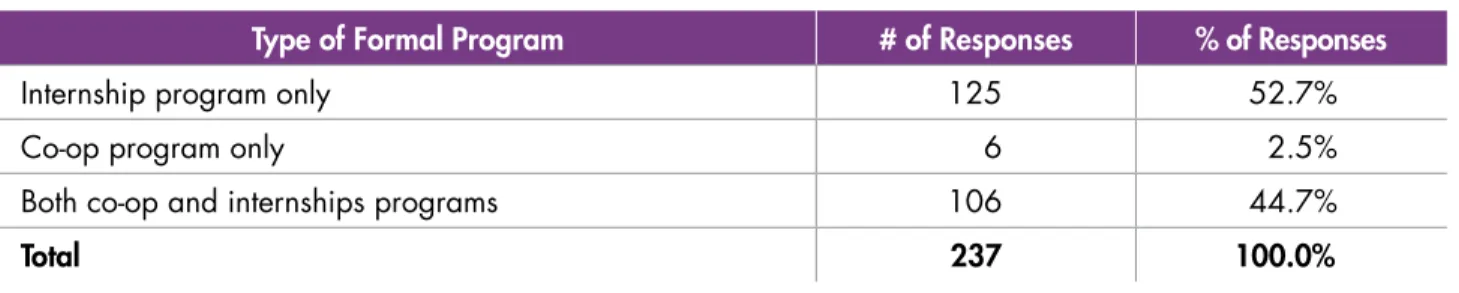
Nearly all respondents (92.2 percent) report that they have formal programs to hire interns and/or co-op workers. Among them, programs geared toward interns—either solely or in conjunction with co-ops—are the most popular. Meanwhile, programs that focus exclusively on co-op students are very rare. (See Figure 1.)
Employers in the western United States are far less likely to have co-op programs than employers in the Northeast, Southeast, and Midwest regions. Likewise, co-op programs are most common among employers in the northeastern region of the country. (See Figure 2.)
Type of Formal Program # of Responses % of Responses
Internship program only 125 52.7% Co-op program only 6 2.5% Both co-op and internships programs 106 44.7%
Total 237 100.0%
Figure 1: Respondents with a formal program
Internship Program
Only Co-op Program Only Internship ProgramsBoth Co-op and
Region % of Responses
Northeast 40.4% 3.8% 55.8% Southeast 56.7% 1.7% 41.7% Midwest 52.5% 2.5% 45.0% West 65.1% 2.3% 32.6%
Internship Programs Co-op Programs
# of Responses % of Responses # of Responses % of Responses
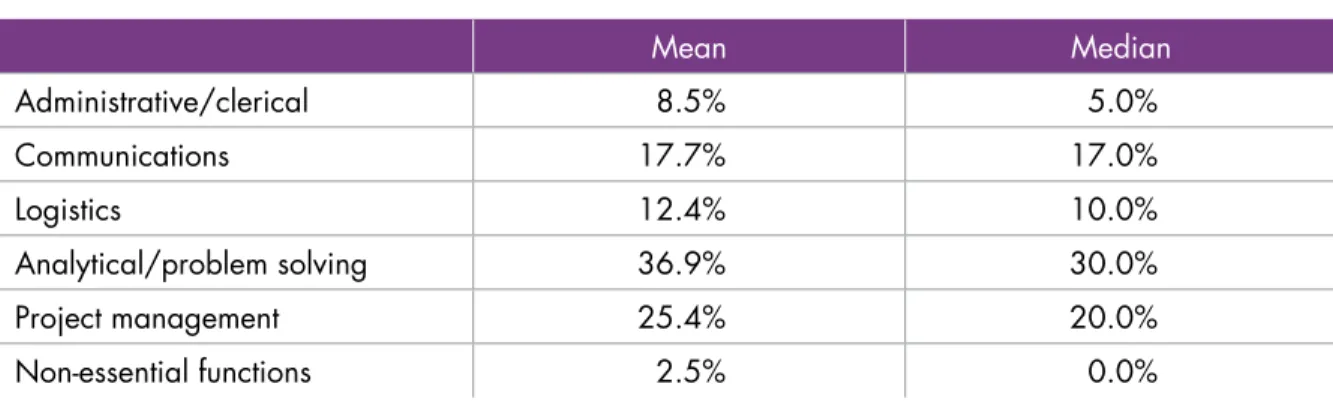
Recruit entry-level hires 166 77.6% 72 62.6% Build relationships with schools 5 2.3% 11 9.6% Provide experience 43 20.1% 32 27.8% Total 214 100.0% 115 100.0% Mean Median Administrative/clerical 8.5% 5.0% Communications 17.7% 17.0% Logistics 12.4% 10.0% Analytical/problem solving 36.9% 30.0% Project management 25.4% 20.0% Non-essential functions 2.5% 0.0%
Figure 3: Focus of internship and co-op programs
Figure 4: How interns/co-ops spend their time
HOW INTERNS/CO-OPS SPEND THEIR TIME
Because most respondents indicate that entry-level recruitment is the primary focus of their internship and co-op pro-grams, it is not surprising that, on average, 62.3 percent of an intern/co-op’s time is allocated toward analytical, problem-solving, and project management-related tasks. From another perspective, a near insignificant 2.5 percent of an intern/co-op’s time is reportedly spent on non-essential functions. (See Figure 4.)
Employers continue to use internship and co-op programs primarily to recruit graduates for entry-level positions. Three-quarters (77.6 percent) of employers sponsor internship programs and two-thirds (62.6 percent) have co-op programs. Respondents indicate that recruiting new hires is the primary focus of their programs.
Some 20.1 percent to 27.8 percent of employers indicate that the focus of their programs is to provide students with on-the-job experience. Few employers (3.8 to 9.2 percent) indicate that the purpose of their programs is to build relationships with schools. (See Figure 3.)
Industry Administration Communications Logistics Analytical Project Non-essential Average
Oil & Gas Extraction 5.8% 17.3% 9.1% 41.7% 24.4% 2.2% Utilities 7.8% 16.7% 16.6% 38.3% 23.8% 1.3% Construction 11.4% 12.9% 19.3% 20.8% 35.0% 5.0% Food & Beverage Mfg. 5.8% 18.5% 14.4% 29.0% 37.3% 0.4% Chemical (Pharmaceutical) Mfg. 7.7% 15.0% 12.1% 31.3% 31.3% 2.9% Computer & Electronics Mfg. 7.6% 16.4% 10.3% 46.5% 23.3% 2.1% Motor Vehicle Mfg. 10.0% 14.0% 15.0% 46.4% 18.0% 4.0% Misc. Mfg. 7.3% 15.8% 13.0% 31.7% 31.8% 3.5% Wholesale Trade 2.5% 15.0% 11.3% 27.5% 43.8% 0.0% Retail Trade 5.6% 27.4% 9.7% 31.9% 27.2% 2.0% Information 5.0% 15.3% 11.3% 33.8% 21.3% 1.0% Finance, Insurance, & Real Estate 10.2% 19.4% 12.3% 36.7% 22.0% 1.6% Accounting Services 12.0% 22.0% 10.0% 43.3% 12.0% 1.3% Engineering Services 12.1% 16.4% 24.2% 35.0% 11.4% 3.3% Management Consulting 7.8% 19.2% 8.5% 53.8% 18.2% 3.6% Misc. Prof. Services 10.1% 14.5% 7.2% 49.5% 18.1% 0.5% Social Services 16.3% 25.0% 11.7% 22.5% 27.3% 0.3% Government 19.0% 16.0% 13.0% 30.0% 18.8% 7.0%
Figure 5: Distribution of intern/co-op time, by industry
By industry, the same holds true, although there are some notable variations. Interns and co-ops in the social services sector and government agencies spend the most time on administrative tasks (16.3 percent and 19.0 percent, respectively). Communication-oriented duties for interns and co-ops are common in the retail trade, social services, and accounting services sectors (22.0 percent to 27.4 percent), while logistics-oriented duties for interns and co-ops are most common in the construction and engineering services industries (19.3 percent and 24.2 percent, respectively). Two professional services sector groups—management consulting and miscellaneous professional services—have interns and co-ops focusing on analytical and problem-solving tasks (49.5 percent and 53.8 percent, respectively), while interns and co-ops in the wholesale trade and food and beverage manufacturing sectors focus on project management (43.8 percent to 37.3 percent, respectively). Lastly, government agency interns and co-ops spend the most time on non-essential functions (7.0 percent, or more than twice the average of 2.5 percent). (See Figure 5.)
# of Responses % of Responses
Yes – for interns 36 14.2% Yes – for co-ops 16 6.3% Yes – for both interns and co-ops 7 2.8%
No 194 76.7%
Total 253 100.0%
Figure 6: Offering a rotational program as part of internship or co-op
About one-quarter (24.6 percent) of employers offer a rotational program for their interns and co-ops to explore different areas and aspects of their organizations. (See Figure 6.)
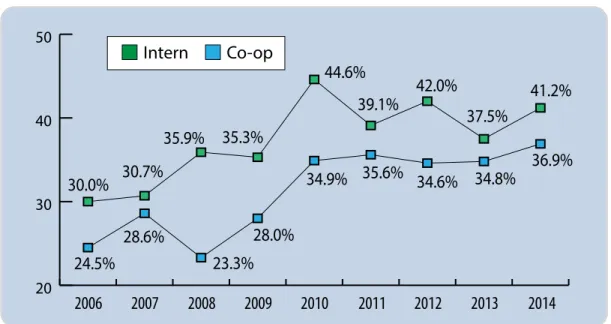
The hiring of interns and co-ops for time, entry-level positions increased from 2013. In 2014, 41.2 percent of time entry-level hires are expected to come from the employers’ own internship programs. Likewise 36.9 percent of full-time entry-level hires in 2014 are expected to come from the employers’ own co-op programs. (See Figure 7.)
20 30 40 50
30.0%
30.7%
35.9%
24.5%
28.6%
23.3%
28.0%
34.9% 35.6% 34.6% 34.8%
44.6%
35.3%
39.1%
42.0%
37.5%
41.2%
36.9%
2006
2007
2008
2009
2010
2011
2012
2013
2014
Intern
Co-op
Figure 7: Trends in hiring entry-level professional from internal
internship and co-op programs
-25 -20 -15 -10 -5 0 5 10
-1.8%
3.4%
2.9%
9.8%
8.3%
4.1% 4.9%
2.9%
6.8%
8.5%
5.8%
2.7%
4.4%
7.5%
8.6%
3.7%
-1.8%
-2.8%
-3.4%
-11.2%
-20.7%
-6.8%
2004 2005 2006 2007 2008 2009 2010 2011 2012 2013 2014
Intern
Co-op
Figure 8: Trends in internship and co-op hiring (in percents)
HIRING PROJECTIONS
Unchanged from previous years, 96.9 percent of employers report that they plan to hire interns and/or co-ops during 2014. According to retrospective intern and co-op hiring figures from 2013 and projected hiring figures for 2014, employers expect to hire 3.4 percent fewer interns and 4.4 percent more co-ops in 2014. (See Figure 8.)
Degree Level # of 2012-13 Hires # of 2013-14 Hires % Change Overall 27,576 26,647 -3.4% Associate 510 382 -25.1% Bachelor’s 21,506 21,776 1.3% Master’s 4,450 4,010 -9.9% Ph.D. 1,110 479 -56.9%
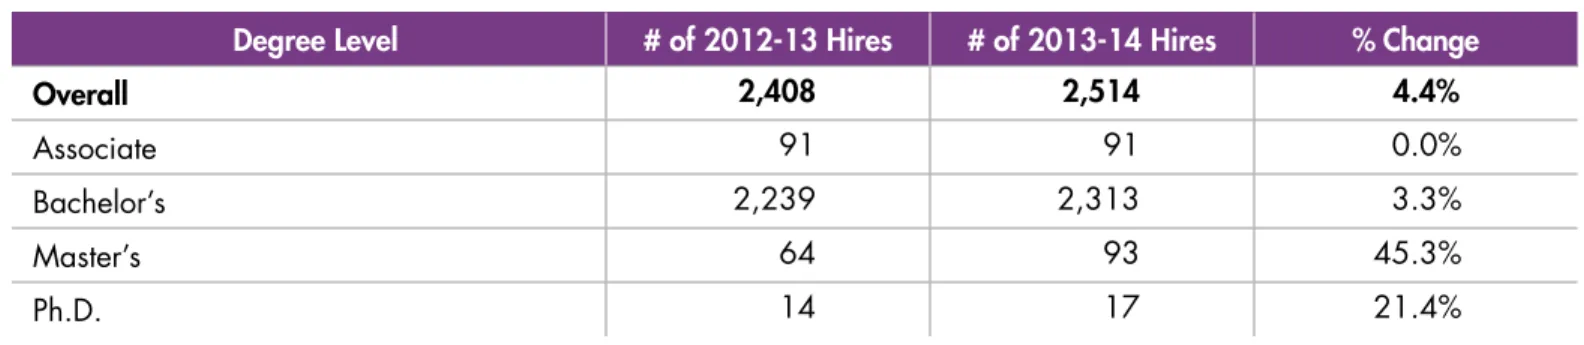
Degree Level # of 2012-13 Hires # of 2013-14 Hires % Change
Overall 2,408 2,514 4.4%
Associate 91 91 0.0%
Bachelor’s 2,239 2,313 3.3%
Master’s 64 93 45.3%
Ph.D. 14 17 21.4%
Figure 9: Intern hiring, 2013 vs. 2014, by degree level
Figure 10: Co-op hiring, 2013 vs. 2014, by degree level
However, while overall internship hiring figures indicate that employers plan to hire fewer interns in 2014, the projected decrease applies only to associate, master’s, and doctoral degree-level students. Employers actually plan to hire 1.3 percent more bachelor’s degree-level interns in 2014. For co-ops, employers indicated that they will hire the same number of students at the associate level, and 3.3 percent more students at the bachelor’s level. (See figures 9 and 10.)
INTERNSHIP AND CO-OP HIRING PROJECTIONS BY INDUSTRY AND REGION
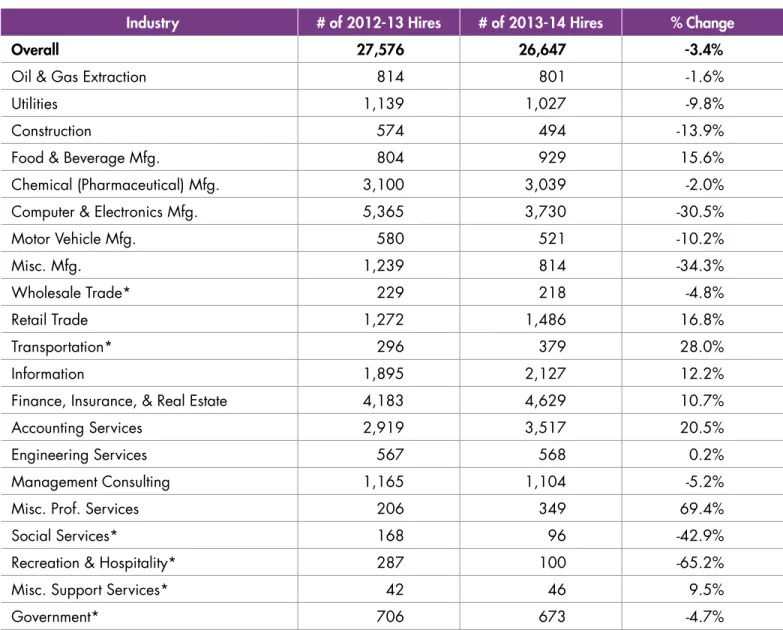
Although overall intern hiring was projected to decrease from 2013, employers in the following industries plan to hire significantly more interns in 2014:
• Food and beverage manufacturing,
• Retail trade
• Information,
• Finance,
• Insurance and real estate,
• Accounting services, and
• Miscellaneous professional services. (See Figure 11.)
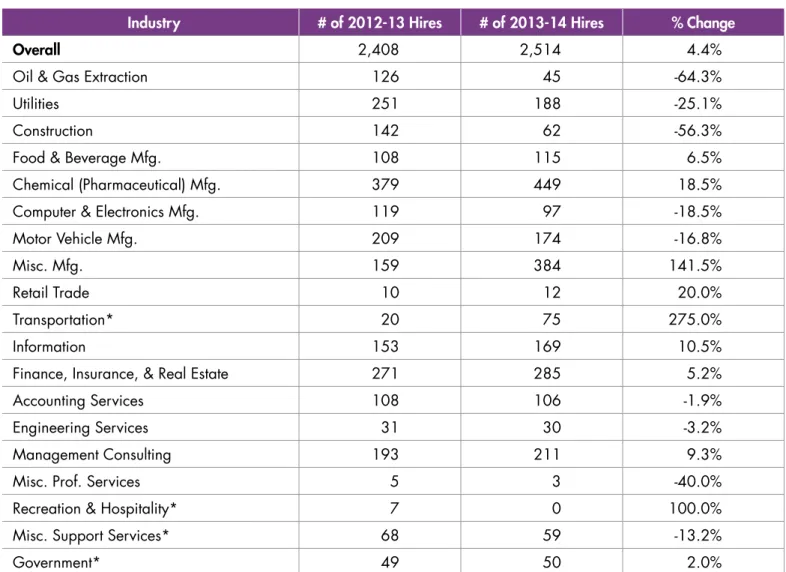
Likewise, while overall co-op hiring was projected to increase from 2013, employers in the following industries plan to hire significantly fewer co-ops in 2014:
• Oil and gas extraction,
• Utilities,
• Construction,
• Computer and electronics manufacturing,
• Motor vehicle manufacturing, and
Industry # of 2012-13 Hires # of 2013-14 Hires % Change
Overall 27,576 26,647 -3.4%
Oil & Gas Extraction 814 801 -1.6% Utilities 1,139 1,027 -9.8% Construction 574 494 -13.9% Food & Beverage Mfg. 804 929 15.6% Chemical (Pharmaceutical) Mfg. 3,100 3,039 -2.0% Computer & Electronics Mfg. 5,365 3,730 -30.5% Motor Vehicle Mfg. 580 521 -10.2% Misc. Mfg. 1,239 814 -34.3% Wholesale Trade* 229 218 -4.8% Retail Trade 1,272 1,486 16.8% Transportation* 296 379 28.0% Information 1,895 2,127 12.2% Finance, Insurance, & Real Estate 4,183 4,629 10.7% Accounting Services 2,919 3,517 20.5% Engineering Services 567 568 0.2% Management Consulting 1,165 1,104 -5.2% Misc. Prof. Services 206 349 69.4% Social Services* 168 96 -42.9% Recreation & Hospitality* 287 100 -65.2% Misc. Support Services* 42 46 9.5% Government* 706 673 -4.7%
*Caution should be used when viewing these figures, as the responses for this survey item included less than five respondents from the corresponding industry category.
Industry # of 2012-13 Hires # of 2013-14 Hires % Change
Overall 2,408 2,514 4.4%
Oil & Gas Extraction 126 45 -64.3% Utilities 251 188 -25.1% Construction 142 62 -56.3% Food & Beverage Mfg. 108 115 6.5% Chemical (Pharmaceutical) Mfg. 379 449 18.5% Computer & Electronics Mfg. 119 97 -18.5% Motor Vehicle Mfg. 209 174 -16.8% Misc. Mfg. 159 384 141.5% Retail Trade 10 12 20.0% Transportation* 20 75 275.0% Information 153 169 10.5% Finance, Insurance, & Real Estate 271 285 5.2% Accounting Services 108 106 -1.9% Engineering Services 31 30 -3.2% Management Consulting 193 211 9.3% Misc. Prof. Services 5 3 -40.0% Recreation & Hospitality* 7 0 100.0% Misc. Support Services* 68 59 -13.2% Government* 49 50 2.0%
*Caution should be used when viewing these figures, as the responses for this survey item included less than five respondents from the corresponding industry category.
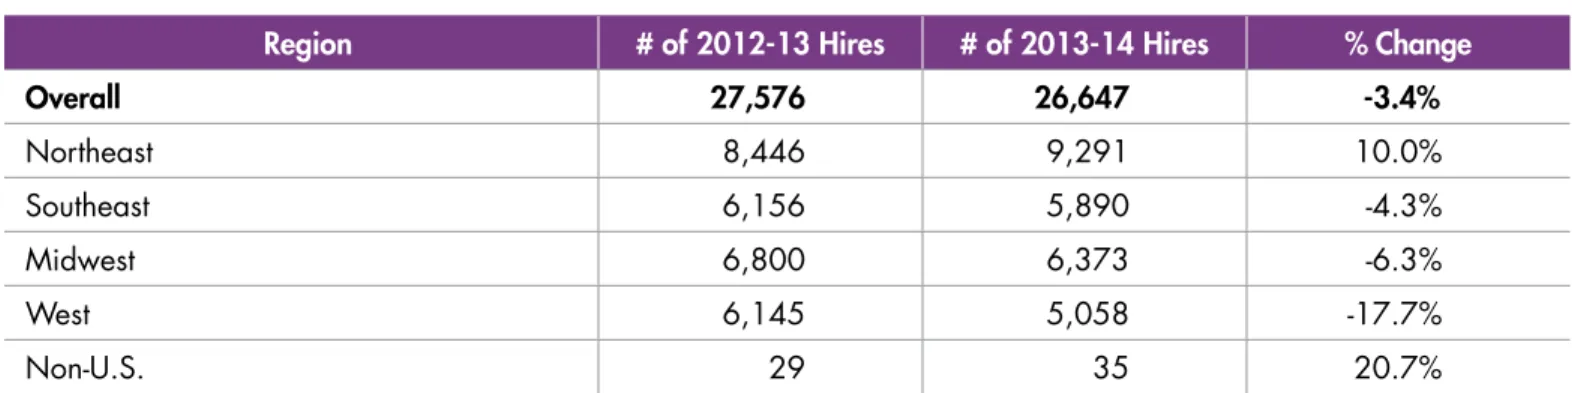
Regionally, while employers say intern hiring will decrease, employers in the Northeast plan to increase hiring by 10.0 percent in 2014. For co-ops, while hiring is projected to increase, employers in the Midwest project a 14.7 percent decrease from 2013. Although two-year co-op hiring figures for the western region are too low to suggest anything definitive, the data may be an indicator of a gradually increasing interest in co-ops among those employers, who have not traditionally embraced co-operative education programs. (See figures 13 and 14.)
Region # of 2012-13 Hires # of 2013-14 Hires % Change
Overall 27,576 26,647 -3.4% Northeast 8,446 9,291 10.0% Southeast 6,156 5,890 -4.3% Midwest 6,800 6,373 -6.3% West 6,145 5,058 -17.7% Non-U.S. 29 35 20.7%
Region # of 2012-13 Hires # of 2013-14 Hires % Change
Overall 2,408 2,514 4.4% Northeast 993 1,059 6.7% Southeast 537 543 1.1% Midwest 722 616 -14.7% West 112 251 124.1% Non-U.S. 44 45 2.3%
Figure 13: Intern hiring, 2013 vs. 2014, by region
Figure 14: Co-op hiring, 2013 vs. 2014, by region
RETURNING STUDENTS
Employers project that an average of 15.1 percent of their 2014 interns will be students who interned with them in 2013. In 2013, 13.1 percent of interns were rehires. By industry, employers in the retail trade, motor vehicle manufacturing, and miscellaneous professional services sectors project the greatest average percentage of intern rehires in 2014.
The overall rehire rate for co-ops is much higher than that of interns, but appears to be decreasing. Employers project that an average of 56.3 percent of their co-ops in 2014 will be students who completed a co-op program with them in 2013. The average co-op rehire figure for 2013 was 70.9. By industry, the highest co-op rehire rates are seen among employers in the chemical (pharmaceutical) and miscellaneous manufacturing sectors (38.8 percent and 59.7 percent, respectively).
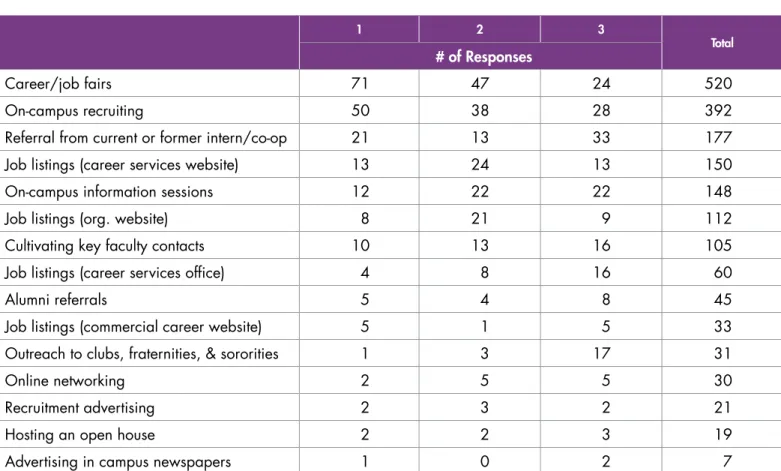
RECRUITING
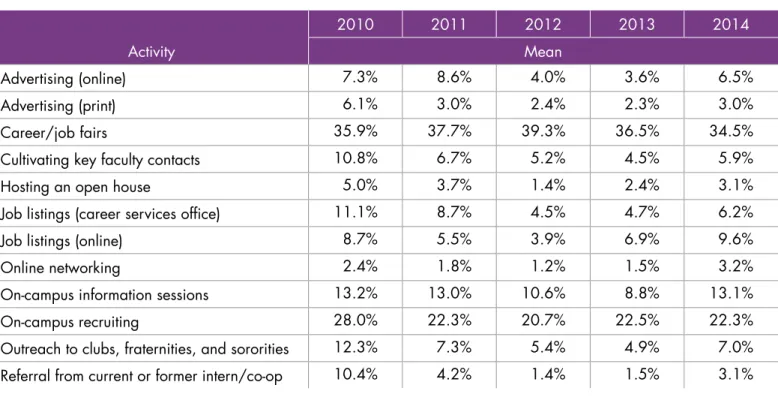
Despite the growth of online recruiting platforms, “face-to-face” strategies for internship and co-op hiring continue to be the most heavily funded and most highly rated recruiting activities. Since 2010, career fairs, on-campus information sessions, and on-campus recruiting sessions received 69.9 percent of employers’ entire internship recruiting budgets, and 59.4 percent of their co-op recruiting budgets. These strategies, along with job listings on career services websites, cultivating key faculty contacts, and referrals from current or formers interns and co-ops, are rated among the most highly effective recruiting activities. (See figures 15 through 18.)
2010 2011 2012 2013 2014 Activity Mean
Advertising (online) 7.3% 8.6% 4.0% 3.6% 6.5% Advertising (print) 6.1% 3.0% 2.4% 2.3% 3.0% Career/job fairs 35.9% 37.7% 39.3% 36.5% 34.5% Cultivating key faculty contacts 10.8% 6.7% 5.2% 4.5% 5.9% Hosting an open house 5.0% 3.7% 1.4% 2.4% 3.1% Job listings (career services office) 11.1% 8.7% 4.5% 4.7% 6.2% Job listings (online) 8.7% 5.5% 3.9% 6.9% 9.6% Online networking 2.4% 1.8% 1.2% 1.5% 3.2% On-campus information sessions 13.2% 13.0% 10.6% 8.8% 13.1% On-campus recruiting 28.0% 22.3% 20.7% 22.5% 22.3% Outreach to clubs, fraternities, and sororities 12.3% 7.3% 5.4% 4.9% 7.0% Referral from current or former intern/co-op 10.4% 4.2% 1.4% 1.5% 3.1%
1 2 3
Total
# of Responses
Career/job fairs 71 47 24 520 On-campus recruiting 50 38 28 392 Referral from current or former intern/co-op 21 13 33 177 Job listings (career services website) 13 24 13 150 On-campus information sessions 12 22 22 148 Job listings (org. website) 8 21 9 112 Cultivating key faculty contacts 10 13 16 105 Job listings (career services office) 4 8 16 60 Alumni referrals 5 4 8 45 Job listings (commercial career website) 5 1 5 33 Outreach to clubs, fraternities, & sororities 1 3 17 31 Online networking 2 5 5 30 Recruitment advertising 2 3 2 21 Hosting an open house 2 2 3 19 Advertising in campus newspapers 1 0 2 7
Respondents were given a list of criteria (plus an option to add others) and asked to rank their top three. NACE researchers then applied scores to each ranking: each “1” received 5 points, “2” received 3 points, and “3” received 1 point. Points were then summed to get a total score for each criterion.
2010 2011 2012 2013 2014 Activity Mean
Advertising (online) 6.6% 8.0% 3.8% 3.9% 2.5% Advertising (print) 7.9% 1.8% 1.9% 2.0% 2.9% Career/job fairs 30.2% 38.9% 37.4% 37.7% 34.3% Cultivating key faculty contacts 8.9% 5.7% 7.9% 4.3% 7.7% Hosting an open house 4.6% 3.9% 1.2% 1.8% 3.1% Job listings (career services office) 18.4% 8.2% 8.1% 6.7% 6.7% Job listings (online) 11.3% 5.2% 3.3% 3.8% 10.0% Online networking 1.3% 1.0% 0.6% 1.1% 1.9% On-campus information sessions 14.6% 12.6% 11.1% 9.0% 9.3% On-campus recruiting 26.6% 20.3% 19.2% 24.8% 15.8% Outreach to clubs, fraternities, and sororities 7.5% 5.5% 3.9% 3.9% 3.7% Referral from current or former intern/co-op 4.4% 2.1% 1.4% 1.0% 4.5%
1 2 3
Total
# of Responses
Career/job fairs 27 15 10 190 On-campus recruiting 15 17 12 138 Job listings (career services website) 11 11 8 96 Cultivating key faculty contacts 8 9 7 74 Referral from current or former intern/co-op 6 4 13 55 On-campus information sessions 4 10 5 55 Job listings (org. website) 3 5 6 36 Job listings (career services office) 3 4 6 33 Alumni referrals 2 1 1 14 Online networking 1 1 0 8 Advertising in campus newspapers 0 1 3 6 Outreach to clubs, fraternities, & sororities 0 0 6 6 Job listings (commercial career website) 0 1 1 4 Hosting an open house 0 1 0 3 Recruitment advertising 0 0 1 1
Respondents were given a list of criteria (plus an option to add others) and asked to rank their top three. NACE researchers then applied scores to each ranking: each “1” received 5 points, “2” received 3 points, and “3” received 1 point. Points were then summed to get a total score for each criterion.
CYCLE TIME
Respondents were asked to report the length, in days, of three specific recruiting cycles:
• The average number of days between publicly listing a job opportunity and holding an interview,
• The interview date and the date the position is offered to a candidate, and
• The date of the offer and the deadline for acceptance/rejection.
Overall, posting-to-interview cycle times did not vary from 2013, with a mean of 33 days and median of 30 days in 2014. Interview-to-offer cycles times also did not change significantly from 2013, with a mean of 20 days and a median of 14 days. Offer-to-acceptance cycle times, however, saw a notable increase. Compared to the 2013 report, the mean rose from 11 days to 13 days, and the median rose from 7 days to 14 days.
For the posting-to-interview cycle time, wholesale trade employers reported a mean and median of 60 days, while those in the oil and gas extraction industry reported a mean of 16 days and a median of 14 days.
For the interview-to-offer cycle time, government agencies reported the longest waiting period, with a mean of 60 days and a median of 30 days. Retail trade employers reported a mean of 13 days and a median of 14 days.
Employers in the wholesale trade and accounting services sectors reported the longest offer-to-acceptance cycles with reported means of 22 days and 25 days, respectively, and reported medians of 22 days and 14 days, respectively. Employers in the motor vehicle manufacturing industry reported the shortest time period before a job offer expired—a mean and median of just five days. (See Figure 19.)
Industry Posting to Interview Interview to Offer Offer to Acceptance Mean Median Mean Median Mean Median
Overall 33 30 22 15 13 14
Oil & Gas Extraction 16 14 31 30 8 7 Utilities 38 30 31 30 8 7 Construction 37 23 20 23 13 14 Food & Beverage Mfg. 44 30 17 17 19 14 Chemical (Pharmaceutical) Mfg. 40 30 19 14 14 14 Computers & Electronics Mfg. 25 24 18 14 9 7 Motor Vehicle Mfg. 25 16 22 23 5 5 Misc. Mfg. 32 30 24 15 14 14 Wholesale Trade 60 60 14 14 22 22 Retail Trade 33 30 13 14 13 14 Information 31 25 16 15 17 14 Finance, Insurance, & Real Estate 27 25 18 11 9 7 Accounting Services 43 45 40 30 25 14 Engineering Services 27 20 37 30 13 7 Management Consulting 34 30 16 14 20 14 Misc. Prof. Services 39 38 19 15 19 10 Social Services 32 30 27 30 9 7 Government 33 20 60 30 7 7
SCHOOL SELECTION
The top six reasons respondents chose particular schools for their intern and co-op recruiting in 2014 are the same as they were in 2012 and 2013. These top school selection criteria are consistent with those for full-time college hires, which is to be expected given the intimate connection between internships and full-time recruiting. (See Figure 20.)
1 2 3
Total
# of Responses
Majors offered 45 41 15 363 Quality of programs 46 29 16 333 Past recruiting experience at school 40 23 32 301 Location of school 27 36 32 275 Success of school’s alumni in your
organization 13 22 20 151 Diversity of student body 7 16 23 106 Accreditation of school 10 6 5 73 National rankings 6 8 5 59 Reputation of school 3 8 13 52 Interest of school’s graduates in your
organization 5 2 12 43
Retention history with school’s alumni 2 4 12 34 Size of school 3 3 6 30 Executives are alumni of school 3 1 9 27
Average GPA 1 5 0 20
Cost to recruit at school 0 3 4 13 Helpfulness of career services staff 0 0 6 6
Respondents were given a list of criteria (plus an option to add others) and asked to rank their top three. NACE researchers then applied scores to each ranking: each “1” received 5 points, “2” received 3 points, and “3” received 1 point. Points were then summed to get a total score for each criterion.
CONVERSION/RETENTION
INTERN AND CO-OP CONVERSION RATES
Although the intern conversion rate reached an all-time high of 58.6 percent in 2012, it dropped to 48.4 percent in 2013, and in 2014, settled at 51.2 percent—a figure consistent with data of the mid-2000s pre-recession period. Offers of full-time employment to interns increased for the first time since 2011, reaching an offer rate of 64.8 percent in 2014. However, the acceptance rate declined, falling to a six-year low of 79.0 percent. (See Figure 21.)
20 40 60 80 100
77.6%
57.6%
44.7%
68.1%
52.3%
35.6%
73.0%
72.6%
53.0%
72.9%
72.5%
67.7%
63.3% 66.7%61.2%
56.5%
64.8%
83.6% 83.9% 86.5% 86.5% 85.6%
79.0%
69.6%
50.5%
56.6% 53.3%
57.7% 58.6%
48.4% 51.2%
64.9%
47.3%
2006
2004 2005
2007 2008 2009 2010 2011 2012 2013 2014
Offer Rate
Acceptance Rate
Conversion Rate
Offer Rate Acceptance Rate Conversion Rate Overall 64.8% 79.0% 51.2% Associate 69.4% 66.7% 46.3% Bachelor’s 60.5% 77.4% 46.8% Master’s 84.7% 84.0% 71.1% Ph.D. 51.7% 88.9% 46.0%
Figure 23: Intern conversion, by degree level
In 2014, co-op hiring saw positive increases in all three areas: conversion rates, offer rates, and acceptance rates. The co-op conversion rate rose from 35.9 percent in 2012 to 46.7 percent in 2014. The co-op offer rate sharply increased in two years from 38.8 percent in 2012 to 56.8 percent in 2014. Meanwhile, the co-op acceptance rate appears to be rising slowly, moving from 75.5 percent in 2013 to 82.2 percent in 2014. (See Figure 22.)
20 40 60 80 100
82.4%
60.2%
49.6%
52.8%
48.0%
30.1%
86.3%
74.2%
64.0%
74.9%
73.3%
71.0%
65.7% 63.2%
75.5%
48.8%
56.8%
80.7%
78.5%
92.0%
87.8%
89.8%
82.2%
59.2%
35.9%
55.7%
60.4%
55.5%
38.8%
36.9%
46.7%
74.9%
52.4%
2006
2004 2005
2007 2008 2009 2010 2011 2012 2013 2014
Offer Rate
Acceptance Rate
Conversion Rate
Figure 22: Trends in co-op conversion (by percents)
When broken down by level of degree, it is clear that master’s-level interns are the most likely to receive an offer of full-time employment, and are also among the most likely to accept those offers, resulting in the highest intern conversion rates among all four degree levels. In terms of co-ops, bachelor’s-level students are only about half as likely as doctoral-level students to receive an offer of full-time employment. (It should be noted, however, that response rates regarding doctoral-level students are low and may not offer any definitive interpretations.) (See figures 23 and 24.)
INTERN AND CO-OP RETENTION RATES
As in the past, internship and co-op experience is strongly associated with a longer tenure of employment. Overall, after one year, employers retain about three-fourths (77.5 to 78.0 percent) of their new college hires who have internship experience—either internal (internship with the same employer) or external (internship with a different employer). Just under two-thirds (62.8 percent) of new college hires without any past internship experiences are retained after one year. The same pattern holds true for five-year retention rates. After five years, 57.3 percent of employees hired through an internal internship program were retained, and 52.2 percent with internship experiences through another employer were retained, while 45.0 percent who were hired without any internship experience were retained. (See figures 25 and 26.)
Offer Rate Acceptance Rate Conversion Rate
Overall 56.8% 82.2% 46.7%
Associate 100.0% 100.0% 100.0% Bachelor’s 53.7% 82.2% 44.1% Master’s 66.7% 72.5% 48.3% Ph.D. 97.1% 100.0% 97.1%
Figure 24: Co-op conversion, by degree level
Industry Own Intern Other Intern No Internship Mean
Overall 78.0% 77.5% 62.8%
Utilities 77.4% 95.5%* 95.0%* Construction 64.8% 56.2%* 53.8%* Food & Beverage Mfg. 66.5% 81.5%* 54.4% Chemical (Pharmaceutical) Mfg. 86.6% 82.2% 65.2% Computers & Electronics Mfg. 68.3% 86.7%* 87.0%* Misc. Mfg. 78.1% 81.2% 75.0% Retail Trade 72.3% 80.8% 75.3%* Finance, Insurance, & Real Estate 82.5% 81.0% 95.5% Engineering Services 83.4% 64.0%* 10.0%* Management Consulting 77.0% 74.7% 61.7%
*Caution should be used when viewing these figures, as the responses for that survey item included less than five respondents from the corresponding industry category. Industries with at least five respondents in one or more columns are displayed.
Industry Own Co-op Other Co-op No Co-op Mean
One-year retention rate 59.7% 51.9% 43.0% Five-year retention rate 43.2% 34.9% 30.5%
Figure 27: Average retention rates: one year and five year
Industry Own Intern Other Intern No Internship Mean
Overall 57.3% 52.5% 45.0%
Chemical (Pharmaceutical) Mfg. 76.1% 69.4% 56.3% Misc. Mfg. 55.1% 56.1% 81.7%* Retail Trade 54.2% 50.3%* 60.0%* Finance, Insurance, & Real Estate 57.5% 56.3% 46.4% Management Consulting 39.0% 37.0% 24.4%
*Caution should be used when viewing these figures, as the responses for that survey item included less than five respondents from the corresponding industry category. Industries with at least five respondents in one or more columns are displayed.
Figure 26: Average retention rates: five year, by industry
Co-ops show a similar pattern of retention. Overall, after one year, 59.7 percent of former co-op students turned employees are retained; 51.9 percent of new college hires from external co-op programs are retained. However, 43.0 percent of new college hires without any co-op experience are retained after one year. At the five-year mark, 43.2 percent of internal hires, 34.9 percent of external hires, and 30.5 percent of non-co-op hires are retained. (See Figure 27.)
COMPENSATION
UNPAID VS. PAID INTERNSHIPS
NACE members have consistently provided their interns with wages. In 2014, employers reported that an average of 97.5 percent of their internship programs were paid—compared to 99.4 percent in 2013, and 99.6 percent in 2012.
SALARIES
Continuing a trend seen in the 2013 Guide to Compensation for Interns & Co-ops, the average hourly wage rates for interns have remained relatively unchanged, with only slight increases of $0.52 to $0.70, depending on the year of study.
The average hourly wage rates for co-ops are increasing at a faster rate. Compared to the 2013 report, their rates have increased from $0.29 to $5.89, depending on the year of study, with the more pronounced increases applying to older students. For example, using the above figures, freshman rates increased by $0.29, while master’s second-year rates increased by $5.89.
The average hourly wage rate for bachelor’s degree interns is $16.35, an increase from $16.26 in 2013 and $16.21 in 2012. The average hourly wage rate for master’s degree interns also increased to $22.50—up from $21.90 in 2013 and $21.93 in 2012. Overall, master’s degree interns are paid about 28 percent more than bachelor’s degree interns.
The average hourly wage rate for bachelor’s degree co-ops also saw increases from 2013, rising from $16.23 to $17.44. The average hourly wage rate for master’s degree co-ops has fluctuated in recent years, moving from $22.44 (2012) to $20.58 (2013) to $25.04 (2014). Master’s degree co-ops earn about 30 percent more than bachelor’s degree co-ops.
The specific year in school also correlated for interns and co-ops. In general, senior-year interns earn about 16 percent more than freshman-year interns, and senior-year co-ops earn about 21 percent more than freshman-year co-ops. Overall, bachelor’s degree and master’s degree interns and co-ops majoring in engineering and computer science earned consistently high average hourly wage rates. For senior-year interns, those majoring in computer science and engineering earn average hourly wage rates of $19.16 and $20.18, respectively. Senior-year interns majoring in communication and education earn the lowest average hourly wage rates—$16.34 and $16.82, respectively. (See figures 28 and 29.) Intern and co-op compensation information based on major, industry, region, degree, and year in college, is available in NACE’s 2014 Guide to Compensation for Interns & Co-ops.
Offered
% of Respondents Answering, “Yes” 16.7% # of Respondents Answering, “Yes” 37 Total # of Respondents 222
Figure 30: Offered signing bonus to interns/co-ops, 2013
# of Responses Mean
Freshman 671 $15.05 Sophomore 843 $16.10 Junior 1,151 $17.19
Senior 992 $17.94
Master’s degree, first year 748 $22.21 Master’s degree, second year 593 $23.06
# of Responses Mean
Freshman 209 $15.17 Sophomore 242 $16.74
Junior 278 $17.93
Senior 273 $19.24
Master’s degree, first year 178 $23.46 Master’s degree, second year 157 $26.82
Figure 28: Average intern hourly wage rates, by year of study
Figure 29: Average co-op hourly wage rates, by year of study
SIGNING BONUSES
Nearly one-fifth of employers (18.0 percent) plan to offer signing bonuses to interns and co-ops in 2014—a small increase from 2013. Overall, the signing bonuses offered to interns and co-ops made notable increases. Using median figures, interns receive $250 more in 2014 than in 2013, and co-ops receive $1,000 more. (See figures 30 through 33.)
Interns Co-ops
Mean Median Mean Median
$3,248 $2,250 $6,286 $3,000
Total # of Respondents 30 7
Interns Co-ops
Mean Median Mean Median
$3,265 $2,500 $4,917 $4,000
Total # of Respondents 29 6
Figure 32: Signing bonus amount to interns/co-ops, 2013
Figure 33: Signing bonus amount to interns/co-ops, 2014
Offered
% of Respondents Answering, “Yes” 18.0% # of Respondents Answering, “Yes” 38 Total # of Respondents 211
Interns Co-ops
Benefit # of Responses % of Responses # of Responses % of Responses
Dental 21 9.5% 11 9.6% Service time 69 31.2% 41 36.0% 401(k) 48 21.7% 27 23.7% Medical 24 10.9% 14 12.3% Paid holidays 98 44.3% 58 50.9% Social activities 154 69.7% 60 52.6% Scholarship 15 6.8% 8 7.0% Tuition reimbursement 9 4.1% 5 4.4% Vacation 27 12.2% 19 16.7% No benefits 38 17.2% 28 24.6%
Figure 34: Benefits provided to interns and co-ops
BENEFITS
Overall, more employers provide benefits to their interns and co-ops, continuing a multi-year trend of increasing benefits provisions. The most common benefits offered are service time, paid holidays, and social activities. Few employers provide dental insurance, scholarship funding, or tuition reimbursement. (See Figure 34.)
RELOCATION ASSISTANCE
The percentage of employers that offer relocation assistance to interns and co-ops remain unchanged from 2013, with 55.0 percent of employers planning to provide this service to interns in 2014, and 44.1 percent planning to provide it to co-ops. Employers in the oil and gas extraction and food and beverage manufacturing industries are the most likely to providing relocation assistance to interns. Those in the chemical (pharmaceutical) and miscellaneous manufacturing industries are the most likely to provide relocation assistance to co-ops. The most common components of relocation assistance programs include housing stipends and moving allowances. Overall, the median dollar amount allotted to individual intern and co-op students is $1,500. (See Figures 35 through 37.)
Interns Co-ops % of Responses Answering, “Yes’
Overall 55.0% 44.1%
Oil & Gas Extraction 83.3%
-Utilities 44.4%
-Construction 50.0% 40.0% Food & Beverage Mfg. 90.9% -Chemical (Pharmaceutical) Mfg. 73.1% 68.4% Computers & Electronics Mfg. 69.6% 40.0% Motor Vehicle Mfg. 30.0% 37.5% Misc. Mfg. 69.6% 71.4% Retail Trade 47.1% -Information 50.0% -Finance, Insurance, & Real Estate 48.0% 14.3% Accounting Services 60.0% -Engineering Services 25.0% -Management Consulting 35.7% 33.3% Misc. Prof. Services 36.4% -Government 40.0%
-Total # of respondents 222 111
Figure 35: Relocation assistance, by industry
Interns Co-ops
# of Responses % of Responses # of Responses % of Responses
House hunting 9 7.8% 5 11.1% Housing stipend 62 53.4% 21 46.7% Moving allowance 49 42.2% 19 42.2% Provide housing 32 27.6% 6 13.3% Set allowance 26 22.4% 11 24.4%
Interns Co-ops
Mean Median Mean Median
Average relocation amount $2,364 $1,500 $1,852 $1,500 Total relocation budget $70,607 $5,000 $25,900 $2,500
SUMMARY
Internship and co-op hiring is intimately tied to the college hiring market as a whole. Key metrics explored in this report, however, suggest a troubling pattern of stagnation. Intern hiring has decreased for the third year in a row, and the percentage of interns accepting offers of full-time employment has steadily declined over the past three years. Adjusting for inflation, compensation rates for interns have remained unchanged since the recession, although it is unclear precisely why this is. Are employers compelled by economic circumstances to not increase salaries for interns, or are they choosing to do so for other unknown intra-organizational reasons? In either case the coinciding of static compensation figures and declining acceptance rates suggests that intern hiring—and thus, the college labor market as a whole—is still struggling to recover in the post-recession period.
Multi-year data from NACE’s Student Survey Report further support this argument by showing that interns who participate in paid internships are more likely to accept offers for full-time positions at the same organization. Careful examination will be taken in subsequent reports to offer further insight into the movement of internship hiring, and in turn, the future of the college labor market as a whole.
APPENDIX
SURVEY RESPONDENTS
Of the 264 participants in the survey, 202 agreed to be identified. The following is a list of those participants:
AbbVie
Advanced Micro Devices, Inc. Aerojet Rocketdyne Agilent Technologies, Inc. AIG
Air Products & Chemicals Inc. Allscripts
American Axle &
Manufacturing Holdings, Inc.
American Red Cross AmeriHealth Mercy Family
of Companies Anheuser-Busch
Companies, Inc. Applied Materials Inc. ArcelorMittal USA Armstrong Backus &
Co. LLP
Ascend Performance Materials
Aspen Technology Inc. Avery Dennison
Corporation Barclays
Barilla America Inc.
BASF Corporation Bates White, LLC Baxter Healthcare Corporation BBVA Compass Belk
Booz Allen Hamilton Inc. BP America Brocade Communications Systems, Inc. BuhlerPrince Inc. Calpine Corporation Cameron Cardinal Health CDM Smith CGI Federal CH2M HILL Chesapeake Energy Corporation Chevron Corporation Ciena Corporation Collective Brands (Payless
ShoeSource) Comcast Corporation Compass Group North
America
ConAgra Foods, Inc.
ConocoPhillips Continental AG COUNTRY Financial Covance Inc. Cree, Inc. Crestron Electronics Delphi Automotive Systems, LLC
Dick’s Sporting Goods Discover Financial Services Disney Worldwide Services Dover Corporation
Duke Energy Corporation dunnhumbyUSA DuPont Dynamics Research Corporation Dynetics Inc. EchoStar Ecolab Inc. Edward Jones
ENERCON Services, Inc. Entergy Services, Inc. Ernst & Young LLP Evonik Degussa
Corporation Excella Consulting
Exelon Corporation Express Scripts, Inc. Exxon Mobil Corporation Forrester Construction
Company
Foster Care to Success: America’s College Fund for Foster Youth
Fujitsu America Inc. GAF Corporation Gannett Co., Inc. GAP Inc.
Garmin International Inc. General Dynamics C4
Systems
General Mills Inc. Genzyme Corporation Georgia Tech Research
Institute
Gilead Sciences, Inc. GuideStone Financial
Resources HCA Healthcare Henkels & McCoy, Inc. Herbert, Rowland &
Grubic, Inc.
Hewlett-Packard Company Honda R&D Americas, Inc.
Hormel Foods Corporation Huntington Ingalls Industries Illumina INC Research INEOS Infineum USA L.P. Ingersoll-Rand Company Intel Corporation Invensys Inc. Jeremiah Program Kellogg Company Kennedy & Coe LLC KeyBank
Kinze Manufacturing, Inc. L-3 Communications
Integrated Systems Lake Shore Cryotronics, Inc. Lam Research Corporation Lend Lease Inc.
Liberty Mutual Insurance Company
Linbeck Corporation Longview Fibre Paper and
Packaging, Inc. Lord Corporation LSI Corporation
Lutron Electronics Co. Inc. Macy’s, Inc.
Marsh Inc. Mattress Firm Maximus
McKesson Corporation Medline Industries, Inc. Meijer, Inc.
Mercer
Merck & Co., Inc. Meritor Inc.
Messer Construction Co. Moen Incorporated Mondeléz International Motorola Mobility Motorola Solutions, Inc. MTS Systems Corp. NASA - Johnson Space
Center Nationwide NetApp Newfield Exploration Company Nexen, Inc. Niagara Bottling, LLC NiSource Northeast Utilities Northrop Grumman Corporation
Northwest Farm Credit Services
Pacific Gas and Electric Company
Pariveda Solutions Inc. Parsons Corporation PETCO
PlastiComp, Inc. Polaris Industries, Inc. PPL Corporation Press Ganey
Associates, Inc. PrimeSource Building
Products, Inc. Procter & Gamble Co.
Progressive Insurance Protiviti Inc. QLogic Corporation Quicken Loans QVC Inc. Riverhead Resources Rogers Corporation Rosetta Rosetta Resources Ross Stores Inc. Saks Fifth Avenue Sandia National
Laboratories
Savannah River Nuclear Solutions
Seagate Technology
Sears Holdings Corporation Shaw Industries, Inc. Shawmut Design and
Construction Skanska USA Inc. SKF USA
Southwest Airlines Co. Speedway LLC
State Farm Insurance Cos. State Street Corporation Strattec Security
Corporation Sunbelt Rentals SWIFT
T. Rowe Price Associates Tata Consultancy Services TechSmith Corporation Teradata Corporation Texas Instruments Incorporated
The Bank of New York Mellon Corporation The Field Museum The Lubrizol Corporation The Schwan Food
Company
The Timken Company Tindall Corporation TMK Ipsco Towers Watson TTX Company Turner Construction Company U.S. Air Force
U.S. Comptroller of the Currency
U.S. Department of State Union Bank
Union Pacific Railroad Company
United Launch Alliance Valero Energy Corporation Verizon W.W. Grainger, Inc. Walmart eCommerce WellPoint, Inc. Woolpert LLP WPX Energy Zachry Zipcar
62 HIGHLAND AVENUE • BETHLEHEM, PA 18017-9085 610.868.1421