Edited by Arild Angelsen
Moving Ahead with REDD
Issues, Options and Implications
Angelsen, A. (ed.) 2008 Moving ahead with REDD: Issues, options and implications. CIFOR, Bogor, Indonesia.
Photo credits: Book cover, Chapter 3, 7 & 8: Ryan Woo, Chapter 1 & 4: Brian Belcher, Chapter 2: Herwasono Soedjito, Chapter 5: Christophe Kuhn, Chapter 6: Markku Kanninen, Chapter 9: Carol J.P. Colfer, Chapter 10: Agung Prasetyo, Chapter 11: Edmond Dounias.
Printed by SUBUR Printing, Indonesia 156p.
ISBN 978-979-1412-76-6
Published by Center for International Forestry Research Jl. CIFOR, Situ Gede,
Bogor Barat 16115, Indonesia
Tel.: +62 (251) 8622-622; Fax: +62 (251) 8622-100 E-mail: [email protected]
Web site: http://www.cifor.cgiar.org
© by CIFOR All rights reserved. Published in 2008
Center for International Forestry Research (CIFOR)
CIFOR advances human wellbeing, environmental conservation, and equity by conducting research to inform policies and practices that affect forests in developing countries. CIFOR is one of 15 centres within the Consultative Group on International Agricultural Research (CGIAR). CIFOR’s headquarters are in Bogor, Indonesia. It also has offices in Asia, Africa and South America. CIFOR works in over 30 countries worldwide and has links with researchers in 50 international, regional and national organisations.
9.1 Introduction
In 2001, at the seventh Conference of the Parties (COP) of the United Nations Framework Convention on Climate Change (UNFCCC) in Marrakech, policy makers decided to exclude carbon offsets from most land use, land-use change and forestry (LULUCF) carbon sinks in developing countries for a number of reasons, including the difficulties in measuring, reporting and verifying (MRV) the actual reductions. Since then, considerable progress has been made in technology development and assessment protocols to allay many of the methodological concerns expressed during the negotiations. There have been two revisions to the Intergovernmental Panel on Climate Change (IPCC) Greenhouse Gas Accounting Guidelines (Penman et al. 2003; IPCC 2006), which include project-level accounting guidelines. Several other research and development groups have also been working on the problems and moved forwards with pilot and demonstration projects. These groups have made important advances in the application of remote sensing technologies.
How can we monitor, report and
verify carbon emissions from forests?
Sheila Wertz-Kanounnikoff and Louis V. VerchotWith Markku Kanninen and Daniel Murdiyarso
Chapter 9
This chapter addresses the issue of MRV for reducing emissions from deforestation and degradation in developing countries (REDD) activities. We provide a summary of the state of the art and science of carbon MRV. Our aim is to show that many of the methodological concerns expressed in 2001 no longer constrain these types of projects. We believe that with the progress that has been made in the past seven years, a new policy environment that is more favourable to REDD projects will promote further innovation to increase the feasibility of projects that reduce a significant source of greenhouse gases to the atmosphere.
9.2 Trade-off between costs and accuracy
Different methods are available and suitable for monitoring deforestation, forest degradation and carbon stocks. Deforestation monitoring can rely on remote sensing technology with ground measurements for verification. Monitoring forest degradation and carbon stocks is more challenging, and largely relies on ground measurements, complemented by remote sensing.
Still, there is a trade-off between costs and accuracy of measurements. Measurement accuracy is crucial to ensure that emissions reductions are not over- or underestimated and payments for the reduction efforts are made appropriately. In some country contexts high accuracy levels require the use of fine-resolution imagery (e.g. to detect forest degradation or small-scale deforestation), imagery repeated over time (e.g. to overcome cloud cover limitations) or imagery that requires higher expertise to process (e.g. radar image analysis) – all of which come at a cost. Similarly, ground measurements, crucial for verification and carbon stock measurement, are time consuming and relatively expensive for large-scale applications such as a national-level inventory (Korhonen et al. 2006).
The cost vs. accuracy trade-off is all the more important as countries that need costly monitoring methods (due to clouds, hilly terrain or their drivers of deforestation or degradation) tend to correlate with those currently having low capacity to meet these needs. The recognition of this trade-off has led most parties to the UNFCCC to call for guidance from the international community on cost-effective methods to monitor, report and verify emission reductions from deforestation and forest degradation.
Official guidelines for REDD MRV are yet to be established. The 2003 Good Practice Guidelines for Land Use, Land-Use Change and Forestry (GPG-LULUCF) activities and 2006 Guidelines for National Greenhouse Gas Inventories for Agriculture, Forestry and Other Land Use (GL-AFOLU) – both developed by the IPCC – are important first steps, but need further elaboration on methods to estimate emissions from forestry, notably regarding
89
Chapter 9 How can we monitor, report and verify carbon emissions from forests?
sampling design and determining carbon densities in forests affected by degradation (UNFCCC 2008b). The adhoc REDD working group called the Global Observation of Forest and Land Cover Dynamics (GOFC-GOLD) undertook a first step to fill this vacuum. They are developing a sourcebook providing a consensus perspective from the global earth observation community and carbon experts on methodological issues relating to national-level REDD activities (GOFC-GOLD 2008).
9.3 Elements of a measurement and
monitoring system
Due to the trade-off between costs and accuracy, the quest for cost-effective solutions is at the centre of the MRV debate. A cost-effective monitoring and evaluation system for REDD requires a balanced approach of remote sensing and ground measurements. The imagery aids in the design of efficient ground sampling schemes (e.g. in areas with high variability), assessment of area change (with ground truthing) and extrapolation of plot measurements to the regional or national level. Ground measurements are required for carbon measurements and to verify desktop forest mapping from satellite images.
Carbon emissions from deforestation and degradation are estimated from changes in two important variables: (i) area of deforestation and degradation; and (ii) carbon stock densities per unit area. Remote sensing technologies combined with ground measurements play a key role in monitoring these variables.
9.3.1 Monitoring deforestation areas
Remote sensing is the only practical method for national-level deforestation monitoring (DeFries et al. 2006). Since the early 1990s, changes in forest area have been monitored from space with confidence (Achard et al. 2008). Some countries (e.g. Brazil and India) have had well-established operational systems for over a decade; others are developing these capabilities or have successfully monitored forests with aerial photographs that do not require sophisticated data analysis or computer resources (DeFries et al. 2006).
The two most common approaches are wall-to-wall mapping and sampling. Wall-to-wall mapping, whereby the entire country or forest area is monitored, is a common approach and is conducted in both Brazil and India. Sampling approaches are useful to reduce the costs of data and analysis, and are especially suitable when deforestation is concentrated in discreet areas of a country or region. Recommended sampling approaches include systematic sampling,whereby samples are taken at regular intervals (e.g. every 10 km),
and stratified sampling, whereby samples are determined by known proxy variables (e.g. deforestation hotspots) (Achard et al. 2008). Expert knowledge can also help determine sample priorities (DeFries et al. 2006). A stratified sampling approach, used for example in the Brazilian Project to Monitor the Brazilian Amazonian Rainforest (Projeto Monitoramento da Floresta Amazônica Brasileira por Satélite - PRODES) identifies ‘critical areas’ based on the previous year’s monitoring to prioritise analysis for the following year (INPE 2004).
One approach does not exclude the other: a sampling approach in one reporting period may be extended to wall-to-wall coverage in the subsequent period. Likewise, wall-to-wall mapping in one reporting period may be followed by hotspot analysis (stratified sampling) in the subsequent period.
One way to reduce costs is through a stepwise approach. In a first step, coarse resolution data (e.g. MODIS) is analysed to identify locations with high rates of land use change (deforestation hotspots). In a second step, more costly medium-fine resolution data (e.g. Landsat, SPOT, SAR) is used to conduct detailed analysis of these hotspots. This approach reduces the need to analyse the entire forested area within a country. Hansen et al. (2008) for example employed this methodology at global level to compute rates of humid tropical forest clearings between 2000 and 2005.
Reporting accuracy and verification of results are essential components of a monitoring system. Accuracies of 80-95% are achievable for monitoring with medium-resolution imagery (e.g. Landsat) to discriminate between forests and non-forests. Accuracy can be assessed through ground observations or analysis of fine resolution aircraft or satellite imaging. Aerial photography presents a good tool for verification as fine-resolution imagery remains expensive. Another source of free viewable data can be the fine-resolution imagery (up to 50 cm resolution) from Google Earth, which – where available – provides continuously updated data (Olander et al. 2008).1
9.3.2 Monitoring forest degradation areas
Forest degradation is caused by a variety of factors that affect monitoring requirements (Table 9.1; also see Chapter 10 on degradation). Repeated monitoring is needed to ensure all forest changes are accounted for and attributable to a particular time period. Requiring the use of remote sensing to stratify the land area in order to select the area for ground measurement has been proposed to overcome the challenges associated with the lack of a clear definition for forest degradation.
1 Although the imagery cannot be fully imported into image processing packages, it has great potential for map validation in some areas by combining visual interpretation with Geographic Information Systems polygon and point files that can be imported and overlain in Google Earth (Olander et al. 2008).
91
Chapter 9 How can we monitor, report and verify carbon emissions from forests?
Source:Adapted from GOFC-GOLD (2008)
Table 9.1. Causes of degradation and impact on monitoring Causes of forest
degradation Monitoring feasibility
Selective logging • Remote sensing methods using medium resolution im-agery can detect gaps in the forest canopy caused by roads and log decks
• Reduction in carbon stocks can also be estimated with-out satellite imagery using methods from the 2006 IPCC GL-AFOLU, although it likely is more difficult to estimate emissions from logging
Forest fires • More difficult to monitor with existing satellite imagery, but possible to build on existing fire information for REDD uses
Over-exploitation of fuel wood and other non-timber forest products
• Likely to be undetectable from satellite image interpreta-tion unless the rate of degradainterpreta-tion is intensive, causing larger changes in the canopy
• Inventory-based approaches (field surveys) may be more appropriate
Mining • Difficult to monitor as forest openings are often too small to be detected
Monitoring methods based on remote sensing may be appropriate when degradation leads to detectable gaps in the forest canopy such as is typically the case for selective logging or fire. Neverthless, ground measurements are important complements especially when degradation does not create gaps in the canopy such as in the case of collection of deadwood and understorey vegetation (Hardcastle et al. 2008).
Two main remote sensing approaches to monitor forest degradation are currently distinguished (Achard et al. 2008): a direct approach that detects gaps in forest canopies and an indirect approachthat detects road networks and log decks.
• Direct approach to monitor selective logging and fire: Methods based
on this approach monitor forest canopy for any gaps or pattern of gaps to identify degradation activity.2 For example, Asner et al. (2005) developed
automated algorithms to identify logging activity using Landsat data. Roy
et al. (2005) developed a methodology to map fire-affected areas using MODIS data. An accuracy of 86-95% has been shown to be achievable in the interpretation of selectively logged and burned areas (Achard et al. 2008).
• Indirect approach to monitor forest degradation:This approach classifies forest land into ‘intact forest’ (fully stocked, undisturbed forest) and ‘non-intact forest’ (not fully stocked, disturbed forests due to timber exploitation or canopy degradation) based on a combination of canopy cover and human impact criteria that can be defined depending on national circumstances (Mollicone et al. 2007; Achard et al. 2008).3 Forest degradation is defined
as conversion of intact to non-intact forest.
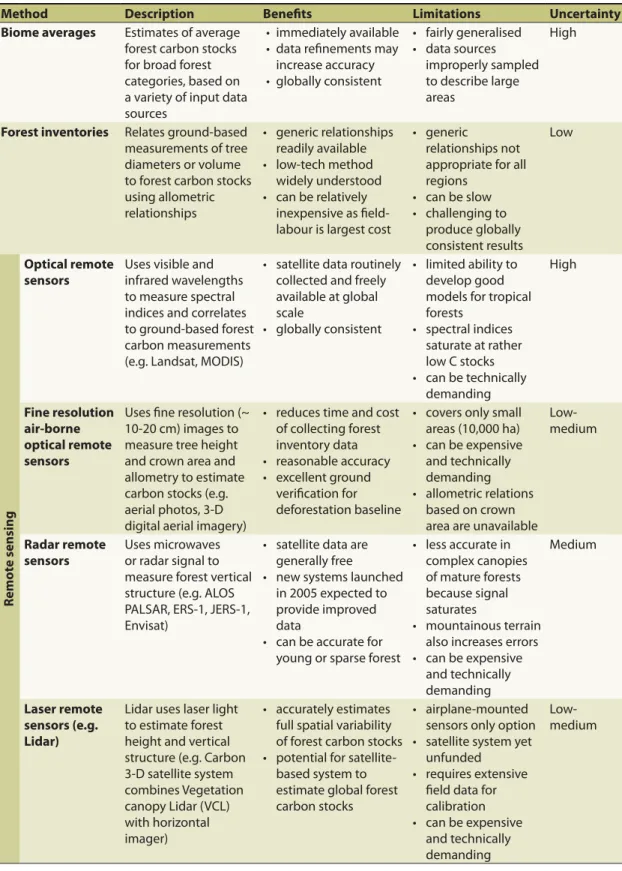
9.3.3 Estimating forest carbon stocks
Carbon stock estimates are necessary to determine net forest emissions, and are derived by combining the area extent of deforestation or forest degradation with carbon density measurements. Approaches to estimate forest carbon stocks in tropical countries can be grouped into biome averages, ground-based measurements and remote sensing measurements (Gibbs et al. 2007). Table 9.2 summarises the benefits and limitations for each method.
Converting forest inventory and remotely sensed data into carbon measures requires the development of allometric relationships. Several global relationships exist (e.g. Chave 2008), but it is better to develop country-specific equations. As most countries with high forest cover have forestry research services, and the generation of allometric equations is straightforward, they should be able to develop appropriate equations.
Using data from forest inventories is often tempting because many countries have already conducted at least one inventory. But few developing countries have comprehensive national inventories, and the data often refer to forests with commercial value only (DeFries et al. 2006).
9.4 Estimating emissions from deforestation
and forest degradation
Combining measurements of changes in forest area with carbon density values enables estimation of net emissions from forest changes. The level of emissions released as a result of land use change depends not only on the forest type, but also on the specific type of change. For example, converting tropical forest to soybean, maize or rice potentially produces 60% more emissions than conversion to oil palm (Miles et al. 2008).
3 Achard et al. (2008) suggest that ‘intact forest’ be defined based on six criteria: 1) located in forestland according to current UNFCCC definition, with a 1 km buffer zone inside the forest area, 2) larger than 1000 ha with a smallest width of 1 km, 3) containing a contiguous mosaic of natural ecosystems, 4) not fragmented by infrastructure, 5) without signs of significant human transformation, and 6) without burnt lands and young tree sites adjacent to infrastructure projects.
93
Chapter 9 How can we monitor, report and verify carbon emissions from forests?
Table 9.2. Benefits and limitations of available methods to estimate national-level forest carbon stocks
Method Description Benefits Limitations Un certainty
Biome averages Estimates of average forest carbon stocks for broad forest categories, based on a variety of input data sources
• immediately available • data refinements may
increase accuracy • globally consistent • fairly generalised • data sources improperly sampled to describe large areas High
Forest inventories Relates ground-based measurements of tree diameters or volume to forest carbon stocks using allometric relationships
• generic relation ships readily available • low-tech method
widely understood • can be relatively
inexpensive as field-labour is largest cost
• generic
relationships not appropriate for all regions • can be slow • challenging to produce globally consistent results Low Remot e sensing Optical remote
sensors Uses visible and infrared wavelengths to measure spectral indices and correlates to ground-based forest carbon measurements (e.g. Landsat, MODIS)
• satellite data routinely collected and freely available at global scale
• globally consistent
• limited ability to develop good models for tropical forests • spectral indices saturate at rather low C stocks • can be technically demanding High
Fine reso lution air-borne optical remote sensors
Uses fine resolution (~ 10-20 cm) images to measure tree height and crown area and allometry to estimate carbon stocks (e.g. aerial photos, 3-D digital aerial imagery)
• reduces time and cost of collecting forest inventory data • reasonable accuracy • excellent ground verification for deforestation baseline
• covers only small areas (10,000 ha) • can be expensive and technically demanding • allometric relations based on crown area are unavailable
Low-medium
Radar remote
sensors Uses microwaves or radar signal to measure forest vertical structure (e.g. ALOS PALSAR, ERS-1, JERS-1, Envisat)
• satellite data are generally free
• new systems launched in 2005 expected to provide improved data
• can be accurate for young or sparse forest
• less accurate in complex canopies of mature forests because signal saturates • mountainous terrain also increases errors • can be expensive and technically demanding Medium Laser remote sensors (e.g. Lidar)
Lidar uses laser light to estimate forest height and vertical structure (e.g. Carbon 3-D satellite system combines Vegetation canopy Lidar (VCL) with horizontal imager) • accurately estimates full spatial variability of forest carbon stocks • potential for
satellite-based system to estimate global forest carbon stocks
• airplane-mounted sensors only option • satellite system yet
unfunded • requires extensive
field data for calibration • can be expensive and technically demanding Low-medium Source: Gibbs et al. 2007
9.4.1 Inventory approaches
The updated IPCC greenhouse gas (GHG) accounting method (IPCC 2006) includes two approaches to estimating carbon stock changes (Brown and Braatz 2008; Figure 9.1): (i) the stock-based or stock-difference approach; and (ii) the process-based or gain-loss approach.
Figure 9.1. Estimating carbon stock changes (Wertz-Kanounnikof 2008, adapted from Eggleston 2008, and Brown and Braatz 2008)
1) Stock-difference approach 2) Gain-loss approach
C = (Ct2 - Ct1) / (t2 - t1) C = Cgain - Closs
C = Anual carbon stock change in pool (tC/yr)
Ct1 = Carbon stock in pool at time t1 (tC) Ct2 = Carbon stock in pool at time t2 (tC)
C = Anual carbon stock change in pool (tC/yr)
Cgain = Anual gain in carbon (tC/yr) Closs = Anual loss in carbon (tC/yr)
Land use type C uptake via gr owt h Disturbance Harvest Carbon stock in year 1 Where Where Carbon stock in year 2
• Stock-difference approach: This method estimates the difference in carbon
stocks in a particular pool at two moments in time. It can be used when carbon stocks in relevant pools have been measured and estimated over time, such as in national forest inventories. This approach is suitable for estimating emissions caused by both deforestation and degradation, and it can be applied to all carbon pools.
• Gain-loss approach: This approach estimates the net balance of additions
to and removals from a carbon pool. In the REDD context, depending on how ecosystem rehabilitation is treated, gains result from growth and carbon transfer between pools (e.g. biomass pool to a dead organic matter pool due to disturbance). Hence, losses result from carbon transfer to another pool and emissions due to harvesting, decomposition or burning.4
4 When trees are cut down, there are three destinations for the stored carbon: dead wood, wood products and the atmosphere (Pearson et al. 2008).
95
Chapter 9 How can we monitor, report and verify carbon emissions from forests?
This method is used when annual data on information such as growth rates and wood harvest are available. In reality, a mix of the stock-difference and gain-loss approach can also be used.
9.4.2 Inventory complexity
IPCC methods allow for inventories with different levels of complexity, called Tiers. In general, inventories using higher tiers have improved accuracy and reduced uncertainty. There is a trade-off, however, as the complexity and resources required for conducting inventories also increase for higher tiers. A combination of tiers can be used, e.g. Tier 2 can be used for biomass and Tier 1 for soil carbon, depending on data availability and the magnitude of expected changes in the pool.
Tier 1methods are designed to be simple to use. The IPCC guideline provides equations and default parameter values (e.g. emission and stock change factors), so the inventory compiler does not need specific data for these elements of the equations. Country-specific land use and management data are needed, but for Tier 1 there are often globally available sources for these estimates (e.g. deforestation rates, agricultural production statistics, global land cover maps, fertiliser use, livestock population data). The Tier 1 method alone, however, is unlikely to be sufficient for crediting under REDD.
Tier 2uses the same methodological approach as Tier 1, but the emission and stock change factors are based on country or region-specific data. Country-defined emission factors are more appropriate for the climatic regions and land use systems in the country or region. Higher temporal and spatial resolution, and more disaggregated land use and management categories are used in Tier 2 to correspond with country-defined coefficients for specific regions and specialised land use categories.
For Tier 3, higher order methods are used, including models and inventory measurement systems tailored to address unique national circumstances. Assessments are repeated over time and employ high-resolution land use and management data, which are generally disaggregated at subnational level. These inventories use advanced measurements and/or modelling systems to improve the estimation of GHG emissions and removals beyond what is possible with Tier 1 or 2 approaches.
9.5 Integration of MRV methods into a REDD
mechanism
While there has been significant progress on the technical aspects of carbon accounting, many developing countries lack access to data, as well as the technical infrastructure and capacity for consistent, transparent data analysis and management. In addition, MRV for REDD requires forest inventory institutions for ground-based measurements, quality control and external verification. In the early stages of any REDD scheme, most countries will likely use a stock-difference method. As capacity is built, however, greater efficiency may come from emission-based (gain-loss) approaches since they allow for direct measurement of net changes in emissions. It is also highly likely that many countries can only implement a Tier 1 accounting scheme in the early stages. In these cases, conservative estimates of emissions reductions may be used for crediting (Eliasch 2008).
At COP 15 in Copenhagen in 2009, the global community may only agree on a first round REDD scheme and set developing country responsibilities (Stern 2008). A build up period of, say, 10 years may be needed to build effective and cooperative institutions, technology, and national capacity for cost-efficient monitoring and measuring at various scales (local to national). During this phase, countries that have limited abilities to implement higher Tier accounting could participate using Tier 1 approaches coupled with conservative estimates for crediting. Capacity building programmes by countries who can implement Tier 2 and 3 inventories are needed to raise the technical level of other participants. The ultimate trajectory of a REDD scheme, and how it will be integrated into any future climate regimes, remains unclear. If REDD becomes integrated into carbon markets, higher levels of accounting accuracy will be required because international buyers will want assurance that real emissions reductions have actually occurred. From a policy standpoint, one objective may be to create a favourable environment that promotes evolution towards higher Tier accounting approaches with greater accuracy and lower uncertainty. Such a transition phase is crucial for countries with currently weak MRV structures to avoid the risk of being excluded from a high standard mechanism, while giving them opportunity to improve their MRV methods and structures. Establishing an independent international forest carbon monitoring institution for REDD or developing this capacity in an existing institution may be another way to overcome capacity shortcomings. This institution is not meant to replace the UNFCCC’s framework for MRV, but to build synergies in addressing REDD monitoring requirements. Central African Forest Commission countries, for example, are establishing a regional institution called the Central African Forest Watchdog. Monitoring for carbon crediting purposes needs to be accurate, objective and reliable. Leaving this task to each REDD supplier
97
Chapter 9 How can we monitor, report and verify carbon emissions from forests?
country may create an incentive for biased monitoring (e.g. exaggerated emission reductions) to reap carbon benefits. This system of external validation provides a level of control against abuses, but it adds transaction costs as well. Independent third party monitoring and certification, in the form of an international forest carbon monitoring institution, may therefore be a better alternative. Centralising this task at the global level can enhance economies of scale and improve monitoring cost-effectiveness – compared with trying to ensure coherent monitoring by each country – and provide more coherent time-series of deforestation data for baseline purposes. It has been estimated that a regional monitoring partnership among Cameroon, Democratic Republic of the Congo, Republic of the Congo, Equatorial Guinea and Gabon in Central Africa could save more than USD 2.2 million in setup costs in the first year, and more than USD 0.5 million in annual running costs (Hardcastle et al. 2008). Capacity consists not only of the availability of technical equipment or costly satellite imagery, but also – and often more importantly – of know-how. This refers to the expertise in data cleaning, processing and analysis, and the use of data in the political process. The latter implies that capacity building needs to occur not only at the technical level (i.e. in the forest monitoring agency), but also at the political and institutional levels. For example, policy-makers need to have at least a minimum understanding of how changes in forest carbon affect the national REDD arrangements, and how this will relate to other sectoral policies. Another constraint to monitoring emissions from deforestation and degradation is the limited knowledge of carbon stocks contained in alternative forest types and forest uses. To address this, Costa Rica, for example, advocates the introduction of a ‘conservativeness principle’ to reduce the risk of overestimation (see Appendix). This might take the form of countries being paid at the lower end of the 95% confidence interval. Although default data and IPCC guidelines exist to ensure the use of ‘conservative’ estimates, further effort is needed in spatially explicit forest carbon stock inventories. Lidar sensors are particularly promising for future forest carbon stock measurements. Given the rising monitoring needs for REDD and the huge potential of Lidar sensors to improve biomass estimates, the Earth Observation community should consider deploying such a platform in the near future. New investments could also focus on promoting operational research for future Lidar-based biomass monitoring at the global level.
Because of limited availability of large-scale Lidar imagery until at least 2015-2017, efforts need to be dedicated to making maximum use of currently available alternatives (e.g. ground-based measurements, Geographic Information Systems models to extrapolate sample data). Priority activities should include the establishment of allometric relationships for different forest types and management regimes. The conclusions from a recent UNFCCC expert meeting on MRV for degradation recognised that important data and
knowledge gaps exist. The experts recommended getting on with the job of making MRV schemes workable and cost effective using existing technology, rather than delaying actions waiting for improved technology (UNFCCC 2008b).
9.6 Conclusion
We set out to demonstrate that the state of the art and science of carbon accounting should not be a constraint on incorporating REDD into future climate change regimes. We have presented a summary of recent advances in IPCC GHG accounting methods and new technological advances to improve the quality of data used in these methods. We have also pointed out remaining limitations and opportunities for overcoming them.
Given the recent advances outlined in this paper, we believe that viable REDD measurement and validation systems can be implemented. We realise that the capacity to implement these systems across major forested countries is uneven. A policy environment that encourages innovation to improve efficiency and provides capacity building support will contribute to making REDD an important element in combating climate change. A phased approach to allow for capacity building and to let countries gain experience, with eventual integration of the REDD mechanism into credit trading schemes or other elements of a future climate regime, will ensure sustainability of the reduced emissions.
For the debate on REDD MRV to move forward, the UNFCCC COP-14 in Poznan will need to clarify (i) how forest degradation will be integrated into a future REDD scheme; (ii) who will monitor national and subnational REDD activity (whether this is a national or international responsibility); and (iii) what will be the base period or year for determining historic trends. In the preparation of a future REDD scheme, countries could further benefit from clear rules and guidelines, such as official ‘good practice guidelines for REDD’.