Advanced Error Detection
Techniques
Newbury, Berkshire RG14 1QN UK
http://www.microfocus.com
Copyright © Micro Focus 2001-2012. All rights reserved.
MICRO FOCUS, the Micro Focus logo and Visual COBOL are trademarks or registered trademarks of Micro Focus IP Development Limited or its subsidiaries or affiliated companies in the United States, United Kingdom and other countries.
Preface . . . 7
Who Should Read This Manual . . . 7
What This Manual Covers . . . 7
Conventions Used In This Manual . . . 8
Getting Help . . . 8
Contact . . . 9
Chapter 1 · Workflow and Configuration Settings . . . 11
DevPartner Error Detection Workflow . . . 11
Benefits of the DevPartner Error Detection Workflow . . . 12
Saving Error Detection Configurations . . . 12
Using Error Detection from the Command Line . . . 12
Compiling, Instrumenting, and Building Unmanaged (Native) C++ Projects with NMDE-VENV . . . 14
Instrumenting Native C/C++ Code with nmvcbuild . . . 14
Customizing the DevPartner Error Detection Settings . . . 15
General . . . 16
Data Collection . . . 16
API Call Reporting . . . 17
Call Validation . . . 17
COM Call Reporting . . . 17
COM Object Tracking . . . 17
Deadlock Analysis . . . 18
Memory Tracking . . . 18
.NET Call Reporting . . . 19
.NET Analysis . . . 19
Resource Tracking . . . 20
Modules and Files . . . 20
Fonts and Colors . . . 20
Configuration File Management . . . 20
Chapter 2 · Checking and Analyzing Programs . . . 23
Error Detection Tasks . . . 23
Finding Leaks . . . 23
Finding Pointer and Memory Errors . . . 23
Finding Memory Corruption . . . 24
Analyzing Transitions to Legacy Code in .NET Applications . . . 24
Validating Win32 API Calls . . . 25
Searching for Application Deadlocks . . . 26
Expanded Uses for DevPartner Error Detection . . . 26
Chapter 3 · Analyzing Complex Applications . . . 33
About Complex Applications . . . 33
Wait for Process . . . 34
Analyzing Limited Parts of Your Program . . . 34
Using Modules and Files Settings . . . 36
Deciding What to Monitor . . . 38
How Does an Application Start Up? . . . 39
Analyzing Services . . . 39
Requirements and Guidelines . . . 39
Analyzing a Service . . . 40
Timing Problems and dwWait . . . 40
Alternate Method: Separating Control Logic from the Worker Thread . . . 40
Custom Code to Turn the DevPartner Error Detection Log On and Off . . . 40
Common Service-related Issues . . . 40
Analyzing ActiveX Controls Using the Test Container . . . 41
Common Test Container Issues . . . 42
Analyzing Applications That Use COM . . . 43
Common COM Issues . . . 44
Analyzing ISAPI Filters Under IIS 5.0 . . . 45
Common ISAPI Filter Issues . . . 46
Analyzing ISAPI Filters under IIS 6.0 . . . 46
IIS 5.0 Isolation Mode . . . 47
IIS 6.0 Default Configuration . . . 48
Common IIS 6.0 ISAPI Filter Issues . . . 48
Frequently Asked Questions . . . 49
Chapter 4 · Working with User-Written Allocators . . . 51
Introduction . . . 51
Gathering Necessary Information . . . 51
Finding the Names of User-Written Allocators . . . 51
Special Assumptions Made By User-Written Allocators about Memory . . . 53
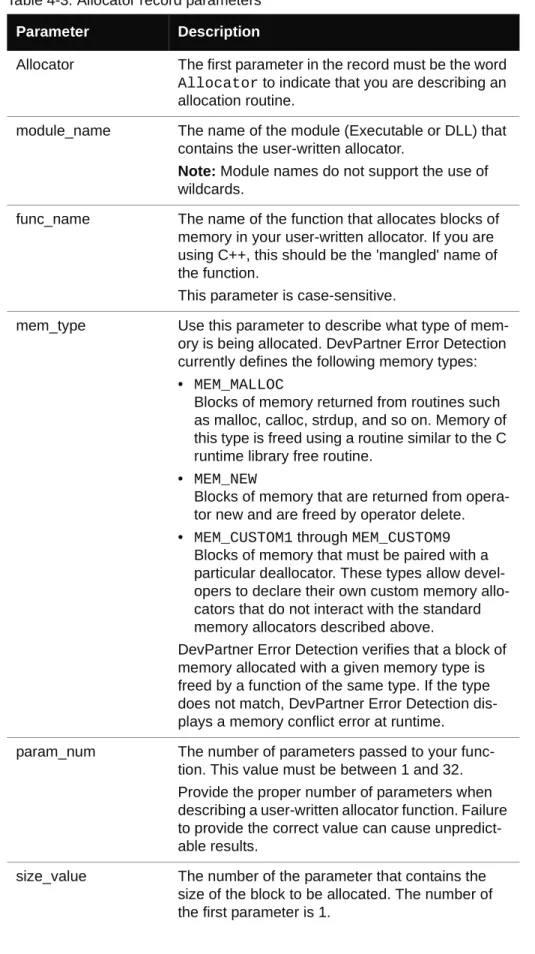
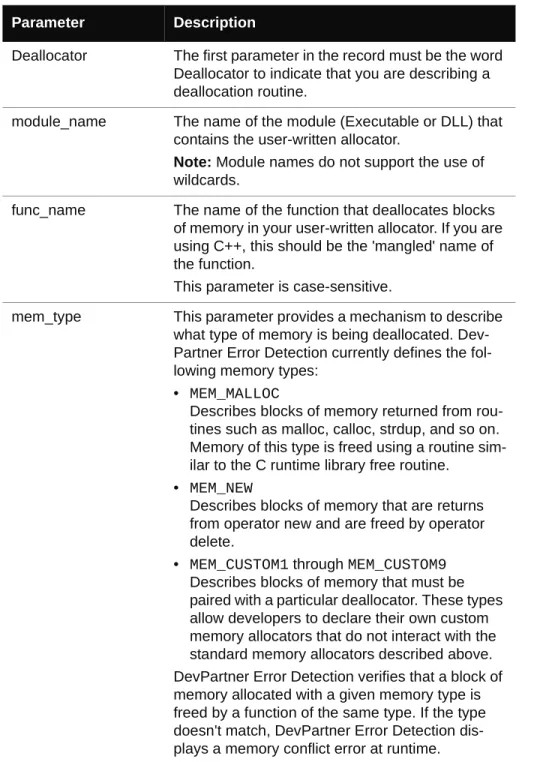
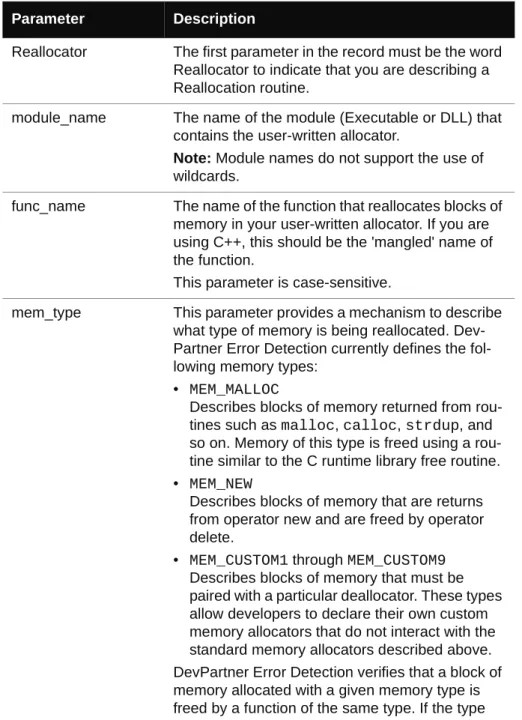
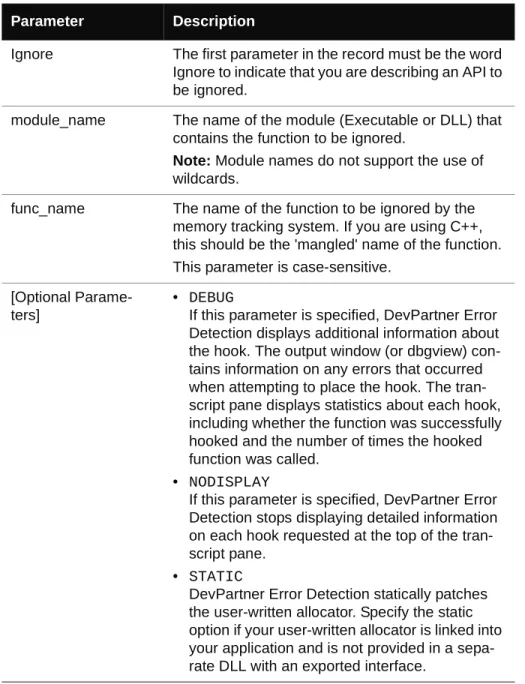
Creating Entries in UserAllocators.dat . . . 54
Modules . . . 54 Allocator Records . . . 55 Deallocator Records . . . 59 QuerySize Records . . . 61 Reallocator Records . . . 64 Ignore Records . . . 67
Coding UserAllocator Hook Requests . . . 69
Code Requirements for UserAllocators . . . 70
Allocator Function Hooks . . . 70
Deallocator Function Hooks . . . 71
Reallocator Function Hooks . . . 71
Debugging UserAllocator Hooks . . . 72
Semantic Errors . . . 73
If Your Application becomes Unstable after Changing UserAllocators.dat . . . 73
Chapter 5 · Deadlock Analysis . . . 75
Background: Single and Multi-threaded Applications . . . 75
Threads . . . 75
Critical Sections . . . 76
Deadlock - A Basic Definition . . . 76
Techniques for Avoiding Deadlocks . . . 77
Potential Deadlocks . . . 77
The Dining Philosophers . . . 78
Monitoring Synchronization Objects . . . 79
Other Synchronization Objects . . . 79
Additional Information . . . 80
MSDN References . . . 80
Other References . . . 81
Appendix A · Troubleshooting Error Detection . . . 83
Troubleshooting . . . 83
Appendix B · Important Error Detection Files . . . 93
Files and Their Purpose . . . 93
This manual describes concepts and procedures to help you understand in-depth use of Micro Focus® DevPartner Error Detection.
Who Should Read This Manual
This manual is intended for new DevPartner Error Detection users and for users of previous versions of DevPartner Error Detection who want an overview of new functions and interface changes.
New users should read the error detection chapter in Understanding DevPartner Studio to get an overview of DevPartner Error Detection concepts and then use this document to learn how to use DevPartner Error Detection most effectively.
Users of previous versions of DevPartner studio should read the Release Notes to see how DevPartner Error Detection differs from BoundsChecker, the error detection tool included with previous versions.
This manual assumes that you are familiar with the Windows interface and with software development concepts.
What This Manual Covers
This manual contains the following chapters and appendixes:
⽧ Chapter 1, Workflow and Configuration Settings, explains how to configure DevPartner
Error Detection to solve various problems, ranging from simple API call validation to problems encountered in complex COM applications.
⽧ Chapter 2, Checking and Analyzing Programs, describes error detection tasks you can
perform with DevPartner Error Detection and other tasks, beyond error detection.
⽧ Chapter 3, Analyzing Complex Applications, provides information to help you use
Dev-Partner Error Detection more effectively when checking complex applications.
⽧ Chapter 4,Working with User-Written Allocators, explains how to customize the User-Allocators.dat file so you can analyze your own memory allocators.
⽧ Chapter 5,Deadlock Analysis, explains deadlocks, potential deadlocks, and
synchroniza-tion objects. It also lists Web addresses and books that provide more informasynchroniza-tion on these topics.
⽧ Appendix A,Troubleshooting Error Detection, provides answers to some of the most
⽧ Appendix B,Important Error Detection Files, provides a list of the important files
asso-ciated with DevPartner Error Detection, and describes each file’s purpose. You will also find an index at the back of this manual.
Note: This manual contains information for all of the Visual Studio versions of DevPartner Studio. Notes throughout the text identify features that are avail-able only for a specific release of Visual Studio.
Conventions Used In This Manual
This book uses the following conventions to present information.
⽧ Screen commands and menu names appear in bold typeface. For example:
Choose Item Browser from the Tools menu.
⽧ Computer commands and file names appear in monospace typeface. For example: The Understanding DevPartner Error Detection manual (bc_vc.pdf) describes...
⽧ Variables within computer commands and file names (for which you must supply values
appropriate for your installation) appear in italic monospace type. For example: Enter http://servername/cgi-win/itemview.dll in the Destination field...
Getting Help
If ever you have any problems or you would like additional technical information or advice, there are several sources. In some countries, product support from Micro Focus may be avail-able only to customers who have maintenance agreements.
If you obtained this product directly from Micro Focus, contact us as described below. If you obtained it from another source, such as an authorized distributor, contact them for help first. If they are unable to help, contact us as described below.
However you contact us, please try to include the information below, if you have it. The more information you can give, the better Product Support can help you. But if you don't know all the answers, or you think some are irrelevant to your problem, please give whatever informa-tion you have.
⽧ The name, release (version), and build number of the product.
⽧ Installation information, including installed options, whether the product uses local or
net-work databases, whether it is installed in the default folders, whether it is a standalone or network installation, and whether it is a client or server installation.
⽧ Environment information, such as the operating system and release on which the product
is installed, memory, hardware/network specifications, and the names and releases of other applications that were running.
⽧ The location of the problem in the product software, and the actions taken before the
⽧ The exact product error message, if any.
⽧ The exact application, licensing, or operating system error messages, if any. ⽧ Your Micro Focus client, office, or site number, if available.
Contact
Our Web site gives up-to-date details of contact numbers and addresses. The product support pages contain considerable additional information, including the WebSync service, where you can download fixes and documentation updates. To connect, enter www.microfocus.com in your browser to go to the Micro Focus home page.
If you are a Micro Focus Product Support customer, please see your Product Support Handbook for contact information. You can download it from our Web site or order it in printed form from your sales representative. Support from Micro Focus may be available only to customers who have maintenance agreements.
Workflow and Configuration Settings
DevPartner Error Detection can identify many different types of problems. The default DevPartner Error Detection settings have been chosen to find the most common errors with the minimum impact on performance.
By changing the settings, you can fine-tune DevPartner Error Detection to search for specific types of problems. Understanding the error detection settings will enable you to use DevPart-ner Error Detection to its fullest.
This chapter describes how to configure DevPartner Error Detection to solve various
problems, ranging from simple API call validation to problems encountered in complex COM applications.
Note: Error Detection creates data files for each target application. You must ensure that you have write access to the directory containing the target executable before starting Error Detection.
DevPartner Error Detection Workflow
DevPartner Error Detection follows a program workflow that is more extensive than the workflow of earlier DevPartner Error Detection versions. This mechanism enables you to control the amount of data collected and reported.
Here are the four steps of the DevPartner Error Detection workflow: 1 Configure DevPartner Error Detection to collect the desired data
a Select the types of data you want to collect
b Define the portions of your application to be monitored c Select the Suppressions and Filters you want to apply 2 Run your application
a As the program runs, review errors presented in the Program Error Detected dialog box
b Suppress errors that are not valid
c View the log and create filters if necessary d Review memory and resource usage 3 View the data (after program termination)
a Filter out events you do not want to see in the log
b Create new suppressions to be applied to future runs of your application 4 If desired, save your settings, suppressions, and filters for future use
Benefits of the DevPartner Error Detection Workflow
The DevPartner Error Detection workflow enables you to:⽧ Select the type and amount of data to be collected ⽧ Select the portions of the application to be monitored
⽧ Suppress errors that report known issues, are handled by conditional code, or have been
generated in third-party code
⽧ Create filters to hide extraneous information in the log
⽧ Save different configurations so that settings, suppressions and filters can be reused
DevPartner Error Detection provides defaults for each step in the workflow process. This means you can use DevPartner Error Detection with default settings, or you can change the settings to customize the way that DevPartner Error Detection analyzes your application.
Saving Error Detection Configurations
You can save an error detection configuration - a specific combination of settings (standalone versions) or options (Visual Studio) - to use again.
For example, you might create a configuration for memory and resource leaks, another for COM leaks and a third to do detailed lint type analysis. You can further refine settings and define configurations that look only at particular sections of a large application.
Using Error Detection from the Command Line
Use the following command syntax to check a program with BC.exe (the executable) from the command prompt. Brackets [ ] indicate that a command is optional.
BC.exe [/?]
BC.exe sessionlog.DPbcl
BC.exe [/B sessionlog.DPbcl] [/C configfile.DPbcc] [/M] [/NOLOGO] [/X[S|D] xmlfile.xml] [/OUT errorfile.txt] [/S] [/W workingdir]
target.exe [target args]
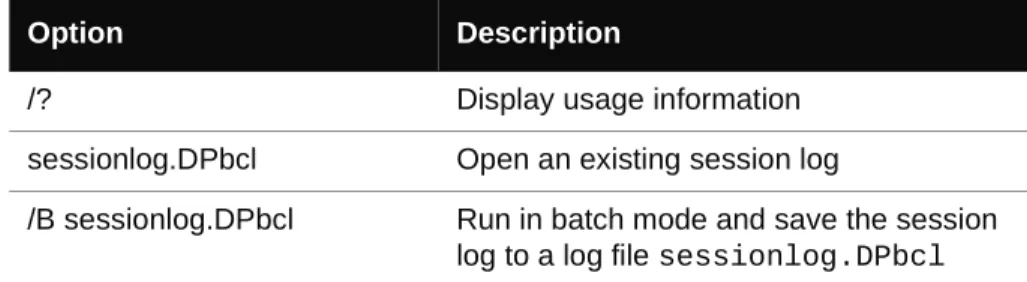
Table 1-1. Command Line options
Option Description
/? Display usage information sessionlog.DPbcl Open an existing session log
/B sessionlog.DPbcl Run in batch mode and save the session log to a log file sessionlog.DPbcl
Note: You must specify the full directory path to your program executable if it is not located on the current path (the environment variable listing the directories that the system searches in order to find an executable).
/C configfile.DPbcc Use the configfile.DPbcc options /M Start BC.exe and minimize when running /NOLOGO Do not show the splash screen when
loading BC.exe
/X xmlfile.xml Generate XML output and save to the specified file.
• When you specify an executable, Error Detection runs a session on the execut-able and then generates XML output from the results.
• When you specify a session log file only (sessionlog.DPbcl), Error Detec-tion converts the specified session log to XML and saves the output.
Note: When you specify an executable, you must still specify an corresponding session log file using the /B switch. /XS xmlfile.xml The /X flag used with the S modifier
instructs Error Detection to only save Summary data to the xml file. Information about the running of the Error Detection session (Session data) is always exported.
/XD xmlfile.xml The /X flag used with the D modifier instructs Error Detection to only save Details data to the xml file. Information about the running of the Error Detection session (Session data) is always exported.
/OUT errorfile.txt Output any error messages to a text file named errorfile.txt — this file will only contain error messages generated while trying to execute Error Detection, not the list of error and leaks discovered by Error Detection
/S Run in silent mode — do not open the Program Error Detected dialog box on errors
/W workingdirectory Set the target's working directory target.exe [target args] The executable to launch and its
argu-ments Table 1-1. Command Line options
You can specify multiple command options for one program. For example: BC.exe /B test.dpbcl /S /M c:\testdir\test.exe
Compiling, Instrumenting, and Building Unmanaged (Native) C++ Projects with
NMDEVENV
If you plan to build your unmanaged C++ project from the command line, and want to instru-ment it for performance or coverage analysis, you can use NMDEVENV from the command line. NMDEVENV lets you compile, instrument unmanaged code in a project or solution, and build the project or solution with a single command. It combines the code instrumentation and compile capability of the DevPartner NMCL command with build capability of the Visual Studio DEVENV command. NMDEVENV replaces the Visual Studio DEVENV command.
NMDEVENV uses Visual Studio instrumentation options set for the project or solution being
instrumented. The build process uses the DevPartner NMCL compiler driver instead of the standard C++ compiler driver.
Use NMDEVENV with the NMCL option to enable instrumentation, and the DEVENV /Build
or /Rebuild switch. Specify the project or solution, and whether to build with debugging.
Note that if Debug is used and you have multiple debug configurations, Debug must be in quotes and entered with a specific qualifier (for example "Debug|Win32". No DEVENV IDE switches or other switches are needed.
Prerequisites
To run NMDEVENV you must have:
⽧ DevPartner Studio 9.1.0 or later installed.
⽧ A system environment set up to run the Visual Studio tools.
⽧ NMCL.EXE and DEVENV.EXE in your path setting. By default NMCL.EXE is installed in
the following location: \Program Files\Common Files\Micro Focus\NMShared To build the debug configuration of a project with Error Detection instrumentation:
NMDEVENV /nmbcon sample.vcproj /build debug
Instrumenting Native C/C++ Code with nmvcbuild
If you plan to build your project from the command line, and want to instrument it for Error Detection, you need to use nmvcbuild.exe instead of the Microsoft vcbuild.exe compiler. The vcbuild compiler does not provide any way to replace the default compiler and linker, so there is no way to perform DevPartner native C/C++ instrumentation.
nmvcbuild.exe is a command line utility, designed specifically for DevPartner, that allows it to perform native C/C++ instrumentation for vcbuild. It functions as a wrapper for
vcbuild that watches for cl.exe and link.exe being started, and replaces them with
nmcl.exe and nmlink.exe.
The nmvcbuild utility accepts the same command line parameters as vcbuild and nmcl.
You can view the parameters for vcbuild and nmcl by entering vcbuild ? and nmcl ? at the command line. You can also embed any required parameters in the environment variable nmcl, and then you only need to pass the vcbuild parameters when you call nmvcbuild.
set nmcl=/NMignore:StdAfx.cpp
For more information, refer to nmcl Options in the online help.
Prerequisites
To run nmvcbuild.exe you must have:
⽧ DevPartner Studio installed on your system.
⽧ A system environment set up to run the Visual Studio tools.
⽧ vcbuild.exe and nmvcbuild.exe in your path setting. By default nmvcbuild.exe is installed in the following location:
\Program Files\Common Files\Micro Focus\NMShared
Note: For installs on 64-bit versions of Windows, the file is located at:
\Program Files (x86)\Common Files\Micro Focus\NMShared
Example
To build the debug configuration of the sample project with Error Detection instrumentation: nmvcbuild /nmbcon sample.vcproj debug
Customizing the DevPartner Error Detection Settings
The DevPartner Error Detection settings provide the following types of customization:
⽧ Restrict the types of information collected (e.g. memory and resource leaks)
⽧ Further refine the types of information collected in each major category of analysis (for
example, look only for resource leaks generated by graphics calls)
⽧ Determine how much additional information such as call stacks, parameter data, return
values, etc. is recorded along with the event or error
⽧ Control the look and feel of the DevPartner Error Detection user interface. This includes
changing fonts, colors, highlighting, or whether the Program Error Detected dialog box is displayed
⽧ Save and restore DevPartner Error Detection settings created previously
By customizing the DevPartner Error Detection settings, you control how much data is collected and which portions of the application are monitored.
The DevPartner Error Detection settings are divided into these groups:
⽧ General
⽧ Data Collection ⽧ API Call Reporting ⽧ Call Validation ⽧ COM Call Reporting ⽧ COM Object Tracking ⽧ Deadlock Analysis ⽧ Memory Tracking ⽧ .NET Analysis ⽧ .NET Call Reporting ⽧ Resource Tracking ⽧ Modules and Files ⽧ Fonts and Colors
⽧ Configuration File Management
General
Use the check boxes under General settings to control following:
⽧ Event logging
Note: Turning off event logging “silences” Error Detection. Error Detection will not report anything until event logging is turned on again.
⽧ The Program Error Detected dialog box - to display on each error or not.
⽧ Whether or not to display a prompt to save program results when closing Error Detection
or starting another session.
⽧ Whether or not to display the Memory Resource Viewer dialog box when the target
appli-cation exits or not
⽧ The directories to search for source and symbol files
⽧ The working directory (available only when you use DevPartner Error Detection in
stan-dalone mode)
⽧ Specify command line arguments (available only when you use DevPartner Error
Detec-tion in standalone mode)
Data Collection
Use the Data Collection settings to control the following features.
⽧ The depth of various call stacks
⽧ The amount of data to be stored for non-scalar parameters (for example, structures,
classes, and pointers) and return values
If you are working with computers that have limited memory, or if you are analyzing large complex applications, you may want to restrict the size of the Maximum call stack depth on allocation to reduce memory requirements.
API Call Reporting
Use API Call Reporting settings to control the type of Windows API calls to be logged if Enable API call reporting has been selected. You can also control the logging of Windows messages.
To reduce log file sizes, selectively enable API calls for particular Windows module (for example, select GDI32 to log graphics calls).
Call Validation
Use Call Validation settings to control whether DevPartner Error Detection validates Windows API parameter and return values. By default, DevPartner Error Detection does not validate parameters.
If you are also tracking memory usage, you can select Enable memory block checking. When you select this option, DevPartner Error Detection performs more detailed parameter analysis using the knowledge gathered from the memory tracking system. Enabling this feature will detect more errors but will affect performance.
DevPartner Error Detection includes settings that enable you to restrict the types of validations performed on the Windows APIs. These settings enable you to de-select categories of errors that can generate spurious errors. Examples include flag checks, range checks, and enumera-tion checks. Explore these openumera-tions if you want the detailed analysis of handles and pointers but are not interested in other types of validation.
DevPartner Error Detection enables you to select which Windows APIs to check. The default is to check all Windows APIs. If you are interested in a limited set of API calls, select only those modules. This can reduce the number of errors detected and improve performance.
COM Call Reporting
Use COM Call Reporting settings to control the COM interfaces that should be logged if Enable COM method call reporting on objects that are implemented in the selected modules has been selected.
By default, if Enable COM method call reporting on objects that are implemented in the selected modules is selected, DevPartner Error Detection will report on all known COM inter-faces. For improved performance, select only the COM interfaces you need to check. Use the tree view that appears under COM Call Reporting. Decreasing the number of COM interfaces checked decreases the size of the log file and improves performance.
You can also select Report COM method calls on objects implemented outside of the listed modules.
COM Object Tracking
DevPartner Error Detection can monitor COM usage within an application and will report on any code that is leaking interfaces. If an interface leak is detected, DevPartner Error Detection will provide a COM use-count graph showing every AddRef and Release within the appli-cation. The graphs can be used to quickly spot missing AddRef or Release calls based on your knowledge of the application.
By default, DevPartner Error Detection does not enable COM object tracking. Select Enable COM object tracking to activate this feature. When COM object tracking is active, you can select All COM classes or you can select individual classes from the list provided.
Deadlock Analysis
Use Deadlock Analysis to monitor multi-threaded applications for deadlocks. This includes the following types of analysis:
⽧ Monitoring and reporting of deadlocks as they occur in the application
⽧ Monitoring the usage patterns of the synchronization objects within your application for
potential deadlocks
⽧ Monitor your application for synchronization object errors
Memory Tracking
Use Memory Tracking settings to control the type of memory leak detection performed on the application. Memory Tracking is enabled by default. If you do not want to perform memory leak detection, clear Enable memory tracking.
The Memory Tracking settings have been preset to generate acceptable results for most appli-cations. The Enable FinalCheck, Guard bytes, Fill on allocation and Poison on free settings are of special note.
Enable FinalCheck
Selecting Enable FinalCheck has no effect unless your application is instrumented with FinalCheck. FinalCheck is on by default when you select Instrumenting for Error Detec-tion. To enable instrumentation without having FinalCheck run, you can disable FinalCheck in the Memory Tracking pane of the Error Detection Settings.
The recommended usage is to leave Enable FinalCheck selected and to clear it only when you want to perform a less-detailed ActiveCheck analysis on an application that is already instrumented.
Guard Bytes
Guard bytes are used to detect memory overruns in ActiveCheck analysis. If you encounter heap corruption and DevPartner Error Detection does not detect the problem, consider increas-ing the Count setting to a larger value. Refer to the online documentation for tips on using these settings to track down heap errors that are hard to find.
Fill on allocation and Poison on free
Fill on allocation sets memory to a known state when it is allocated. Poison on free sets memory to a known state when it is deallocated.
The byte patterns used have been carefully selected to cause an application to generate errors if these byte patterns are accidentally used during program execution. Refer to the online documentation for additional information on these settings.
UserAllocators.dat
If you write your own memory allocation logic or override global operator new, see Chapter 4, “Working with User-Written Allocators” and review the documentation (in the form of comments) in the following file:
C:\Program Files\Micro Focus\DevPartner Studio\BoundsChecker \Data\UserAllocators.dat
Note: For installs on 64-bit versions of Windows, the file is located at: \Program Files (x86)\Micro Focus\DevPartner
Studio\Bound-sChecker\Data\UserAllocators.dat
.NET Call Reporting
Use .NET Call Reporting settings to control .NET assemblies that should be logged if Enable .NET method call reporting has been selected.
By combining .NET and COM call reporting, you can see both sides of COM Interop.
The .NET User Assemblies and .NET System Assemblies are displayed on separate branches of a tree view control.
Note: .NET Call Reporting can generate a large amount of data, and cause system slowdowns. Enable .NET Call Reporting only when necessary to debug and understand the framework, and even then select only the assemblies you need to check. Limiting the number of assemblies selected in the All types
tree view decreases the size of the log file and improves performance.
.NET Analysis
DevPartner Error Detection supports mixed native and managed applications. If you are working in mixed environments, you can select Enable .NET runtime analysis. DevPartner Error Detection supports the following types of .NET analysis:
⽧ Monitoring of unhandled exceptions being passed from native to managed code ⽧ Analysis of .NET Finalizers
⽧ Managed to native code interoperability ⽧ Monitoring of garbage collection events
.NET Interoperability
The DevPartner Error Detection .NET Interoperability feature monitors the number of times an application transitions from managed to native code. Use this information to analyze usage patterns and target native code that could benefit from being rewritten in managed code. For best results, use this feature with the Interop reporting threshold parameter to specify your own lower limit for acceptable usage.
Resource Tracking
Use Resource Tracking settings to control the type of resource leak detection performed on the application. Resource Tracking is selected by default. If you do not want to perform resource leak detection, clear the Enable resource tracking check-box.
When resource tracking is selected, you can search for all resource leaks or limit the search to particular resources associated with specific libraries in the Windows API.
The resources have been grouped by library and within each library by the API call used to deallocate the resource. For example, if you have recently written a lot of code to manipulate the registry, you might want to de-select all libraries except ADVAPI32, then select only RegCloseKey.
Modules and Files
Use the Modules and Files settings to:
⽧ Identify executables and libraries within your application that should be monitored or
ignored
⽧ Refine the list of executables and libraries to be monitored or ignored down to the source
file level if symbols are available
⽧ Identify a list of System directories that should be ignored by the DevPartner Error
Detection analyzers
Use the Modules and Files settings to control the portions of your application that are monitored by DevPartner Error Detection. For example, you might consider using Modules and Files settings when writing large applications or applications such as ISAPI filters. Note: Disabling all the modules in the Modules and Files settings will not prevent
reporting of some error types. Error Detection always reports memory overruns within any module, and other types of events originating from the
MFCxxxx.dll libraries.
For more information, see “Using Modules and Files Settings” on page 36.
Fonts and Colors
Use the Fonts and Colors settings to change the font, color and emphasis of each item in the DevPartner Error Detection user interface.
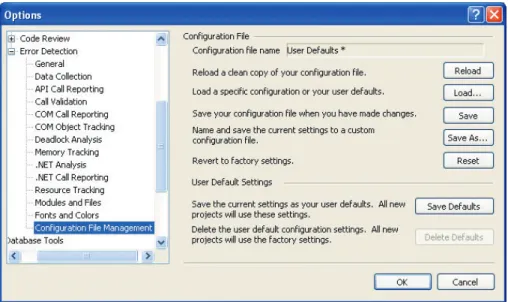
Configuration File Management
Use Configuration File Management to create multiple settings files for each project. Figure 1-1 on page 21-1 shows the Configuration File Management options available. You can then use these settings files throughout the software development cycle to perform various types of analysis. Consider these examples of settings files you might create:
⽧ Use Call Validation and Modules and Files to select only your components; use these
set-tings daily as you add new code to your application
com-⽧ Create a settings file to be used in batch mode over the weekend to analyze the results of
major milestones. You might also want to instrument the build with FinalCheck to obtain the most detailed information when you analyze the reports.
⽧ Create a settings file with various sets of modules selected but all analysis features
dis-abled. You can then load this settings file and select the options you want during an inter-active session. This may be especially useful when you need to manage complex modules and files settings.
Figure 1-1. Configuration File Management settings
Configuration File Functions
The Configuration File Management page has the following functions available:
⽧ Configuration file name: The full path and name of the configuration file.
⽧ Reload: Loads the current configuration file again, discarding any changes. This returns
you to the last saved version of the current configuration file.
⽧ Load: Opens the Load From dialog box. Select Internal User Defaults to load your user
default settings. If you select Configuration File, the Load Configuration File dialog opens. Use this to select a different configuration file to load.
⽧ Save: Saves all active changes in the currently loaded configuration file.
⽧ Save As: Opens the Save Configuration File dialog box. Use this to save the current
con-figuration settings under a different file name.
⽧ Reset: Resets all the program property settings to the default factory settings.
⽧ Save Defaults: Save the current settings as your user defaults. All new projects will use
these settings.
⽧ Delete Defaults: Delete the user default configuration settings and revert to factory
Checking and Analyzing Programs
This chapter describes some of the error detection tasks you can perform with DevPartner Error Detection. It also describes other tasks that you can perform with DevPartner Error Detection.
Error Detection Tasks
DevPartner Error Detection typically includes tasks such as:
⽧ Finding memory, resource and interface leaks ⽧ Looking for pointer and memory errors ⽧ Searching for memory corruption
⽧ Analyzing the use of legacy code in .NET applications ⽧ Validating Win32 API calls (32-bit and 64-bit versions) ⽧ Searching for application deadlocks
Finding Leaks
DevPartner Error Detection excels at finding memory, resource and interface leaks. By default, DevPartner Error Detection searches for memory and resource leaks but not interface leaks. To search for interface leaks, select Enable COM object tracking in the COM Object Tracking settings.
DevPartner Error Detection provides two methods of detecting memory leaks, ActiveCheck and FinalCheck. ActiveCheck will search for memory leaks in any Windows 32-bit or 64-bit application. Leaks will be reported when your application shuts down. FinalCheck compre-hensively reports memory leaks at run-time as they occur in 32-bit and 64-bit applications. Examples include when a local variable goes out of scope or when the last pointer to a block of memory is re-assigned, as well as dangling pointer usage and other hard to find errors.
Finding Pointer and Memory Errors
DevPartner Error Detection can search for pointer and memory errors using both ActiveCheck and FinalCheck technology. In ActiveCheck mode, DevPartner Error Detection will monitor pointers passed to Windows calls for errors. Alter the settings for Call Validation and Memory Tracking to configure the amount of checking done by DevPartner Error Detection.
If you re-compile your program using FinalCheck, DevPartner Error Detection will check every pointer reference in your program for correct usage. FinalCheck provides very detailed analysis of your program and will locate hard-to-find problems such as uninitialized variables, dangling pointers, unrelated pointer comparisons, array index errors, and so on.
Finding Memory Corruption
DevPartner Error Detection helps you find memory corruption problems caused by the follow-ing types of problems:
⽧ Overrun allocated buffers
⽧ Continued access to memory after it has been deallocated ⽧ Deallocating a resource multiple times (e.g. double delete)
DevPartner Error Detection can detect many of these errors in ActiveCheck mode but provides the most detailed analysis with FinalCheck.
If you encounter memory overrun errors and you are restricted to using only ActiveCheck, see the online documentation which contains more information about Check heap blocks at runtime in the Memory Tracking settings.
Analyzing Transitions to Legacy Code in .NET Applications
DevPartner Error Detection provides the following types of analysis that can help you make the transition from native application to managed application programming:
⽧ Complete analysis of the native portions of Windows applications
⽧ Analysis of the transition layer between native and managed sections of applications that
use mixed code
⽧ Analysis of finalizers in managed applications
These types of analysis enable you to monitor:
⽧ Unhandled exceptions being thrown from native applications and passed to managed code ⽧ Garbage collector activity that might cause performance problems
⽧ COM interoperability between managed and native code
⽧ P/Invoke calls being made from managed code to native windows libraries
⽧ The frequency of calls across the managed to native boundary
Migrating from Native to Mixed or Managed Code
The migration process involves the following steps:1 Analyze COM usage for your native application to determine which objects are being used.
2 Rewrite a section of the application in managed code using P/Invoke and COM to call native portions of the application.
3 Under .NET Analysis, select Enable .NET analysis and PInvoke interop monitoring to analyze the transitions between the newly written code and the existing native code. 4 Make any necessary changes.
5 Under .NET Analysis, select COM Interop monitoring and PInvoke interop monitor-ing to monitor the number of calls made between managed and native code. Use the per-formance data to help make decisions on these additional changes:
a Determine which additional COM objects should be ported to managed code. b Determine if new methods should be added to reduce the number of calls between
managed and native code. For example, you might add a method to request data records 10-20 items at a time instead of one at a time.
c Determine if calls to native APIs (such as the Windows API) are being made effi-ciently.
You can also check for unhandled exceptions being thrown across the native-to-managed boundary. To do this, select Exception monitoring under .NET Analysis. Applications written in native code use exceptions to notify a caller that a call or method failed. As sections of your application are re-written in managed code, monitor the use of exceptions to catch exceptions before they transition to managed code.
Validating Win32 API Calls
DevPartner Error Detection recognizes thousands of Windows calls. This capability allows DevPartner Error Detection to validate pointers, flags, enumerations, handles, and return codes. Select Enable call validation to confirm that your applications are using Windows calls properly.
You can configure the following Call Validation features:
⽧ Choose what types of Windows calls to monitor
⽧ Selectively disable various types of validation such as flag, range, and enumeration
check-ing
With these features, you can configure DevPartner Error Detection to validate important parameters such as handles and pointers and to report fewer errors that do not pertain to the task at hand.
Searching for Application Deadlocks
DevPartner Error Detection can identify code that will cause deadlocks in your application. Select Enable deadlock analysis to locate deadlocks. Additional controls enable you to fine-tune deadlock analysis.
Expanded Uses for DevPartner Error Detection
Beyond error detection tasks, DevPartner Error Detection can be used as:
⽧ An aid to understand complex applications ⽧ A reverse engineering tool
⽧ A tool for stress testing an application
Understanding Complex Applications
DevPartner Error Detection contains several tools that help you better understand large, complex programs. Consider these three scenarios:
⽧ A new developer joins an existing team and needs to understand how the various DLLs
interact.
⽧ A consultant has been brought onto a project to solve a problem (such as crashes, memory
leaks, and so on) and needs to understand where to concentrate the most resources given a tight engineering schedule.
⽧ A developer starts using a third-party library and wants to understand why the library is
leaking Windows resources. In many cases, the problem is not with the library but in the way that the library is being used.
The following DevPartner Error Detection features can be used to address these scenarios.
COM Object Tracking
Many applications use COM objects that were provided by in-house developers, third-party vendors, or Microsoft. If these COM objects are not used correctly, interface leaks will occur. Interface leaks result in memory and resource leaks — objects allocated from the heap are not released properly, and in turn any memory allocated by those objects is not released properly. The COM Object Tracking enables you to view leaked COM objects. This information can help you determine where the missing Release call should be made corresponding to an
AddRef in your application.
Deadlock Analyzer
Many legacy applications, written before the common use of dual processors, may behave unpredictably when run on more current high-performance computer systems. For example, applications can become deadlocked when they use synchronization objects improperly.
Deadlock analysis under DevPartner Error Detection can identify code that may lead to deadlocks. Note that this analysis can also identify potential deadlocks. A potential deadlock is a deadlock waiting to happen when an undesirable set of conditions develop as an applica-tion runs. With DevPartner Error Detecapplica-tion, you can identify these potential deadlocks before they occur in a production environment.
Modules and Files
Complex applications are often developed across multiple organizations and include libraries purchased from outside vendors. By default, DevPartner Error Detection will report errors in any non-system DLL. Use the Modules and Files settings to restrict DevPartner Error Detec-tion error reporting and call reporting to specific secDetec-tions of your applicaDetec-tion. The result is a more meaningful error report that can be used to solve complex problems.
Note: Disabling all the modules in the Modules and Files settings will not prevent reporting of some error types. Error Detection always reports memory overruns within any module, and other types of events originating from the
MFCxxxx.dll libraries.
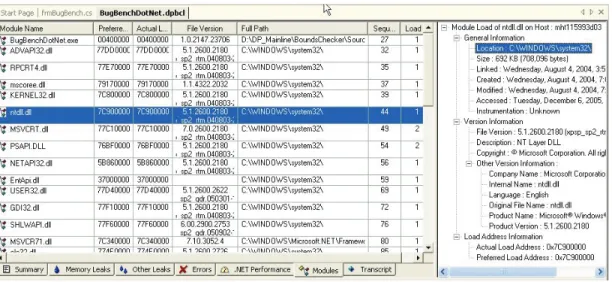
The Modules Tab
The DevPartner Error Detection Modules tab (see Figure 2-1 on page 27) and associated details pane provide a view into your program. This view shows what DLLs are being loaded as the program runs. By carefully reviewing this report, you can answer the following questions and make better-informed decisions when you have to make trade-offs:
⽧ Is this module instrumented, and how? ⽧ Is a particular DLL really needed?
⽧ Is it worth calling only one method in a DLL to incur the cost of n additional DLLs being
loaded into the process?
⽧ Why is my DLL being loaded at the non-preferred load address? ⽧ Why are multiple versions of the same DLL being loaded into memory?
Viewing and Sorting in the Results Pane
DevPartner Error Detection provides a wide variety of ways to view the data collected on your application. Initially, DevPartner Error Detection shows the Summary tab, a high-level report, in the Results pane. You can review the Summary tab and then double-click an entry to view more information.
This capability to navigate through multiple layers of information provides many different views of the data. For example:
⽧ A technical lead might review the data looking for trends such as more or fewer memory
leaks over time
⽧ A developer might be interested in correcting memory overrun errors, dangling pointers,
and so on.
This multi-level view enables you to identify the most relevant data and access a more detailed view in one of the tabs (Memory Leaks, Other Leaks, Errors, .NET Performance, or Modules) in the Results pane. When viewing data in one of the tabs, you can click column headers to further sort data by size, number of occurrences, location, and so on.
Reverse Engineering
DevPartner Error Detection can be used to analyze Windows applications. By creating a configuration with settings like those described in this section, you can use DevPartner Error Detection to monitor and report on the operations being performed by a Windows application.
Data Collection
Increase the Call parameter encoding depth parameter to generate more detailed API param-eter information. Increasing the encoding depth will slow processing and increase the size of the log file.
API Call Reporting
Select Enable API call reporting to log API call and return values. The amount of detail DevPartner Error Detection gathers on parameters and classes passed as parameters is deter-mined by the Call parameter encoding depth value under the Data Collection settings. Select Collect window messages to record all window messages sent to the application. Selecting this option provides a view of how the application responds to various window events such as mouse clicks, repaint events, etc.
Note: Selecting either of these options will increase the size of the log file and will slow DevPartner Error Detection performance.
To minimize the overhead of API call reporting, select only system DLLs most relevant to the current task.
COM Call Reporting
Select Enable COM method call reporting on objects that are implemented in the selected modules to enable collection of COM method calls.
To keep the COM Call Reporting information manageable, select only the most relevant inter-faces and clear the All components check box.
.NET Call Reporting
Select Enable .NET Method Call Reporting to enable collection of .NET method calls. To keep .NET call reporting manageable, select only .NET user assemblies (default setting).
.NET Analysis
Use .NET Analysis features when writing mixed native and managed code applications to:
⽧ Monitor unhandled exceptions being thrown from native code into managed code
⽧ Monitor calls (P/Invoke or COM method calls) being made from managed code to native
code
⽧ Select Exception monitoring to monitor exceptions.
To monitor calls from managed code to native code, select either COM Interop monitoring or PInvoke monitoring, then select an appropriate Interop reporting threshold value. When monitoring calls from managed to native code, select a sufficiently high reporting threshold value and use the Modules and Files settings to reduce unwanted information.
Function Groups to Turn Off for Reverse Engineering
Tip: Remember to select these features after you have finished your reverse engineering session.
DevPartner Error Detection provides tools to monitor many types of leaks and errors in Windows 32-bit and 64-bit applications. However, during reverse engineering sessions it may be desirable to turn off the DevPartner Error Detection error and leak detection logic. Follow these steps to disable these features in the Program Settings dialog box (in DevPartner Error Detection standalone) or the Options dialog box (in the Visual Studio IDE):
1 Under Call Validation, clear Enable call validation.
2 Under COM Object Tracking, clear Enable COM object tracking. 3 Under Memory Tracking, clear Enable memory tracking.
4 Under Resource Tracking, clear Enable resource tracking. 5 Under Deadlock Analysis, clear Enable deadlock analysis.
These features are intended to identify bugs in the code you are examining. By turning off these features, you can concentrate on information that may help you understand how the code in a component or API works.
Modules and Files
By default, DevPartner Error Detection will report on all portions of your application except those parts listed in the System Directories exclusion list.
When doing reverse engineering, you may want to monitor a few DLLs that would normally be excluded. By monitoring a DLL, you can trace into that DLL to see how it operates.
For example, to understand how a particular common control uses WIN32 API calls, you might explicitly include COMCTL32.DLL then enable API Call Reporting.
To monitor system DLLs explicitly, click Add module and add the desired DLLs.
Configuration File Management
You can use Configuration File Management to create and save settings designed for special tasks in your development cycle.
For example:
⽧ Memory, Resource and COM leak detection ⽧ Memory and Validation only
⽧ Reverse engineering
⽧ Any of the above, but with restricted sets of DLLs using custom Modules and Files
set-tings.
To prevent DevPartner Error Detection from monitoring business-critical portions of your application (such as password checking), you can selectively disable DevPartner Error Detec-tion logging by making calls to the DevPartner Error DetecDetec-tion callable interface at runtime. Please refer to the comments on event reporting in the following file for details:
C:\Program Files\Micro Focus\DevPartner Studio\BoundsChecker \ErptApi\NmApiLib.h
Note: For installs on 64-bit versions of Windows, the file is located at:
\Program Files (x86)\Micro Focus\DevPartner Studio\ BoundsChecker\ErptApi\NmApiLib.h
Stress Testing
A side effect of running DevPartner Error Detection is that it forces an application to deal with many unexpected situations that might only occur under heavy load situations.
Handling Non-zero Uninitialized Data
Many applications are written with the incorrect assumption that local variables and memory returned from dynamic memory allocation routines is initialized to some value. DevPartner Error Detection writes a known fill pattern over various types of memory when it is allocated to search for uninitialized data access. Examples include local variables, and memory
allocated by new, malloc, HeapAlloc or LocalAlloc.
If your application has been written assuming that uninitialized memory will be zero, your program may crash or behave unpredictably when run under DevPartner Error Detection. If this occurs, instrument your application with FinalCheck and check it again with DevPartner Error Detection to locate the errors.
Note: If you have written your own memory allocation routine that does not follow these rules, add an entry for your routine in the UserAllocators.dat file. See
Pool Poisoning on Free
DevPartner Error Detection writes a known pattern on dynamically allocated memory after it has been deallocated. By doing so, applications that reference deallocated structures generate errors. In many cases, dangling pointer errors can be very difficult to diagnose and repair. Instrument your application with FinalCheck and check it again with DevPartner Error Detec-tion to locate the errors.
Note: If you have written your own memory allocation routine that does not follow these rules, add an entry for your routine in the UserAllocators.dat file. See
Chapter 4, “Working with User-Written Allocators” for more information.
Working in a Heavy CPU-Bound Environment
Many developers write applications on extremely fast and lightly-loaded systems. When the application is moved to a production environment, the program fails randomly. Tracking down timing and performance-related issues can be difficult and time-consuming.
DevPartner Error Detection monitors all aspects of program flow and places your application under a heavy CPU and memory workload. At the same time, DevPartner Error Detection can monitor calls to Windows functions for signs of failure; errors are reported in the Program Error Detected dialog box.
Detecting Problems with Multi-threaded Code
Many applications are written to make use of multiprocessor application servers. Unless a multi-threaded application is carefully designed, deadlock and resource deprivation issues can occur when the program is put under stressful conditions.
Running a multi-threaded application under DevPartner Error Detection causes the perfor-mance of various threads to deteriorate and may cause the program to display timing-related problems. Many such problems would normally occur in production situations when the program is under stress. By using DevPartner Error Detection, you may be able to find problems in the development process and correct them before going into production. Run your application under DevPartner Error Detection with Deadlock Analysis enabled to check for deadlock, potential deadlock, and other synchronization bugs.
Detecting Memory and Pointer Reuse Errors
As applications have become more complex, the amount of memory and the number of point-ers used in applications has increased dramatically. To deal with this problem, software devel-opers use tools such as DevPartner Error Detection to search for memory and resource leaks. However, finding and plugging leaks is only one part of the task. Once memory has been deallocated, all outstanding pointers to the block should be declared as “dangling.” Attempts to reference dangling pointers should generate an error. The FinalCheck feature in DevPartner Error Detection has been designed to find and report on dangling pointers.
Undetected dangling pointers cause programs to reference blocks that have been deallocated or deallocated and reused by some other part of the system. A program run in a simple debug-ging environment may not show signs of failure. However, this same program could randomly crash, corrupt data or produce unexpected results when moved into a production environment.
Analyzing Complex Applications
This chapter provides information to help you use DevPartner Error Detection more effec-tively when checking complex applications.
About Complex Applications
When you debug typical Windows applications, the default DevPartner Error Detection settings gather enough data to help you solve most common programming problems.
When you debug a complex application, you can benefit by customizing the Error Detection settings.
Complex applications can be divided into two groups:
⽧ Large applications that contain many complex components
⽧ Non-traditional applications such as Windows services, ActiveX components, MTS or
COM components, ISAPI filters, and so on
Large Applications
Large Windows application are exceptional only because their size makes them difficult to monitor. Using DevPartner Error Detection, you can analyze a large application in logical, manageable sections, rather than trying to analyze the entire application at once. For example, if you are writing one DLL for a large application, you might:
⽧ Exclude sections of the application from analysis ⽧ Monitor only specific sections of the application
⽧ Monitor only specific transactions within the application
Non-traditional Applications
Non-traditional applications may require different error detection strategies because of complex startup or configuration issues. You can configure DevPartner Error Detection to perform the special debugging or analysis operations required to monitor these types of appli-cations.
DevPartner Error Detection Capabilities and Complex Applications
These Error Detection capabilities can help you analyze complex applications:⽧ Ability to Wait for Process
⽧ Ability to restrict the modules and files monitored by your application ⽧ Ability to enable or disable the Error Detection log at run-time
Wait for Process
Instead of running your program under Error Detection, you can have Error Detection initial-ize itself for your application and wait for it to start. You can then start your application manually, or using another means (such as the Service Control Manager). You can use this option to debug services such as IIS.
Note: When using Wait for Process, the full pathname of the application that starts must exactly match the full pathname of the application that Error Detection is looking for.
This option replaces the use of Image File Execution Options in previous releases of BoundsChecker and DevPartner Error Detection.
This option is only available when you are using the DevPartner Error Detec-tion standalone applicaDetec-tion (bc.exe), and is not available when using Error Detection integrated into Visual Studio.
To debug an application or service using Error Detection in an “Initialize and Wait” manner: 1 Open the image you want to test inside the Error Detection application (bc.exe). 2 Configure Error Detection to watch for the errors that interest you.
3 Select Wait for Process from the Program menu.
Error Detection initializes itself and displays a dialog box allowing you to cancel the session if desired.
4 Start your application as you normally would.
If you normally start your application via the Service Control Manager, then start it that way. Error Detection closes the dialog when your application starts.
5 Exercise your application, and then cause it to exit.
Analyzing Limited Parts of Your Program
You can point DevPartner Error Detection at a limited problem area within a large or complex application and ignore the rest of the application. DevPartner Error Detection provides four mechanisms to help you analyze limited parts of your program:
⽧ Use Suppressions and Filters to prevent undesirable information from either being
logged or displayed.
⽧ Use the Program > Log Events menu item or the Log Events toolbar button to toggle
Error Detection logging.
⽧ Add conditional code into your application to call StartEvtReporting and
StopE-vtReporting.
Note: StartEvtReporting and StopEvtReporting are DevPartner Error Detection functions that you can call from inside your application to control the writing of data into the DevPartner Error Detection log. If DevPartner Error Detection is not active, these calls return immediately.
Modules and Files
If you are working with large applications, you can use the Modules and Files settings to prevent sections of the application from being analyzed. This can reduce analysis time and decrease the number of unwanted error messages. These are some of the sections you can exclude:
⽧ Unwanted DLLs, including third-party DLLs ⽧ Individual source files from a DLL or EXE ⽧ Entire DLL trees
⽧ Exclude errors if source code is unavailable
Note: Disabling all the modules in the Modules and Files settings does not prevent reporting of some error types. Error Detection always reports memory overruns within any module, and other types of events originating from the
MFCxxxx.dll libraries.
See “Using Modules and Files Settings” on page 36.
Suppression and Filtering
There are two ways to hide the errors and events that DevPartner Error Detection reports.
⽧ Suppression prevents a specified type of error or event from being entered into the Error
Detection log. To show a suppressed error, you need to remove the suppression instruction and re-run your application under DevPartner Error Detection.
⽧ Filtering hides an error or event that has already been entered into the log. You can hide or
display filtered errors.
Selective Event Logging
To monitor a small section of a large application, use the Log Events menu or tool bar button to turn the Error Detection log on and off. This technique can be especially useful when you select the following settings:
⽧ API or COM call logging ⽧ Call validation.
If you use selective event logging with any of the leak detection features (for example, memory tracking, resource tracking or COM interface tracking) be aware that many leaks are only detected at the end of the program. If logging is off when your program terminates, many of the leaks you are trying to find are reported.
When trying to detect leaks, use Modules and Files or Suppression to exclude unwanted information.
Conditional Code
You can modify your program to make calls into the DevPartner Error Detection data collec-tion engine to enable or disable Error Deteccollec-tion logging. The following sample code shows how to disable Error Detection logging around unwanted areas:
// Requires library [installation folder] \ERptApi\NMApiLib.lib
// Include file is located in [installation folder]\ErptApi #include "nmapilib.h"
… [Code that can be monitored] StopEvtReporting()
… [Code that should not be monitored] StartEvtReporting()
… [Code that can be monitored]
You can also use the StartEvtReporting or StopEvtReporting API calls to prevent DevPartner Error Detection from logging business-critical sections of an application.
Examples might include password validation or encryption routines. If DevPartner Error Detection is not active, the API calls return immediately.
Using Modules and Files Settings
To determine what to exclude from your application, follow these steps: 1 Open your executable in DevPartner Error Detection.
2 Disable all data collection.
〫 In DevPartner Error Detection standalone:
Select Program > Settings > Error Detection.
〫 In Visual Studio:
Select DevPartner > Options.
In the Options or Settings dialog box, clear the settings for API Call Reporting, Call Validation, COM Call Reporting, COM Object Tracking, Deadlock Analysis, Memory Tracking and Resource Tracking.
Error detection records all DLLs used by your application. Exercise the program in a way that causes all its DLLs to be loaded, then exit your application.
4 Open the DevPartner Error Detection Settings or Options dialog box and select data col-lection settings.
5 Select Modules and Files in the Settings or Options dialog box. DevPartner Error Detec-tion automatically lists all executables and DLLs used by your applicaDetec-tion except for files located in the system folders.
6 Review the list of modules and files. Clear any listed DLLs that do not pertain to the task at hand. From this reduced list of DLLs, expand each DLL and select the source files to monitor.
7 To exclude all DLLs in a specific folder, click System directories and add the folder to the list of excluded folders. If there is a particular file you want to include from a system folder, click Add module to add it to the list of monitored DLLs. Clicking on the folder icon toggles it from a single folder to multiple folders. Table 3-1 explains the icon mean-ings.
8 To exclude leaks and errors in portions of your program without source code, select Show leaks and errors only if source code is available.
Tip: If you plan to create multiple settings files you can name one of the settings files
Base Configuration. You can then use the Base Configuration settings as a starting point to create other settings files.
9 After you create a logical subset of your application, use Configuration File Manage-ment to save your settings.
Table 3-2 provides a list of ways to use the Modules and Files: settings.
Table 3-1. Meaning of folder icons in the Modules dialog box
Icon Description
The selected folder is excluded from testing (unless the specific dll is also listed in the Modules dialog box).
The selected folder and all sub-folders are excluded from testing.
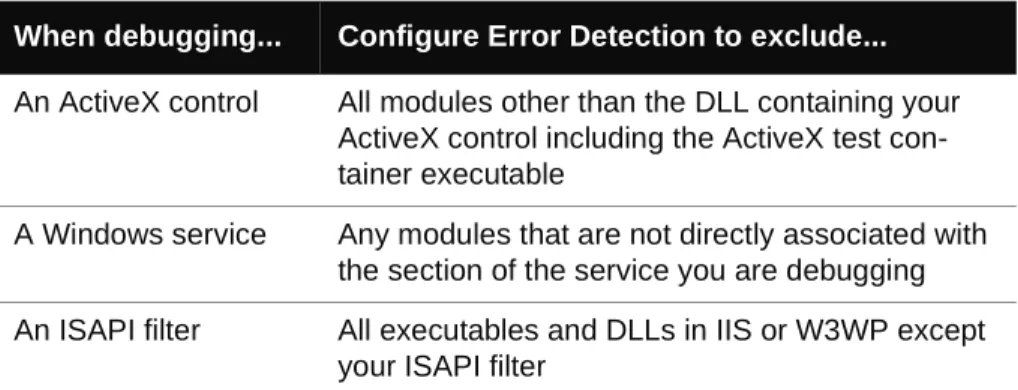
Table 3-2. Using the Modules and Files settings
When debugging... Configure Error Detection to exclude...
An ActiveX control All modules other than the DLL containing your ActiveX control including the ActiveX test con-tainer executable
A Windows service Any modules that are not directly associated with the section of the service you are debugging An ISAPI filter All executables and DLLs in IIS or W3WP except
Note: If you exclude everything but your code, you might not see memory or resource leaks that are indirectly caused by your section of the application.
Deciding What to Monitor
When dealing with a complex application it is important to know which sections of an applica-tion to monitor. Deciding what to monitor and what to ignore affects your success when track-ing down leaks and errors.
To decide what to monitor, consider these questions about your application:
⽧ How does your application start up? 〫 Do you start it directly?
〫 Do you start it by running another program? 〫 Do you launch it from the control panel? 〫 Is your application launched indirectly?
⽧ How many modules and files are in your application?
〫 Do you own all the modules in your application (other than system modules)? 〫 Do you have source for all of your modules?
⽧ Are you interested in the entire application or only a part? 〫 Do you care about errors in modules you don't control?
〫 Is your application transactional? If so, do you want to watch the entire application or
just a few transactions?
〫 Does your application make use of resources passed to it from code you do not
con-trol?
Once you have answered these questions you can configure DevPartner Error Detection to monitor your application.
As you decide what to monitor, remember that other parts of the program may provide resources to your application. Be aware that if you narrow the focus too much, you may miss resources being passed between your selected analysis subset and the rest of your application. For example, if you are writing an ActiveX control and running it under the test container, you want to know what happens in your DLL. However, if you call your object incorrectly, resource and interface leaks may occur. If you monitor only your control, errors are found but not errors caused by incorrect usage of your control.
A complex applica-tion
The sections of the application that do not apply to the problem you are trying to solve
An out of process COM object
Any modules that are not directly associated with your DLL, such as dllhost.exe or mtx.exe. Table 3-2. Using the Modules and Files settings
How Does an Application Start Up?
If you are working with a console or Windows application, you can configure Error Detection to monitor your application by selecting File > Open. DevPartner Error Detection starts the application and analyzes any DLLs that are directly linked to it.
If you are working with a non-traditional application, it falls into one of two categories:
⽧ It is started directly through a control program ⽧ It is started indirectly based on a system action
The first type of application includes ActiveX controls or DLLs that are invoked by some test application. For example, if you have written an ActiveX control, you can analyze it using the Test Container application, which is available as an executable file with Visual Studio 2005 and 2008, and as a solution in Visual Studio 2010 in the Samples/1033 folder.
If a system action directly invokes your application, use the Error Detection Wait for Process option to wait for the application to start (see “Wait for Process” on page 34). Examples of this include:
⽧ Windows services
⽧ Out-of-process COM servers
Many specialized applications, such as services and COM servers, are time critical. If your application is time critical, disable the time out logic when using DevPartner Error Detection for best results.
Analyzing Services
DevPartner Error Detection can monitor Windows services. When monitoring services consider the following:
⽧ Is your service started at boot time or on demand? ⽧ Does your service require a particular security context? ⽧ Can your service be run interactively?
⽧ Can you run your service without being a service? ⽧ Does your service have timing issues?
DevPartner Error Detection can analyze services that can be started after the system is up and running. For best results, you should be able to manually start or stop your service throughout the debugging process.
Requirements and Guidelines
In order to monitor a service, DevPartner Error Detection requires that the account being used to run it have Administrative privileges. You might have additional problems if your applica-tion has tight timing requirements.