(IJSBAR)
ISSN 2307-4531
(Print & Online)
http://gssrr.org/index.php?journal=JournalOfBasicAndApplied
---
475
Forecasting Gold Prices Time Series by Using Joint
Analysis and Separately Analysis
Ebrucan Islamoglu
*Nevsehir Hacı Bektas Veli University, Faculty of Economics and Administrative, Banking and Finance Department, 50300, Nevsehir, Turkey.
Email: [email protected]
Abstract
In recent years, there are many studies rely on forecasting with artificial neural networks. In this study, artificial neural networks are discussed considerably in demand over the past decade in the world finance literature. In the study, forecasting for the highest and the lowest gold prices with feed forward artificial neural networks are comprehensively studied. Linear or curvilinear functions are used in activation functions of artificial neural networks. Model1 and Model2 are used. Model1 has linear activation function in output layer and Model2 has lojistic activation function in output layer. Initially, we used two separate feed-forward artificial neural networks for analyzing the lowest and the highest gold prices values. Afterwards, lagged variables of time series are
joıntly given to artificial neural networks as input. We jointly forecast the lowest and the highest gold prices.
Artificial neural networks gave better results for certain architectures. The forecasting results are discussed according to Root Mean Square Error (RMSE), Mean Absolute Percentage Error (MAPE), Mean Absolute Deviation (MAD) and Direction Accuracy (DA) criterion. Jointly analysis gave better results.
Keywords: Artificial neural networks; Forecasting; Activation function; Gold prices; Model1; Model2.
--- * Corresponding author.
476
1.IntroductionIn recent years, concern about artificial neural networks for time series forecasting progressively increases. Due to the fact that artificial neural networks don’t have difficult constraints such as normality, linearity, it has frequently preferred in practice. Studies on time series forecasting with artificial neural networks are summarized in [30]. Although artificial neural networks have many advantages in solving forecasting problems, it has disregarded problems, too. Especially, determination of architecture structure of artificial neural networks is a critical discussion subject. The authors in [15,16, 6] have proposed model election criterions and strategies in forecasting problem for architecture election problems of artificial neural networks. An another subject is about architecture election problems. [6] discussed about this subject. Determination of architecture must be suitable for underresearched forecasting problem. In this study, analyzing of artificial neural networks of time series are discussed. Observations such as stock market index, gold prices or exchange rate change within the day.
Forecasting methods of time series with artificial neural networks are implemented prevalently. The problem of analysing with artificial neural networks of time series hasn’t discussed in the literature yet. Time series are modeled seperately in classic time series analysis. Gold prices change between the lowest and the highest values in a certain day.
In the study, two different approaches for analyzing time series are compared. In first approach, separate artificial neural networks for analyzing the lowest and the highest values are used. In second approach, same artificial neural networks for analyzing the lowest and the highest values are used. Obtained results are disputed.
Gold has been given great importance by every society throughout history, when we looked from the perspective of our country, it exhibits a similar situation. Gold is accepted as an important investment tool by a large section of the society. Use of gold in jewelry is also an advantage compared to other investment vehicles. Due to properties of value, price and investment, gold submits great importance for savings owners. [51] noted that as in other investments, it is also important to take investment positions for gold investors according to future price estimation. Due to supply of gold is limited at all times and it is seen as an attractive investment and savings vehicle in each country. In addition to this feature, due to being affected of economic and political instability, it is a mineral that occurs fluctuations in its price.
2. Literature Review
Reference [17] said that numerous studies are trying to explain gold price with the help of statistical models. In general, these studies can be divided into three parts. [3, 7, 18-20, 25, 35-37, 41, 48] said about first group studies, changes in gold prices investigate with the main macroeconomic variables such as rate, interest rate and revenue; according to the authors in [14, 31, 38, 45] noted that second group studies examines speculations about the prices of gold and gold price movements. [4, 8, 10, 12, 13, 27, 44, 47] noted that third group studies are focused on short and long term relationships and examined gold as a protection tool against inflation.
477
The presence of large data sets, increasing processing power of personal computers and progressing fast learning and testing algorithms, it has led researchers to show interest in nonlinear models and methods. In question one of the non-linear methods are also artificial neural network (ANN). The basic idea of this method is trying to emulate the excellent data processing capabilities of human brain. The main purpose of this study is predicted gold prices by artificial neural networks. The most appropriate model is tried out to identified among artificial neural network models. The most appropriate Root Mean Squared Error (RMSE), Mean Absolute Deviation (MAD), Mean Absolute Percentage Error (MAPE), Direction Accuracy (DA) values are trying to compared to each other and so the best results are researched. In the following sections of study are firstly included studies about determination of the price of gold. The next section is introduced artificial neural networks and application and the results of application. In the result section, implementation results have been obtained.
Reference [28,29] examine short-term and long-term relationships between gold price and stock market in his studies. In both studies, there is a negative correlation in the short term between gold prices and stock market, in the long term it has concluded that there is no relationship between gold prices and stock market. Gold price mainly are discussed in this studies. The authors in [2, 3, 7, 10, 14, 21, 33, 38] noted about World Inflation, US Inflation, Dow Jones Index (DJI), the price of oil, the price of silver, ABD rate, USD/EUR parity, US interest rates. In these studies, general statistical test methods are used. These methods are Cointegration Test, Granger
Match Integration, Arımax General Methods. Different from these methods, Reference [3] have used ANFIS,
ANN and ARIMA methods. According to the findings of the study, gold prices are affected by a positive way from silver and oil prices and are affected by a negative way from DJI, US interest rates, US CPI and US dollar exchange rate. Reference [24] has used montly data between January 1995 - November 2006 and has determined long – term relationship with Granger Co - Integrate Test between CPI Index with the gold price and TL/USD exchange. Reference [39] examined the factors of 161 models that affect gold price in Turkey on monthly data set between August 1995 - December 2008 period. Istanbul Gold Exchange (IGE), inflation, interest rates, real exchange rate index, Istanbul Stock Exchange (ISE-100)1 Index and London Gold Market variables are used in his model. In this study the results are obtained from the multiple regression analysis. Internal factors are not statistically significant in determinig gold price in Turkey. Changes in price on London gold market has influenced gold price of Turkey at a rate of %96,2. Reference [23] has tried to explain Republic Gold Price econometrically in his study with variables that have an impact on world gold price through the factors that affect the Dynamics of Turkey. According to the result of the study, ISE 100 index selected as an alternative investment tool, Dow Jones index, dollar exchange rate and petrol price don’t affect Republic Gold Price. However, the world gold prices has affected 1 month interest rate and CPI has been found to affect Cumhuriyet Gold Price as expected. Bullion Gold Sales Price (TL/g) weekly data has been used between 05.01.2001 and 04.02.2011 dates. During this investigation, mobility of bullion gold sales price logaritmic return series was performed. ARCH(1), GARCH(1,1), EGARCH(1,1), TARCH(1,1) and TARCH(2,2) modeling. TARC(2,2) model has achieved the most successful result. The authors in [37] have analyzed short and long term relationships among stock with gold as an investment tool, government securities (gdds), CPI and PPI. Regression analysis has shown a negative correlation between gold returns and stock returns and a positive correlation with calculated inflation based on the PPI. Reference [43] examined changes about gold prices in
478
Turkey gold market in his study. In his study, London Bullion Gold Association gold prices have concluded that the single and the most important variable of IGE gold price. In the study, gold prices are negative affected by Dow Jones Industrial Index and positive affected by London bullion gold association and wholesale price index. The volatility of the gold prices are predicted with the help of ARCH models and the gold prices have negatively affected. The author in [9] constituted a model to estimate gold and silver spot prices in Turkey. He used TL money supply (M2), TL/USD value, Turkey industrial production, CPI, world CPI, brent oil, bist 100, Turkey indicator conversion interest, credit risk values for period between January 2005 - November 2012. He analyzed the created model with ARIMAX and probit models. ARIMAX (0, 1, 0) has received the best result for gold. In this study, neural networks are used in the prediction of the gold price. Unlike previous studies, EuroNext 100 Index is located in the data set.
3.Artificial Neural Network (ANN)
Biologic neural networks are complicated systems in human body. The executive of this complicated systems are handled sinyals coming from environment. There are approximately 100 billion neurons in human brain. Structure of biologic neurons are shown as below.
Figure 1: Structure of Biologic Neuron
A neuron bounds other neurons with dendirit nets. When one of those send sinyal, this sinyal can detectable from dendirits of other neurons. All of these are gathered and transferred to parts of soma. Soma and nucleus don’t play any role in process of input and output. Principal functions provide neurons.These neurons are consistently functional. Axon Hillock operationalises are the parts of soma arrival sinyals. If total input is bigger than threshold value of Axon Hillock, neuron transforms input sinyal and transmits other neurons by means of Axon. Without any loss, this output called as Terminal Button section. Each terminal button depends on other neurons called as synaptic gap with a small gap. Physical and neurochemical features of each snap designate violence and polarity of new input signal.
Similar points of artificial neurons and biologic neurons are like this. Processor unit takes many sinyals from many places. Sinyals are modified for weighting by recipient synaptic. Processor unit gathers weighting inputs. If there is enough input (Input signal exceeds the threshold value after conversion), neuron genarates a signal as output. This signal is transmitted to other neurons through axons. Information processing entirely belongs to this neuron. Memory is distributed. Long-term memory stops in synaptics of neurons or weights. Short-term memory is transmitted signals by neurons. Reference [1] noted that the strength of synaptic can be modified by
479
gained experience. Neurotransmitters for synapses may be blocker or mobilizers.
1943 year is the first year of artificial neural networks. The authors in [50] firstly have developed an artificial nerve cell model. In their study, they modeled nerve cells as logical elements with fixed threshold value. In 1949, Reference [11] has developed a learning model. That model is still valid today. According to the author in [11] model constitutes most of the current learning rules and this model is also known as its own name. The works have accelerated by 1950s. In 1951, SNARC is the first artificial neural network-based computer and it was produced by MIT. In 1958 [42] developed a single linear sensor. The name of this linear sensor is perceptron model. This model is used as an revolutionary in ANN works. Because this model was laid the foundation of the multi-layered sensor and it developed later. But single linear sensor model can only analyze by separable solutions with multi-dimensional plane.
Reference [5] were introduced ADALINE (Adaptive Linear Neuron) models to the world in 1960. The most important feature of this model is to minimize the error during the training with LMS (Least Mean Squares). Mathematician authors in [40] have proven that sensors (perceptron) can not be used for complex logic operations in the late 60s. They mathematically proved that famous XOR problem can not be solved by sensor. After this sample, studies on ANN entered the recession period. In fact, confidence of many researches to ANN waggled and thereby researches and investments were cut. This case continued until the beginning of the 80s. Due to the fact that they mathematically proved that famous XOR problem can not be solved by sensor. Thanks to the persistent works of several researchers, XOR problem is revived after 1982. Reference [32] showed that ANN could be generalized and difficult problems could find solutions. Traveling salesman problem was the best example of this and engineers could easily understand this problem. So interest to ANN began to rebuilt. The authors in [26] said that the results of the works led to the birth of the Boltzman machine which developed as a result of the works. XOR problem can not be solved as a single linear sensor. This problem can solved with multilayer sensors. All arguments about useless ANN are refuted. Reference [49] developed networks. This networks can learn. Rumelhart developed Back Propagation Algorithm (Back Propagation) in 1986.This algorithm is still used and it is based on very complex mathematical basis. The symposium of the first artificial neural networks was made in 1987 and later applications started to increase.
Artificial neural networks (ANN) are information processing systems and they have similar characteristics to biological neural networks in the human body. ANNs are mathematical models. They have developed as a result of investigations of properties of biological neural networks. According to the authors in [34] the basic assumptions of the ANN model are shown below.
1) Information for system is called as Neuron.
2) Signals are transmitted between neurons.
3) Each link has a certain weight. The weights of the connections are multiplied with transmitted signal in many ANNs.
480
determine the output signal. Activation functions are usually nonlinear functions.
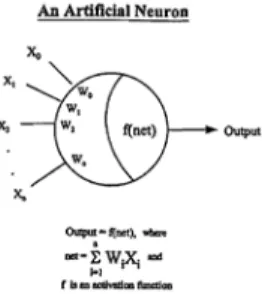
Figure 2: The structure of the artificial neurons
ANNs consist of a large number of neurons. Each neuron is connected to other neurons. There are weights of these connections. The weights in connections are determined by learning process. The author in [1] noted that, this context ANNs are characterized by the following features.
1) Structure (Architecture) : Tissue of connections between neurons
2) Determining of the weights on the connections (Training, Learning Algorithm)
3) Activation Functions.
In general, the neurons are inserted in layers. The main factors of neurons are activation functions. Weighted connection tissues are send signals and they recevied signals. The behaviours of the neurons in the same layer are identical. Tissues of connections between the layers called as “ANN structure”. By the time the numbers of layers were calculated, input layer had ignored. Because input units do not make calculations. The author in [1] said that ANN structures can be divided according to the number of layers and in the literature this layers are split in half. These networks are, 1) Feedforward Artificial Neural Networks 2) Backfeed Artificial Neural Networks.
3.1. Feedforward Artificial Neural Networks
Feedforward artificial neural networks consist of three parts. These parts are input layer, hidden layer and output layer. The structure of a typical feedforward artificial neural networks is shown as follows,
Figure 3: The structure of feedforward artificial neural networks
The author in [1] said that the number of neurons in these layers can be increased as desired. Besides, the
481
flow is always from left to right.3.2. Backfeed Artificial Neural Networks
According to the author in [1], such networks transmit the feedback signal. This signal received from output layer and transmits to input layer. Hidden layers are used as a buffer layer.
While taking new entries to network, the feedback signals must take into consideration. The feedback is a key element. Because it helps to obtain more accurate results of network. The schematic structure of feedback artificial neural networks is shown in Figure 4.
Figure 4: The structure of feedback artificial neural networks
Determining the structure of ANNs and the connection of weights in ANNs is important. Because these separate them from each other. Here only two basic form of learning is mentioned.
These are, 1) Conditioned (Supervised) learning 2) Not conditioned (Unsupervised) learning
In conditioned learning, there is a particular input vector. This input vector corresponds to a particular output vector. The desired output vector of network is obtained, so the connection of weights are detected. The connections of weights are determined by a learning algorithm.
In unconditioned learning algorithm, despite of having the input vector, there is not a target desired as output. The network makes a classification by examinig the input vector and it generates an output for each class.
3.3. Activation Function
Reference [1] noted that one of the main functions of artificial neurons are gathered input signals. They are created an output by converting.
Neuron converts these signals by weighting via a function. If obtained results are higher than threshold value in conversion conclusion, neuron produces output signal. That is why, “Activation Function” is used in transformation process.
Activation functions are generally nonlinear functions. Different functions are used according to the type of the problem. In Table 1, activation functions and formulas are given.
482
Table 1: Activation Functions and Formulas
Function Name Formula Logistic f(x)=1/(1+e-x)
Linear f(x)=x
Tanh f(x)=tanh(x)
Sinus f(x)=sine(x)
Symmetrical Logistic f(x)=[2/(1+e-x)]-1
Gauss f(x) = e-x2
Gauss Complement f(x)=1- e-x2
4.Implementation
4.1.Variables and Data
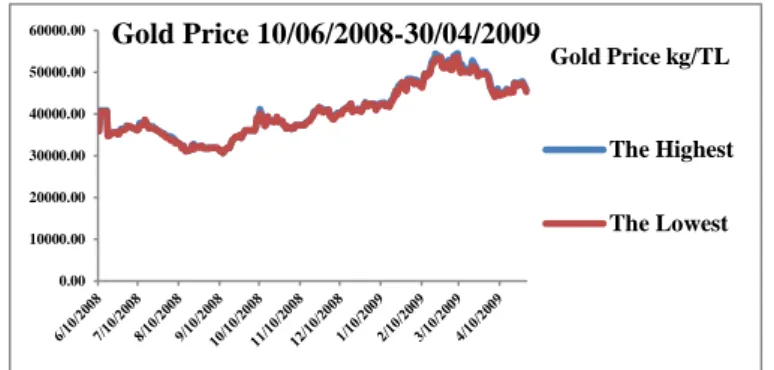
Daily gold prices time series are used in time series between 10 June 2008 and 30 April 2009 dates. These time series are changed between minimum and maximum values. Matlab computer programme is used in implementation. Missing data are estimated by using the closest mean method and the series average method. Time series have been used to compare the last 33 observations with a total of 233 observations. The test set is taken between 17 March 2009 and 30 April 2009 dates. Firstly, the lowest and the highest gold prices time series are analyzed separately by using artificial neural networks. Secondly, the lowest and the highest gold prices time series are analyzed simultaneously given as input to artificial neural networks. The highest and the lowest gold prices are used as two output in artificial neural networks architecture and they estimated together.
Figure 5: Time Series Chart of The Lowest and The Highest Gold Prices
Model1 is used in output layer of activation function. Model1 has a linear activation function. Model2 has a logistic activation function in output layer of activation function. Prediction results are discussed according to Root Mean Square Error (RMSE), Mean Absolute Deviation (MAD), Mean Absolute Percentage Error (MAPE) and Direction Accuracy (DA) criterias.
RMSE = �∑ (y�i-yi) 2 n i=1 n , MAPE = ∑ �yi-y�i yi� n i=1 n *100 , (𝑦𝑦𝑖𝑖≠0) 0.00 10000.00 20000.00 30000.00 40000.00 50000.00 60000.00 The Highest The Lowest Gold Price 10/06/2008-30/04/2009 Gold Price kg/TL
483
MAD = ∑𝑛𝑛𝑖𝑖=1|𝑦𝑦𝑖𝑖−𝑦𝑦�𝚤𝚤| 𝑛𝑛 , DA = 1 n-1∑ � 1, (Xt41- Xt)(X�t+1-Xt)>0 0, o. w. n-1 t=1The obtained results are given in Table 2 and Table 3. Two separate feedforward neural network models are used in analyze of time series. Firstly, separate artificial neural networks for analyzing the lowest and the highest values are used. In this model, we used linear activation function in the output layer and logistic activation function in all other layers.
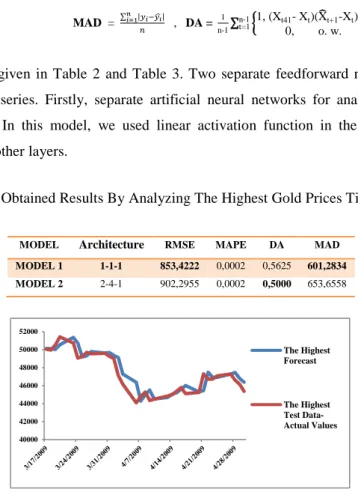
Table 2: Obtained Results By Analyzing The Highest Gold Prices Time Series
MODEL Architecture RMSE MAPE DA MAD
MODEL 1 1-1-1 853,4222 0,0002 0,5625 601,2834 MODEL 2 2-4-1 902,2955 0,0002 0,5000 653,6558
Figure 6: Chart of Actual Values and Prediction Values of The Highest Gold Prices Time Series (Separate Analysis)
The result of analyzing of the highest gold prices time series, according to RMSE criteria, Model1 gives better result than Model2, according to MAPE criteria, two models give the same results, according to DA criteria is seen that Model2 gives better result than Model1 and according to MAD criteria Model1 gives better result than Model2. As a result of separate analysis, in general it is said that Model1 gives better results than Model2 and it is seen that the highest gold prices series by using artificial neural networks predictive values give close results to actual values.
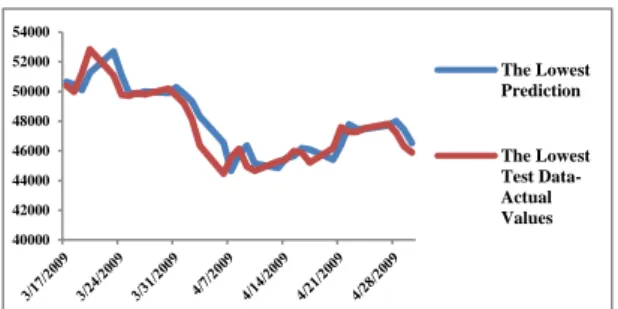
Table 3: Obtained Results By Analyzing The Lowest Gold Prices Time Series
MODEL Architecture RMSE MAPE DA MAD
MODEL1 1-1-1 921,9953 0,0002 0,4371 733,8987 MODEL2 3-4-1 963,5051 0,0004 0,5625 788,1476
The result of analyzing of the lowest gold prices time series, according to RMSE criteria, Model1 gives better
result than Model2, according to MAPE criteria Model1 gives better result than Model2, according to DA
criteria is seen that Model1 gives better result than Model2 and according to MAD criteria, Model1 gives better result than Model2. As a result of separate analysis of the lowest gold prices series by using artificial neural networks according to all criterias Model1 is seen to give good results and this case is noteworty. In separate analysis, it is seen that Model1 gave better results for the highest values and the lowest values.
40000 42000 44000 46000 48000 50000 52000 The Highest Forecast The Highest Test Data-Actual Values
484
Figure 7: Chart of Actual Values and Prediction Values of The Lowest Gold Prices Time Series (Separate Analysis)
Secondly, the lowest and the highest gold prices time series are simultaneously given as input to artificial neural networks. The highest and the lowest gold prices is used as one output in artificial neural networks architecture and they estimated together. Obtained results are given in Table 4 and obtained values are compared with other results.
Table 4: Obtained Results by Analyzing The Lowest and The Highest Gold Prices Time Series
MODEL Architecture RMSE MAPE DA MAD
MODEL1 2-2-1 282,0623 0,0046 0,9062 221,8432
MODEL2 2-2-1 174,1204 0,0032 0,8750 157,1395
Figure 8: Chart of Obtained Results By Analyzing The Lowest and The Highest Gold Prices Time Series (Joint Analysis)
The result of joint analyzing of the lowest and the highest gold prices time series, according to RMSE criteria,
Model2 gives better result than Model1, according to MAPE criteria Model2 gives better result than Model1,
according to DA criteria is seen that Model2 gives better result than Model1 and according to MAD criteria Model2 gives better result than Model1. In joınt analysis, Model2 gives better results than Model1 for the highest values and the lowest values.
5. Conclusion And Evaluation
Reasonable results have been obtained for certain architectures. It is seen that Model1 gives the best results according to all criterions in separate analysing of time series and Model2 gives the best results according to all
40000 42000 44000 46000 48000 50000 52000 54000 The Lowest Prediction The Lowest Test Data-Actual Values 0.00 10000.00 20000.00 30000.00 40000.00 50000.00 60000.00 The Lowest The Highest MODEL 1 MODEL 2
485
criterians in jointly analysing of time series.As a result of analyzing of the lowest and the highest gold prices time series, coincides architectures draw attention according to all criterians. Coincides architecture is [1-1-1]. In addition, the number of input layer, hidden layer and output layer are the same in this architecture. This is also important. In consequence of joint analysis of the highest and the lowest gold prices time series architecture is the same according to all criterians. This architecture is [2-2-1]. In this architecture, the number of input layer and hidden layer are the same and this case draws attention, too. In the event of separate analyzing of the lowest and the highest gold prices Model1 is preferable according to RMSE and MAD criterias. References [1-1-1] architecture are the same for both time series. Consequently, according to all performance criteria, Model1 is preferable in separate analysis and
Model2 is preferable in joınt analysis. In general, it is seen that joint analysis of the lowest and the highest gold
prices time series gives better results than separate analysis according to RMSE and MAD criterians and seperate analysis of the lowest and the highest gold prices time series gives better results than joint analysis according to MAPE and DA criterians. In this study, different performance criterions can be used or models can be enhanced by changing activation functions.
References
[1] A. H. Diler. “Estimating The Direction of ISE National 100 Endex with Neural Networks Error Back
Propagation Method”, Journal ISE, vol.7, pp:25 – 26. 2003.
[2] A. Topcu. “Capital Markets Board. Factors Affecting The Gold Price,”
Available:http://Www.Spk.Gov.Tr/Yayingoster.Aspx?Yid=1016&Ct=F&Action=Displayfile, Jan,
2010.
[3] A. Yazdani-Chamzini, S. H. Yakhchali, D. Volungevičienė and E. K. Zavadskas. “Forecasting gold price changes by using adaptive network fuzzy inference system.” Journal of Business Economics And
Management, vol.13, pp:994-1010, issue:5. Available: http://dx.doi.org/10.3846/16111699.2012.683808, 2012.
[4] B. R. Kolluri. “Gold as a hedge against inflation: An empirical investigation.” Quarterly Review of
Economics and Business, vol:21, pp:13-24, 1981.
[5] B. Widrow and M. E. Jr. Hoff. “Adaptive switching circuits”, IRE WESCON Convention Record, Part
4, New York : IRE, pp. 96-104, 1960.
[6] C. H. Aladag, E. Egrioglu, S. Gunay and M. A. Basaran. “Improving Weighted Information Criterion
By Using Optimization“, Journal of Computational and Applied Mathematics, vol.233, pp:2683-2687, 2010.
[7] C. Toraman, C. Basarır and M. F. Bayramoglu. “Upon detection of the factors affecting the gold price : a review with MGARCH model.” Journal of International Alanya Management Faculty, vol:3, pp:1-20, issue:1, 2011.
[8] D. Chappell and K. Dowd. “A simple model of the gold standard.” Journal of Money, Credit and
Banking, vol:29, pp:94-105, issue:1, 1997.
[9] D. Deveci. “Predicting gold and silver spot prices in Turkey.” Unpublished master’s thesis, Middle
486
[10] D. Ghosh, E. J. Levin, P. Macmillan and R. E. Wright. “Gold as an inflation hedge?” Studies in
Economics and Finance, vol:22, pp:1-25, issue:1, 2004.
[11] D. O. Hebb. “The organization of Behavior”, Wiley, New York, 1949.
[12] D. Ranson. “Inflation protection: Why gold works better than “linkers”.” London: World Gold
Council, 2005b.
[13] D. Ranson. “Why gold, not oil, is the superior predictor of inflation.” London: World Gold Council,
2005a.
[14] E. Aksu. “Price formation in the gold market”, Unpublished master’s thesis, Ataturk University,
Erzurum, 2008.
[15] E. Egrioglu, C. H. Aladag and S. Gunay. “A New Model Selection Strategy In Artificial Neural
Network.“ Applied Mathematics and Computation, vol.195, pp:591-597, 2008a.
[16] E. Egrioglu, C. H. Aladag and S. Gunay.“A New Architecture Selection Strategy in Solving Seasonal
Autoregressive Time Series by Artificial Neural Networks“, Hacettepe Journal of Mathematics and Statistics,vol.37, issue 2, 2008b.
[17] E. J. Levin and R. E. Wright. “Short - run and long - run determinants of the price of gold.” World
Gold Council.Available : https://www.gold.org/ Jun, 2006.
[18] E. J. Sherman. “New gold model explains variations.” Commodity Journal, vol:17, pp:16-20, 1982.
[19] E. J. Sherman. “A gold pricing model.” Journal of Portfolio Management, vol:9, pp:68-70, 1983.
[20] E. J. Sherman. “Gold investment: Theory and application.” New York: Prentice Hall, 1986.
[21] E. Tully and B. M. Lucey.“An apgarch investigation of the main influences on the gold price.”
Available: http://Ssrn.Com/Abstract=792205, 2005.
[22] F. Alpaslan, E. Tiring and E. Egrioglu. “An Investigation On The Number Of Hidden Layers For
Forecasting With Feedforward Artificial Neural Networks“, presented at Symposium of 7. Statisitcs Days, Ankara, Jun, 2010.
[23] F. I. Tascı. “Investigation of gold market with an econometric approach.” Unpublished master’s thesis. Gazi University, Ankara, 2010.
[24] F. Ozturk and S. Acıkalın. “Is gold a hedge against turkish lira?” South East European Journal of Economics and Business, vol:3, pp:35-40, issue:1, 2008.
[25] G. Ariovich. “The impact of political tension on the price of gold.” Journal For Studies in Economics
and Econometrics, vol.16, pp:17-37, 1983.
[26] G. E. Hinton, D. E. Rumelhart and R. J. Williams. “Learning Internal Representation by Back -
Propagating Errors”, In : Rumelhart D.E., McCleland J.L., The PDP Research Group, Paralel Distributed Processing:Explorations in the Microstructure of Cognition. MIT Press, MA, 1986.
[27] G. H. Moore. “Gold prices and a leading index of inflation.” Challenge, vol:33, pp:52-56, issue:4,
1990.
[28] G. Smith, “The price of gold and stock price indicates for the United States.” Available:
https://Www.Gold.Org/Download/Value/Stats/Research/Pdf/, 2001.
[29] G. Smith, “London gold prices and stock price indices in Europe and Japan.” Available:
https://Www.Gold.Org/Download/Value/Stats/Research/Pdf/, 2002.
487
The Art“, International Journal Of Forecasting, vol.14, pp:35-62, 1998.
[31] J. H. Chua, G. Sick and R. S. Woodward. “Diversifying with gold stocks.” Financial Analysts Journal,
vol:46, pp:76-79, issue:4, 1990.
[32] J. J. Hopfield. “Neural networks and physical sistems with emergent collective computational
abilities”, Apr, 1982.
[33] L. A. Sjaastad. “The price of gold and the exchange rates: Once again.” Available:
http://www.is.uwa.edu.au/__Data/Assets/Pdf_File/0011/98660/07_20_Sjaastad.Pdf , 2008.
[34] L. Fausett and Laurene. “Fundamentals Of Neural Networks”, Prentice Hall, 1994.
[35] L. Lili and D. Chengmei. “Research of the influence of macro-economic factors on the price of gold.”
Procedia Computer Science, vol:17, pp:737-743, 2013.
[36] L. Sjaastad and F. Scaccivvillani. “The price of gold and the exchange rate.” Journal of International
Money and Finance, 15, 879-897, 1996.
[37] M. Aksoy and N. Topcu. “The relationship between gold with stock certificate and inflation,” Journal
of Ataturk University Economics and Administrative Sciences, vol.27, pp:59-78, issue:1, 2013.
[38] M. G. Vural. “Gold market and the factors affecting gold price.” Ankara : The Central Bank of the
Republic of Turkey, Market General Directorate, 2003.
[39] M. Menase. “Gold market and analysis of factors affecting gold price in Turkey.” Unpublished
master’s thesis, Marmara University, İstanbul, 2009.
[40] M. Minsky and S. Papert. “Perceptrons”, MIT Press, Cambridge, MA, 1969.
[41] M. P. Dooley, P. Isard and M. P. Taylor. “Exchange rates, country-specific shocks, and gold.” Applied
Financial Economics, vol:5, pp:121-129, issue:3, 1995.
[42] M. Rosenblatt. “A multi-dimensional prediction problem” . Ark. Mat., vol.3, pp:407 – 424, 1958.
[43] M. Sefa. “Econometric analysis of gold price in Turkey” Unpublished master’s thesis. Gazi Universty,
Ankara, 2013.
[44] R. D. Laurent. “Is there a role for gold in monetary policy?.” Economic Perspectives(Federal Reserve
Bank of Chicago), vol:18, pp:2-14, 1994.
[45] S. A. Baker and R. C. Tassel. “Forecasting the price of gold: A fundamentalist approach.” Atlantic
Economic Journal, vol.13, pp:43-51, issue:4, 1985.
[46] S. Mahdavi and S. Zhou. “Gold and commodity prices as leading indicators of inflation : Tests of
long-run relationship and predictive performance.” Journal of Economics and Business,vol:49, pp:475-489, 1997.
[47] T. D. Kaufmann, and R. A. Winters. “The price of gold: A simple model.” ResourcesPolicy, vol:15,
pp:309-313, 1989.
[48] T. Kohonen. “Self - Organizing Maps,” Springer Series In Information Sciences, vol. 30, Springer, Heidelberg, 1st ed., 1995: 2nd ed., 1997.
[49] W. S. McCulloch and W. Pitts. “A logical calculus of the ideas immanent in nervous activity”. Bull.
Math. Biophys. vol.5, pp:115-133, 1943.
[50] World Bulletin. Available :