1
Energy Efficiency Led reduced CO
2
Emission in Green
LTE Networks
Kapil Kanwal
1, Ghazanfar Ali Safdar
2, Masood UrRehman
3 1, 2, 3 Institute of Research in Applicable ComputingSchool of Computer Science and Technology, University of Bedfordshire, Luton, LU1 3JU, UK
Abstract
The technological advancements in smart phones and their applications have rapidly raised the number of users and their data demands. To fulfil enlarged user’s data requirements, Basestation (BS) engages their resources over prolong time intervals at the cost of increased power consumption. In parallel, operators are expanding network infrastructure by employing additional BSs which also adds in power consumption. This directly increases carbon emission (CO2) thus
results in to more global warming. Therefore, Information and Communication Technology (ICT) has become major contributor in global warming while mobile communication is one of the key contributors within ICT. This paper investigates reduced CO2 emission through decreased power consumption in LTE networks. Proposed energy saving
scheme is validated through the analysis of various performance related parameters in MATLAB. Results have proven that
proposed scheme reduces CO2 emission by 2.10 tonnes per BS.
Keywords: LTE Networks, Energy efficiency, Green Communication, Carbon Emission.
1. Introduction
Mobile communication has gone through incredible enhancements to support Quality of Service (QoS) of various applications with enlarged mobile users. To handle with these necessities, many wireless technologies have been introduced which covers small area with fewer number of users to the lengthy coverage with thousands of users. One of these technologies is known as Long Term Evolution (LTE) which fulfils higher data rate requirements and provides ubiquitous network coverage with adequate QoS. LTE network has been deployed by numerous vendors to satisfy higher data requirements of growing users. Importantly, these requirements are fulfilled at the cost of increased power consumption by BSs which adds in increased global warming. According to research, global ICT systems consume approximately 1200 to 1800 Terawatts per hour of electricity annually [1]. Importantly mobile communication industry is accountable for more than one third of this power consumption in ICT due to the increased data requirements, number of users and coverage length. Applying these values to global warming, telecommunication is responsible for 0.3 to 0.4 percent of worldwide CO2 emissions [2]. Additionally, user data volume is expected to increase by a factor of 10 every five years which results in 16 to 20 percent increase in associated energy consumption [3]. In this view, mobile industry faces
a prodigious sustainable development problem in power consumption. Noteworthy, BSs are responsible for approximately 60% of total power consumption in LTE network [4]. To meet these challenges, green communication has become key research area in mobile industry. Several researchers have introduced various energy efficient schemes which help reduce power consumption and lessen CO2 emissions. Said schemes offer reduced power consumption through employment of various methods, i.e. deactivation of BS operations during off peak time, load balancing, carrier aggregation and bandwidth expansion. Existing energy efficient proposals in literature proves that energy saving at the BS is one of the major research area in wireless networks, because it has excessive potential to improve energy efficiency. Dynamic power consumption can be reduced through discontinuing transmission during lightly loaded condition [5]. On the same lines resource blocks carrier aggregation can also help reduce power consumption [6]. Said methods aggregates two resource blocks and turn off idle resources during off peak time periods. Next to this distance ware schemes involve turning off BSs based on load information [7]. Centralized methods also help reduce dynamic power consumption through migration of users from heavily loaded cells to lightly loaded cells [8]. In the same context, another work in [9] employs cell sectorization to reduce power consumptions. Though existing proposals offer energy savings, however there is no significant work in literature which investigates the impact of energy saving on greener communication. Based on our previously proposed energy
on Energy Web
and Information Technology
Research Article
Receivedon 19 September 2017;acceptedon 20 September 2017;publishedon04 October 2017
Copyright© 2017 Kapil Kanwal et al., licensedto EAI. Thisisanopenaccess articledistributedunderthetermsofthe Creative Commons Attribution license (http://creativecommons.org/licenses/by/3.0/), which permits unlimited use,distributionandreproductioninanymediumsolongastheoriginalworkisproperlycited.
doi:10.4108/eai.4-10-2017.153160
EAI Endorsed Transactions on Energy Web and Information Technology 07 2017 - 2017 |Volume 4 |Issue 1|e2
performance through the analysis of radio link failure, carbon emission reduction and energy saving. Rest of the paper is organized as follows.
Following introduction section in 1, section 2 presents physical layer aspects of LTE networks. Section 3 briefly highlights our proposed REHO scheme while performance analysis is discussed in section 4. Paper is finally concluded in section 5.
2. Physical layer in LTE
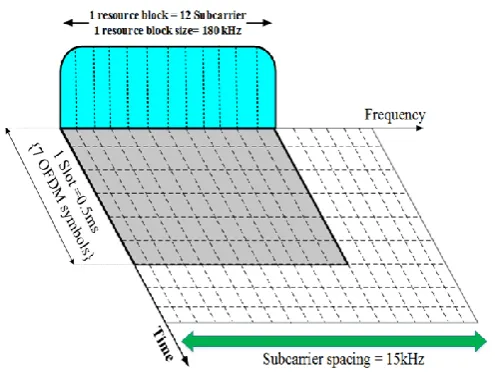
LTE physical layer uses various frames for data and control information transmission. Each frame of 10ms duration is further subdivided into 10 sub-frames, each being 1ms long. Further each sub-frame is divided into two slots, sized 0.5 ms which contains one resource block (RB) whereas total number of resources depends on transmission bandwidth. Each RB consists of a total 72 Resource Elements (RE) which is the smallest resource unit. REs aggregate into RB; there are 12 REs per symbol while there are 6 to 7 symbols in each RB as shown in Figure 1[11]. OFDMA uses large number of narrowband multi subcarriers instead of wideband. For example, in HSPA with 20 MHz the overall transmission bandwidth consists of 4 subcarriers each with 5 MHz, in contrast OFDMA transmission may employ hundreds of subcarriers which transmitted over same radio link to the receiver. The number of subcarriers could range from few hundreds to the several thousand with subcarrier spacing ranging from few kHz to a several hundred-kHz depending on type of environment. Due to the orthogonality; two subcarriers do not effect from any interference between each other after demodulation [12].
Figure 1. OFDMA Architecture
In LTE, overall bandwidth ranges from 1.4, 3, 5 10, 15, 20 MHz while these bandwidths allow 6, 15, 25, 50, 75 and 100 resource blocks respectively. The BS allocate resources to
3
BCCH DCCH CCCH DTCH MCCH MTCH
PCH BCH DL-SCH MCH
PMCH PBCH
PDCCH PDSCH PCFICH PHICH
PCCH LOGICAL
CHANNELS
TRANSPORT CHANNELS
PHYSICAL CHANNELS
MAC LAYER
PHYSICAL LAYER
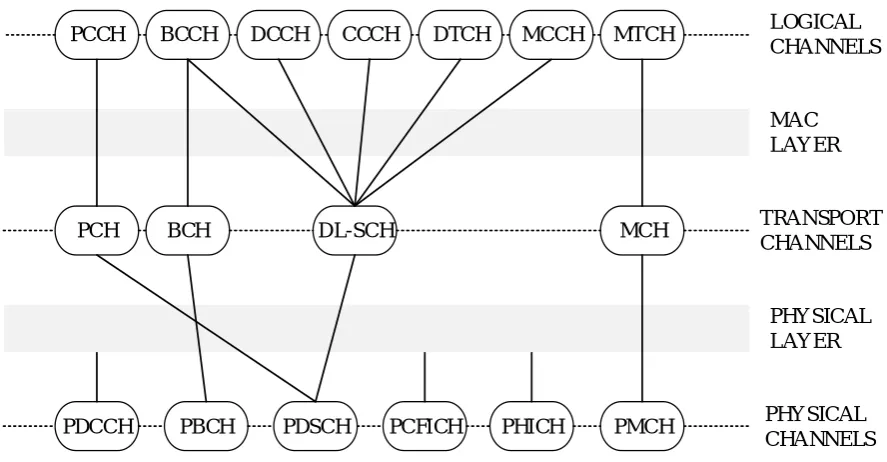
Figure 2. Physical and MAC Layers in LTE
3. REHO Scheme
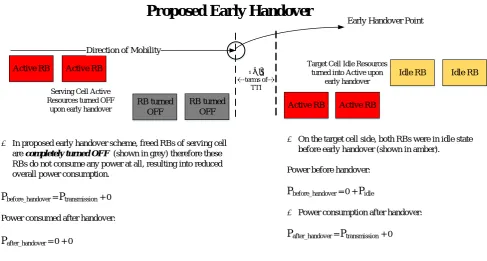
REHO scheme employs the concept of early handover for energy saving purpose. In LTE networks, all BSs transmit cell specific reference signals (RSs), which are used to measure reference signal received power (RSRP) at receiver end. When user enters in coverage area of neighbour cell, it measures RSRP from both serving and neighbour cell. RSRP of neighbour cell becomes better then serving cell when user becomes closer to the neighbour cell thus triggering A3 event which results in to handover. There are three key parameters (Hysteresis, offset and Time to Trigger) involved in handover process, whereas REHO initiates early handover through appropriate tuning of hysteresis parameter. Early handover helps resources to become idle earlier which can be turned off for energy saving. REHO offers 35 percent energy saving as compared to standard LTE networks,
which helps reduce 35 percent CO2 emission [10]. Figure
3 presents working of our REHO in comparison with LTE standard LTE network. In our proposed REHO resources blocks are turned off right after early handover of users to target cell (Figure 3).
3.1 CO2 Emission
The CO2 emission is measured in km2 while its amount of emission purely relies on type of fuel used to produce electricity. Figure 4 presents different types of fuels currently used in electricity production and describes CO2 emission (in grams) in line with fuel types. Importantly, gas and coal are main fuels used in electricity production
which produces 960 and 443 Grams carbon per kWh respectively [16]. Accordingly, CO2 emission can be calculated by multiplying total power consumption (kWh) with percentage of each fuel and associated CO2 grams produced (Figure 4).
3.2 Power model
BS consists of Power Amplifier (PA), Radio Frequency (RF), Baseband (BB), DC to DC, AC to DC, Cooling system and Antennas Interface [17]. Power amplifier in BS is main power-hungry part, around 60 percent, while its power consumption is straightforwardly affected by data rate and resources utilization [17]. Figure 5 presents breakdown of power consumption by different sections inside the BS.
3.3 Mobility model
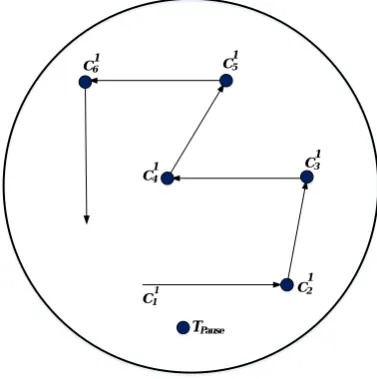
Proposed energy saving scheme is investigated and compared with typical LTE network using random way point mobility model (RWP), where each user firstly selects one random point, then starts moving towards selected point at fixed speed. Upon arrival of selected point, user waits for predefined time and then again selects another random point to complete mobility cycle as shown in Figure 6 [18, 19]. This process continues until random way point mobility model has completed predefined period. Said mobility model is employed to analyse REHO in realistic LTE scenario. Figure 6 clearly shows working of random way point mobility model in our system model. The key parameters used in RWP are presented in performance analysis section.
Active RB
Active RB Idle RB Idle RB
Direction of Mobility
· On the target cell side, both RBs were in idle state before handover (shown in amber).
Power before handover: : Pbefore_handover = 0 + Pidle
· Power consumption after handover: Pafter_handover = Ptransmission + 0 Total Power = Ptransmission + Pidle
· On the serving cell side, two UEs each having 1 active RB (shown in red) are heading towards target cell B.
Power consumed by active RBs before handover: Pbefore_handover = Ptransmission + 0
· After handover, active RBs turn in to idle RBs (shown in amber above), thus accordingly Ptransmission becomes zero. Power after handover:
Pafter_handover = 0 + Pidle
Total power consumption of two BSs (Serving & Target) - Ptotal = 2* Ptransmission + 2* Pidle Active RB
Active RB Idle RB Idle RB
Standard Handover
Active RB Active RB
Idle RB Idle RB Direction of Mobility
Active RB Active RB
RB turned OFF
RB turned OFF
Early Handover Point
3GPP Standard Handover
Proposed Early Handover
· In proposed early handover scheme, freed RBs of serving cell are completelyturned OFF (shown in grey) therefore these RBs do not consume any power at all, resulting into reduced overall power consumption.
Pbefore_handover = Ptransmission + 0 Power consumed after handover: Pafter_handover = 0 + 0
· On the target cell side, both RBs were in idle state before early handover (shown in amber). Power before handover:
Pbefore_handover = 0 + Pidle
· Power consumption after handover:
Pafter_handover = Ptransmission + 0
Serving Cell (S)
Serving Cell (S) Target Cell (T)Target Cell (T)
Total power consumption of two BSs (Serving & Target) - Ptotal
=
2* Ptransmission + Pidle ∆T interms of TTI
Serving Cell Active Resources turned into
Idle upon handover
Target Cell Idle Resources turned into Active upon handover
Serving Cell Active Resources turned OFF
upon early handover
Target Cell Idle Resources turned into Active upon
early handover
5
40%
30% 19%
9% 2%
Gas Coal Nuclear Renewable Other fuels
0 200 400 600 800 1000
Gas Coal Nuclear Renewable Other fuels
Grams/ kWh
Figure 4. Fuels used in electricity production and associated CO2 emission
4. Performance Analysis
Proposed scheme is validated though comparative analysis with typical LTE standard based on 3GPP in MATLAB. The system model consists of LTE network based on RAN and EPC configured in densely deployed scenario. Network consists of 7 cells, where 50 users randomly distributed per cell. Each BS covers up to 1000 meters with overlapping areas with neighbour cells. The total number of users is uniform in all cells. Table 1 presents detailed performance analysis related parameters based on 3GPP specifications [20, 21]. Various performance related parameters including dynamic power consumption, radio link failure and Carbon emission are investigated to validate proposed work. Importantly dynamic power consumption is calculated at Downlink BS.
6%
8%
6%
10%
10%
60%
DC-DC AC-DC RF Cooling Baseband PA
Figure 5. Breakdown of BS power consumption
C1
C2
C3
C4
C5
C6
TPause 1
1
1
1 1
1
Figure 6. Random Way point model
Table 1. This is a legend. Caption to go above table
Parameters Values Parameters Values
Frequency 2.14 GHz Bandwidth 20MHz
No. PRBs 100 No. of cells 7
No. Users 50/cells SINR 6.3 dB
BS coverage 1000m Hysteresis 1, 4dBm
Max. Trans. 40W User speed 40km/h
No. of RBs 100 Mobility model RWP/SW
Run time 500sec Time Pause 5sec
BS coverage 1000m Hysteresis 1, 4dBm
No. of Antennas
4x4 Path loss Log
normal
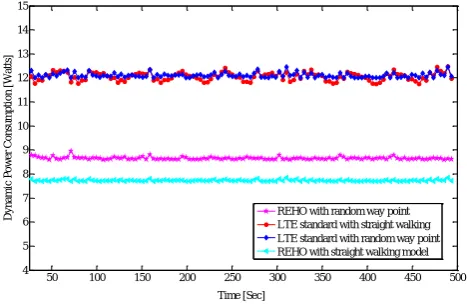
REHO and LTE standard are compared for dynamic power consumption both for Straight Walking (SW) and RWP models in Figure 7. In standard LTE, resource blocks remain active both in idle and busy state. Therefore, it is evident that LTE standard results into same level of power consumption irrespective of the mobility models. However, it is found that SWM favours REHO scheme more (around 7.8 Watts consumption) compared to the realistic RWP mobility model (around 8.8 Watts consumption). Point to be noted that RWP is more realistic mobility model where user randomly changes direction while in SW model user only moves in one straight direction.
50 100 150 200 250 300 350 400 450 500 4
5 6 7 8 9 10 11 12 13 14 15
Time [Sec]
D
yna
m
ic
P
ow
e
r Cons
um
pt
ion [W
a
tt
s]
REHO with random way point LTE standard with straight walking LTE standard with random way point REHO with straight walking model
Figure 7. Dynamic power consumption
4.2 Radio Link Failure
Since proposed scheme achieves reduced power consumption, i.e. higher energy efficiency by reduced early handover, thus it is very important to investigate the effect of radio link failure. Figure 8 plots RLF both for proposed and benchmark systems for random way point mobility model. Clearly, RLF fluctuates considerably a lot due to increased mobility, however on average it remains around 8 percent for proposed scheme compared to 3 percent RLF for the benchmark systems.
50 100 150 200 250 300 350 400 450 500 0%
1% 2% 3% 4% 5% 6% 7% 8% 9%
Time [Sec]
Ra
di
o L
ink F
a
il
ure
Benchmark with random way point model Proposed scheme with random way point model
Figure 8. Radio link failure
Figure 9 plots mean relation between performance analysis parameters (i.e. energy saving and RLF) with varying hysteresis. Noteworthy the lowest limit of the hysteresis (1 dBm) offers highest energy saving with highest radio link failure up to approximately 5 percent, while on the other hand highest value of hysteresis (6 dBm) offers lowest energy saving with minimum radio link failure up to approximately 1.3 percent. Clearly the mean values of hysteresis offer fair balance between energy saving and RLF as shown in Figure 9.
20 25 30 35
Hysteresis
E
ne
rgy
S
a
vi
ng
[%
]
1 2 3 4 5 6 1
2 3 4 5 6
R
a
di
o
L
ink
F
a
il
ur
e
[
%
]
Energy Saving Radio link Failure
Figure 9. Mean of energy saving and RLF in REHO
4.4 Carbon Emission
Research has shown that average power consumption of one BS is approximately 1500W, which produces approximately 6 tonnes CO2. However, the minimum 35 percent reduced power consumption through REHO helps operators cut down CO2 emission by approximately 2.10 tonnes per BS as shown in Figure 10. Importantly the total amount of CO2 reduction increases with enlarged number of BS (Figure 10). This helps operator to stay Green thorough reduced carbon emission.
1 5 10 15 20 25 30 35 40 45 50
0 50 100 150 200 250 300
Basestations
C
ar
bon
E
m
is
si
on
[T
one
s]
Benchmark-Carbon Emission REHO-Carbon Emission
7 Table 2 presents annual profit achieved through REHO and standard LTE. Notable annual expenses directly effects vendors profit. Initially data rate is allocated to each BS per km2 which is further distributed over total number of users per km2. Next to this, user's month tariff is calculated which is further used for annual revenue
estimation. Annual expenses depend on various operational and capital expenditures. Table 2 present total annual expenses per km2 [22]. Importantly Table 2 can be used as a ground for researchers to investigates vendors profits in relation to various reduced expenses per km2.
Table 2. Annual Revenue and Expenses in REHO vs LTE Standard
LTE standard network
Dat a Ra te MB/s /km 2 UE /km 2 MB/s /U E G B/Mon th /UE E q u iva lent tar if f ( G B) T ar if f cost / ye a r T ar if f cost /y ea r * To tal No of UE s E xpen s e/k m 2 P ro fit /km 2
10 1000
0.01 0.02 0.03 0.04 0.05 0.06 0.07 0.08 0.09 0.1 25.92 unlimited unlimited unlimited unlimited unlimited unlimited unlimited unlimited unlimited unlimited
£360 £360 k £193.01 k £166.98 k
20 1000 51.84 £360 £360 k £193.06 k £166.94 k
30 1000 77.76 £360 £360 k £193.09 k £166.90 k
40 1000 103.68 £360 £360 k £193.12 k £166.87 k
50 1000 129.6 £360 £360 k £193.15 k £166.84 k
60 1000 155.52 £360 £360 k £193.17 k £166.82 k
70 1000 181.44 £360 £360 k £193.19 k £166.80 k
80 1000 207.36 £360 £360 k £193.21 k £166.78 k
90 1000 233.28 £360 £360 k £193.23 k £166.76 k
100 1000 259.2 £360 £360 k £193.25 k £166.74 k
REHO Dat a Ra te MB/s /km 2 UE /km 2 MB/s /U E G B/Mon th /UE E q u iva lent tar if f ( G B) T ar if f cost / ye a r T ar if f cost /y ea r * T o tal No of UE s E xpen s e/k m 2 P ro fit /km 2
10 1000
0.01 0.02 0.03 0.04 0.05 0.06 0.07 0.08 0.09 0.1 25.92 unlimited unlimited unlimited unlimited unlimited unlimited unlimited unlimited unlimited unlimited
£360 £360 k £192.71 k £167.28 k
20 1000 51.84 £360 £360 k £192.75 k £167.24 k
30 1000 77.76 £360 £360 k £192.78 k £167.21 k
40 1000 103.68 £360 £360 k £192.80 k £167.19 k
50 1000 129.6 £360 £360 k £192.82 k £167.17 k
60 1000 155.52 £360 £360 k £192.84 k £167.15 k
70 1000 181.44 £360 £360 k £192.86 k £167.13 k
80 1000 207.36 £360 £360 k £192.88 k £167.11 k
90 1000 233.28 £360 £360 k £192.89 k £167.10 k
100 1000 259.2 £360 £360 k £192.91 k £167.08 k
In modern mobile industry, there is rapid growth in number of mobile users and required data rate. Advancement in applications and smart phones demand higher data rates. Research has proven that these figures are going to be double after every five years. Increased data rate is provided at the cost of increased power consumption. Therefore, provision of such services at competitive prices has become major challenge for vendors. The increased data rate not only reduces operators profit but also results in to higher CO2 emission which leads toward greater global warming. Importantly ICT has become major contributor in global warming and has been attracted by many researchers. In this context, this work has investigated our previously proposed REHO scheme considering energy saving impacts on CO2 emission and offer insight by thoroughly analyzing performance analysis parameters. Various parameters i.e. dynamic power consumption, radio link failure and CO2 emission etc have been analyzed to validates proposed work. Results demonstrates that 35 percent energy saving achieved through REHO significantly reduce CO2 emission thus helps vendor to stay greener.
References
1. M. P. Mills, The Cloud Begins with Coal: Big Data, Big Networks, Big Infrastructure, and Big Power. Washington, DC, USA: National Mining Association, 2013.
2. R. Mahapatra, Y. Nijsure, G. Kaddoum, N. Ul Hassan and C. Yuen, "Energy Efficiency Tradeoff Mechanism Towards Wireless Green Communication: A Survey," in IEEE Communications Surveys & Tutorials, vol. 18, no. 1, pp. 686-705, First quarter 2016.
3. R. Tafazolli et al., “eMobility Mobile and Wireless Communications Technology Platform: Strategic Applications Research Agenda,” NetWorks European
Technology Platform, July 2010,
http://www.networksetp. Eu.
4. T. Chen, Y. Yang, H. Zhang, H. Kim and K. Horneman, "Network energy saving technologies for green wireless access networks," in IEEE Wireless Communications, vol. 18, no. 5, pp. 30-38, October 2011.
5. P. Frenger, P. Moberg, J. Malmodin, Y. Jading, and I. Godor, “Reducing energy consumption in LTE with cell DTX,'' in Proc. IEEE 73rd Veh. Technol. Conf. (VTC Spring), May 2011, pp. 1-5.
6. F. Liu, K. Zheng, W. Xiang, and H. Zhao, “Design and performance analysis of an energy-efficient uplink carrier aggregation scheme,'' IEEE J. Sel. Areas Commun., vol. 32, no. 2, pp. 197-207, Feb. 2014. 7. A. Bousia, E. Kartsakli, L. Alonso, and C. Verikoukis,
“Dynamic energy efficient distance-aware base station switch on/off scheme for LTE-advanced,'' in Proc.
8. L. Li, Y. Zhang, B. Fan, and H. Tian, “Mobility-aware load balancing scheme in hybrid VLC-LTE networks,'' IEEE Commun. Lett., vol. 20, no. 11, pp. 2276-2279, Nov. 2016.
9. M. F. Hossain, K. S. Munasinghe, and A. Jamalipour, “Toward self-organizing sectorization of LTE eNBs for energy efficient network operation under QoS constraints,'' in Proc. IEEE Wireless Commun. Netw. Conf. (WCNC)0, Apr. 2013, pp. 1279-1284.
10. K. Kanwal and G. A. Safdar, "Reduced Early Handover for Energy Saving in LTE Networks," in IEEE Communications Letters, vol. 20, no. 1, pp. 153-156, Jan. 2016.
11. M. A. Seimeni, P. K. Gkonis, D. I. Kaklamani, I. S. Venieris and C. A. Papavasiliou, "Resource management in OFDMA heterogeneous network," 2016 Wireless Telecommunications Symposium (WTS), London, 2016, pp. 1-6.
12. M. Wang et al., "The Evolution of LTE Physical Layer Control Channels," in IEEE Communications Surveys & Tutorials, vol. 18, no. 2, pp. 1336-1354, Secondquarter 2016.
13. 3GPP TS 25.814, “Physical Layer Aspects for Evolved Universal Terrestrial Radio-Access (UTRA),” Rel. 7.
14. http://www.ee.columbia.edu/~roger/LTE_PHY_funda mentals.pdf
15. 3GPP TS 36.321, “E-UTRA Medium Access Control (MAC) Protocol Specification,” Rel. 8
16. K. Sovacool," Valuing the greenhouse gas emissions from nuclear power: A critical survey," in Elsevier Energy Policy, vol.36, pp. 2940-2953,. 2008
17. K. Liu, J. He, J. Ding, Y. Zhu and Z. Liu, "Base station power model and application for energy efficient LTE," Communication Technology (ICCT), 2013 15th IEEE International Conference on, Guilin, 2013, pp. 86-92.
18. L. Hanzo II, S. M. Mostafavi and R. Tafazolli, "Connectivity-Related Properties of Mobile Nodes Obeying the Random Walk and Random Waypoint Mobility Models," Vehicular Technology Conference, 2008. VTC Spring 2008. IEEE, Singapore, 2008, pp. 133-137
19. C. Bettstetter, G. Resta and P. Santi, "The node distribution of the random waypoint mobility model for wireless ad hoc networks," in IEEE Transactions on Mobile Computing, vol. 2, no. 3, pp. 257-269, July-Sept. 2003
20. 3GPP, "3rd Generation Partnership Project; Technical Specification Group Radio Access Networks; Radio Frequency (RF) system scenarios", TR 25.942 V9.0.0 21. 3GPP, "Evolved Universal Terrestrial Radio Access
(E-UTRA) and Evolved Universal Terrestrial Radio Access Networks (E UTRAN): Overall description", TS 36.300, V10.4.0.