INDUSTRIAL MANAGEMENT
Juuso Puroila
Developing material forecasting process in a case company
Master’s Thesis in Industrial Management
TABLE OF CONTENTS
ABBREVIATIONS ... 4
LIST OF FIGURES ... 5
LIST OF TABLES ... 6
LIST OF MATHEMATICAL FORMULAS ... 7
ABSTRACT ... 8
TIIVISTELMÄ ... 9
1 Introduction ... 10
1.1 Background ... 10
1.2 Objectives and limitations ... 11
1.3 Research questions ... 12
1.4 Structure of the research ... 12
1.5 Research orientation ... 13
2 LITERATURE REVIEW ... 14
2.1 The field of Materials Management ... 14
2.1.1 Material Requirements Planning ... 17
2.1.2 Enterprise Resource Planning (ERP) ... 20
2.2 Forecasting and managing demand ... 21
2.2.1 Forecasting process ... 23
2.2.2 Forecasting methods ... 25
2.2.3 Selecting a forecasting method ... 30
2.2.4 Monitoring and Controlling forecasting methods ... 32
2.2.5 Combining forecasts ... 33
3. Research Methodology ... 35
3.1 Methodology ... 35
3.2 Data Collection ... 36
3.4 Data processing ... 40
4. The results of the research ... 43
4.1 Case company and current situation ... 43
4.1.1 Company introduction ... 43
4.1.2 Current situation of the forecasting process ... 44
4.1.3 SWOT analysis of the previous forecasting methods ... 48
4.2 The developed forecasting method ... 50
4.2.1 The new forecasting method ... 50
4.2.2 SWOT analysis of the developed method ... 55
4.2.3 Comparison and evaluation of the developed and the previous forecasting methods ... 57
5. Conclusions and discussion ... 61
REFERENCES ... 64
ABBREVIATIONS
PTS – Purchase to Stock
PTO – Purchase to order
SCM – Supply Chain Management
MM – Materials Management
PLM - Product Lifecycle Management
CRM - Customer Relationship Management
MRP – Material Requirements Planning
MRP II – Manufacturing Requirements Planning
ERP – Enterprise Resource Planning
BOM – The Bill of materials
MSP - The master production schedule
SAP – The ERP system of the case company
MAD – The mean absolute deviation
MAPE – The mean absolute percent error MSE – The mean square error
LIST OF FIGURES
Figure 1. The concept of Materials Management ... 17
Figure 2. The Structure of MRP system... 19
Figure 3. Evolution of Enterprise Resource Planning (ERP). ... 21
Figure 4. The process of forecasting ... 25
Figure 5. The case study process ... 36
Figure 6. The process flow. ... 41
Figure 7. The structure of the SWOT analysis ... 42
Figure 8. Materials Management of the case company ... 44
Figure 9. An example of Moving averages ... 46
Figure 10. Forecasting by using moving average ... 46
Figure 11. Material requirements in the SAP. ... 47
Figure 12. The combination of moving average and predictor’s estimate. ... 47
Figure 13. Demand budget. ... 52
Figure 14. The calculation of average consumption per order ... 53
Figure 15. Combining the sales forecast with moving averages ... 53
LIST OF TABLES
Table 1. Tasks of material management ... 16
Table 2. Qualitative forecasting methods ... 26
Table 3. Quantitative forecasting methods ... 28
Table 4. Meetings of the research ... 37
Table 5. The purposes of the meetings... 39
Table 6. SWOT analysis of the previous forecasting models ... 49
Table 7. SWOT analysis of the developed forecasting model. ... 55
Table 8. The information needed for the calculations of MAD and tracking signal ... 57
Table 9. The results of calculation of MAD and tracking signal ... 58
LIST OF MATHEMATICAL FORMULAS
Formula (1). Moving average ... 28
Formula (2). Exponential smoothing ... 28
Formula (3). The Simple linear model ... 29
Formula (4). Multiple linear regression ... 30
Formula (5). Forecast error ... 32
Formula (6). Mean absolute deviation (MAD) ... 32
Formula (7). Tracking signal ... 33
Formula (8). Mean square error (MSE) ... 33
Formula (9). Mean absolute error (MAPE) ... 33
Formula (10). Average consumption / order ... 52
______________________________________________________________________
UNIVERISTY OF VAASA Faculty of Technology
Author Juuso Puroila
Topic of the Master’s Thesis Developing material forecasting process in a case company
Instructor: Jussi Kantola
Degree: Master of Science in Economics
and Business Administration
Major subject Industrial Management
Year of Entering the University: 2013
Year of completing the thesis: 2018 Pages: 70
______________________________________________________________________
ABSTRACT
One of the main tasks of the materials management is to guarantee a sufficiently good service level for production to meet customer demand. In practice, this means delivering the materials at the right time in the right place in the right quantities. However, this task is very challenging, especially if material volumes and consumption fluctuations are high. One way to ensure a good service level to production is to forecast the demand for materials. This aims to anticipate and ensure that suppliers of materials and components are able to respond to the material needs of production.
The purpose of this study is to develop the material forecasting process in the case company. The aim is to improve the process by developing and implementing a suitable forecasting method and tool for case company's business environment. The theoretical framework of the research is largely based on the scientific literature of forecasting. The theory part also introduces the field and concept of Materials Management. The study is made in a close collaboration with the case company. The research method is case study and research can be characterized as a development study. The research material consists of meetings organized during the study and the statistical data from the case company's ERP system.
The study found that the case company's forecasting process was not effective and the forecasts were too much based on history. However, a suitable method and tool were created to enhance the forecasting process as a result of the development project. The method and tool are compatible with the case company's ERP system. The developed method has been put into operation in the company which shows the successful of the development project. However, the study calls continuous monitoring of the reliability of the developed forecasting method.
______________________________________________________________________
KEYWORDS: Forecasting, Forecasting method, Forecasting tool, Materials Management
______________________________________________________________________
VAASAN YLIOPISTO Teknillinen tiedekunta
Tekijä: Juuso Puroila
Tutkielman nimi: Materiaalien ennustamis-
prosessin kehittäminen case yrityksessä
Ohjaaja: Jussi Kantola
Tutkinto: Kauppatieteidenmaisteri
Pääaine: Tuotantotalous
Opintojen aloitusvuosi: 2013
Tutkielman valmistumisvuosi: 2018 Sivumäärä: 70
______________________________________________________________________
TIIVISTELMÄ
Materiaalin hallinnan yksi päätehtävistä on varmistaa riittävän hyvä palvelutaso tuotannolle. Käytännössä tämä tarkoittaa oikeiden materiaalien toimittamista oikeaan aikaan oikeaan paikkaan oikeina määrinä. Tehtävää voidaan pitää erittäin haastavana erityisesti kun materiaalien määrät ovat isoja ja niiden kysyntä vaihtelee jatkuvasti. Yksi tapa hyvänpalvelu tason varmistamiselle on materiaalien kysynnän ennustaminen.
Tämän tutkimuksen tarkoituksena on kehittää materiaalien ennustamisprosessia case yrityksessä. Tavoitteena on parantaa prosessia kehittämällä ja toteuttamalla materiaalien ennustamiseen sopiva menetelmä ja työkalu case yritykseen. Tutkimuksen teoreettinen viitekehys rakentuu pääosin ennustamiseen liittyvien teorioiden pohjalta. Teoriaosuudessa esitellään myös materiaalin hallinnan konsepti. Tutkimus tehdään tiiviissä yhteistyössä case yrityksen kanssa. Tutkimusmenetelmänä käytetään tapaustutkimusta. Tutkimusta voidaan luonnehtia myös kehitystutkimukseksi. Tutkimuksen aineisto koostuu tutkimuksen aikana järjestetyissä tapaamisissa syntyneistä havainnoista ja päätelmistä sekä tilastollisesta tiedosta, joka on kerätty yrityksen tuotannonohjaus järjestelmästä.
Tutkimuksessa selvitettiin, että case yrityksen ennustamisprosessi ei ollut tarpeeksi tehokas ja materiaaliennusteet pohjautuivat liikaa historiaan. Kehitystutkimuksen tuloksena saatiin kuitenkin luotoa menetelmä ja työkalu, joilla ennusteprosessia saatiin tehostettua case yrityksessä. Kehitetty menetelmä ja työkalu ovat yhteensopivia case yrityksen tuotannonohjausjärjestelmän kanssa. Ne on otettu käyttöön yrityksessä, mikä kertoo kehitysprojektin onnistumisesta. Tutkimus kuitenkin kehottaa kehitetyn menetelmän luotettavuuden jatkuvaa seurantaa.
______________________________________________________________________
AVAINSANAT: Ennustaminen, Ennustemenetelmä, Ennustetyökalu, Materiaalinhallinta
1 Introduction
1.1 Background
“ The efficiency of any organization depends on the availability of component parts and materials in the proper quantity, quality, price, range and time” (Shridhara Bhat 2009). Thus, the lack of components or any material used in manufacture can cause significant problems in industrial company. Even the absence of a small component may stop the entire production line. Therefore, in the worst case, the lack of materials may lead to delays in deliveries which in turn can lead additional costs, customer dissatisfaction and negatively affect the company’s reputation. This is emphasized in a large company that manufactures bigger products from small components. In that case, the company’s material flow may include thousands of different components and parts. Therefore the management of materials can be considered as one of the most critical success factors in supply chain of organization.
The main task of Materials Management is to provide the best service level for manufacture while keeping a stock value at an agreed level. That requires constant cooperation and communication with suppliers. Because of the fluctuations in material demand and constantly changing product structures increases the risk of the shortage of materials. The long delivery and transportation times of complex materials add more challenges to the Materials Management.
However, the disadvantages caused by the lack of materials can be prevented by a successful forecasting process. By managing and forecasting material consumption the organization can help their component suppliers to respond to the future demand. Because of that forecasting can be considered one of the most important tasks in the department of Materials Management. However, forecasting is very challenging process which generally requires a lot of knowledge and skill to combine information about the predictable phenomenon.
1.2 Objectives and limitations
This research is done in cooperation with a large global case company. The study focuses on a company’s unit in Finland. The main purpose of the research is to develop the supplier forecasting process in that unit. The work is directed at the unit's electrification factory. The high volume of components in electrification factory increases the importance of this study. Also the suppliers strong reliance on forecasts increases the development needs. Moreover, it has been found that the forecasting process needs development activities in electrical factory.
The aim of the study is to create new forecasting model that is suitable for the operating environment of the object. The purpose of the new model is to simplify the forecasting process and improve the efficiency of forecasting. By simplifying the process, the company will no longer need to spend so much resources on forecasting. In turn improving forecasting density would help suppliers better respond to demand fluctuations in the future.
The aim of the research is to find out the different models of forecasting and their suitability of the operating environment to be studied. Appropriate forecast models are searched on the basis of the theoretical framework. Company’s internal forecasting models are also used to support research. The best result is achieved by examining the development needs of the forecasting process and by creating and implementing the development proposals.
The aim of the work is also to develop a tool for forecasting. The aim is that the tool will be able to make reliable material forecasts for all suppliers. The tool should be easy to use to reduce the resources available for forecasting. The tool should also include all predictable materials.
This study is confined to exploring only the operating environment of the object. The new forecast model is being applied precisely to this environment and may not be applicable elsewhere. The study is limited to examining only predictable materials, in this case it means materials to be stocked in other words purchase to stock (PTS) materials.
Customized product specific materials, purchase to order (PTO), will not take into account.
1.3 Research questions
To meet the objectives, the research tries to answer the next questions. The main question of the research is: How the case company’s forecasting process could be developed? To find the best answer to this question the study must first answer the following sub questions:
- What kind of forecasting methods have been presented in previous studies?
- What are the current forecasting methods in case company?
- What are the main development needs of the forecasting process in case company?
- What are the measures to respond to development needs?
The answer to the first sub-question is obtained through the theoretical framework. The answer to the other sub-questions is gained through the case company's internal information and network. The answer to the main question of the study is obtained by combining the information acquired with sub-questions.
1.4 Structure of the research
The research is divided into five main sections. The first section contains an introduction of the study. This reflects the background, objectives and research problems of the aid. The introduction also reveals what the issues are in the study and what is left out of the research. The second part discusses the theory of the research topic. It seeks to create a theoretical starting point for the whole research.
The third section deals with the methodology of the research. It presents the data collection and analysis methods used in the study. The fourth chapter presents the results of the study. It presents the key features of the previous and developed forecasting methods, as well as their comparison and evaluation.
The fifth is the final words of the study. These reveal the findings and conclusions of the research. There will also be presented potential further research topics.
1.5 Research orientation
This research is a case study that is targeted at a previously mentioned real life company. According to the nature of the research topic, case study is best suited method to this research. In addition, the study is intended to investigate exclusively the process of the case company. The data sources of the study are the several employees of the company and the company's internal information system. The research is also partly based on observations, which has emerged previously while the researcher has been in employment with the company.
This research can be regarded as a development project that addresses the problem of the real working life in the case company’s business environment. The purpose of the development project is to develop the case company's forecasting process. In addition to the researcher, a number of employees of the case company are involved in the development project.
The development project consists of several meetings and analysis of statistical data. Meetings and analytics are used to find a suitable forecasting method that is compatible with the case company's information system. It can be said that the research was done in a strong collaboration with the case company.
2 LITERATURE REVIEW
Following section describes the fundamental theories about material forecasting and related elements. This section creates a theoretical framework for empirical research. As priming for forecasting theories are dealt with the organization's material management and planning which are strongly related to material forecasts. Forecasting theories create a comprehensive theoretical starting point that will later be linked to practical work.
2.1 The field of Materials Management
Globalization has brought new opportunities for purchasing materials and components around the world. The consolidation of the Internet and e-commerce has also increased the potential of communication and global trading. At the same time, the challenges of managing material flows have increased. In organizations, these functions are managed through Supply Chain Management (SCM). SCM is also combined with all other activities that enable consumers to get the final product or service. (Sakki 2014.)
An increasing proportion of the turnover of industrial companies consists of purchased materials. Thus, the company's ability to manage purchases and materials is directly proportional to its result. The efficiency of an organization depends on the availability of components and materials. During the last few years it has been seen necessary that the company’s material flow is managed by a unit or a team. This unit is generally referred to as Materials Management (MM). The unit is managed by the Materials Manager. All the functions of bringing materials to production are combined under the Materials Management. (Bhat 2009.)
There are many different definitions for material management in the literature. A few definitions are shown below:
1) Bailey et al (1994) defined that Materials Management is the “management of the flow of materials into an organization to the point where those materials are converted into the form's end product(s)”.
2) Chunawalla (2008) defined the material management as the one responsible for the entire material cycle, which consists of parts such as purchase, inventory management, reception and inspection, transportation, physical distribution and material handling. (Chunawalla 2008.)
3) One simple definition is that The “Materials Management is the process of management which coordinates, supervises and executes tasks associated with flow of materials to, through and out of an organization.” (Bhat 2009.)
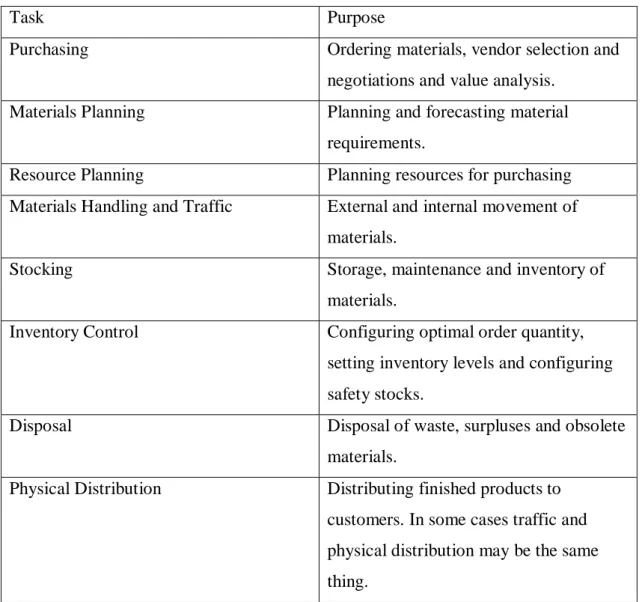
SCM is generally seen as a bigger totality than MM. SCM includes, in addition to Materials Management, manufacturing, data transfer and financial transactions. (Viitala 2013). Thus, the Materials Management can be considered as one of the SCM’s tasks. Material Management is usually associated with three main tasks: purchasing materials, stocking and material handling. Understanding the importance of MM has clarified and expanded its tasks. (Chunawalla 2008). Table 1 shows the most typical Materials Management responsibilities today.
Table 1. Tasks of material management. (Adapting Chunawalla 2008: 3).
Task Purpose
Purchasing Ordering materials, vendor selection and
negotiations and value analysis. Materials Planning Planning and forecasting material
requirements.
Resource Planning Planning resources for purchasing Materials Handling and Traffic External and internal movement of
materials.
Stocking Storage, maintenance and inventory of
materials.
Inventory Control Configuring optimal order quantity, setting inventory levels and configuring safety stocks.
Disposal Disposal of waste, surpluses and obsolete
materials.
Physical Distribution Distributing finished products to customers. In some cases traffic and physical distribution may be the same thing.
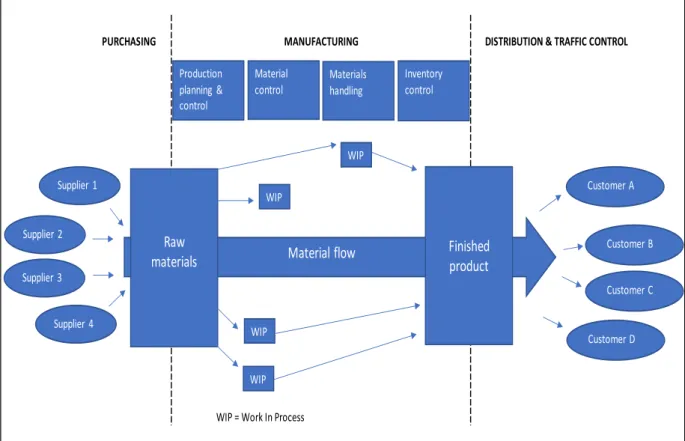
The main objective of Materials Management is to provide the required customer service level and maximize the use of company resources. With successful material management, the company can increase its profit significantly. (Arnold & Chapman 2001: 10). The main object of Materials Management can be considered making available services and materials of right quality in the right quantity from the right source at the right time ate the right price. (Bhat 2009). In order to clarify the overall picture of MM, Figure 1 shows the concept of the Materials Management.
Figure 1. The concept of Materials Management (Adapting Bhat 2009: 7).
2.1.1 Material Requirements Planning
Planning material flow is an important part of the Material Management. The planning of the materials is intended to show in advance the material requirements in response to production requirements. Material plans follow the production plans which in turn are
WIP = Work In Process
MANUFACTURING
PURCHASING DISTRIBUTION & TRAFFIC CONTROL
Material flow Raw
materials Finished product
WIP WIP WIP WIP Production planning & control Material control Materials handling Inventory control Supplier 4 Supplier 2 Supplier 1 Supplier 3 Customer A Customer B Customer D Customer C
based on demand forecast of finished products. (Chunawalla 2008). Materials planning is one part of the production planning. (Bhat 2009).
Materials planning is generally made on the basis of the material budget. Material budget is an estimate of the costs of materials purchases and thus helps to materials planning. The importance of materials planning cannot be overlooked. Failing in materials planning can lead to over-ordering, which arouses additional challenges and costs for storage. It also negatively affects the productive use of materials. In the worst case, it may lead to obsolescence and deterioration of materials. Poor materials planning can also result in under-ordering, which in turn can lead to a shortage of materials and, consequently, delays in deliveries. (Bhat 2009.)
A well-designed material planning system will provide a variety of benefits to the company. It enables to prepare for the future and not just to react to the situation. Therefore it helps the company to get things done effectively. Thus material design can avoid material shortages. An efficient system enables buyers to know about the future purchases in advance. Thereby they are able to make their own purchase plans. (Bhat 2009.)
As computers became more common, material management and, in particular, materials design began to be automated with computer-based programs. These programs known as Material Requirements Planning (MRP) systems. (Sheldon 2008). According to Mabert (2007) factories began to manage material flows with the help of MRP systems at the end of the 20th century. Chunawalla (2008) defined MRP as an Inventory Control and Production Planning System which is a computer-based and time-phased.
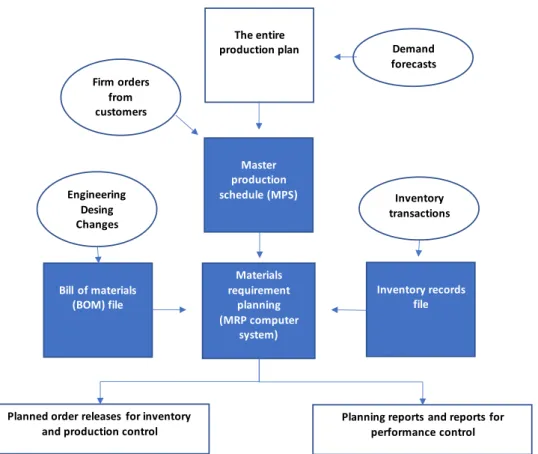
The idea behind the MRP was very simple. Bill of Materials (BOM) were defined for each product. BOM defined the materials and component requirements of the products. These material requirements were linked to Inventory records. Thus, the MRP system provided signals for purchase orders. (Sheldon 2008). According to Wilson (2015) MRP systems depend on identifying the right parts and the right amount of material in production planning. BOMs are therefore indispensable to the effectiveness of these systems. MRP systems make great efforts to ensure that BOMs are correct. Figure 2
demonstrates the structure of the MRP system. Chunawalla (2008) defined four main elements of MRP systems:
1. The master production schedule (MSP). This drives the MRP.
2. The bill of materials (BOM) or product structure file.
3. The inventory records file. 4. The MRP software package.
Figure 2. The Structure of MRP system. (Adapting Chunawalla 2008 & Yang 2016).
At the turn of the millennium, several companies implemented the new software system to integrate their processes. These package systems are widely categorized as Enterprise Resource Planning (ERP) systems. Over the years, ERP systems evolved from MRP systems after the various phases. (Mabert, Soni & Venkataramanan 2003). According to
Materials requirement planning (MRP computer system) Inventory records file Master production schedule (MPS) Bill of materials (BOM) file The entire
production plan Demand
forecasts Engineering Desing Changes Firm orders from customers Inventory transactions
Planned order releases for inventory and production control
Planning reports and reports for performance control
Fulford (2013) today's ERP systems are an important part of the capital expenditure of many companies, but on the other hand, efficient management of ERP systems has a major impact on business performance.
2.1.2 Enterprise Resource Planning (ERP)
According to Costa, Ferreira, Bento and Aparicio (2016) ERP systems are the core of every organization. In their article, they introduced the definition that Enterprise Resource Planning (ERP) systems are comprehensive and packaged software solutions that try to integrate all company's business processes into a single entity that can be viewed from a single information system and IT architecture.
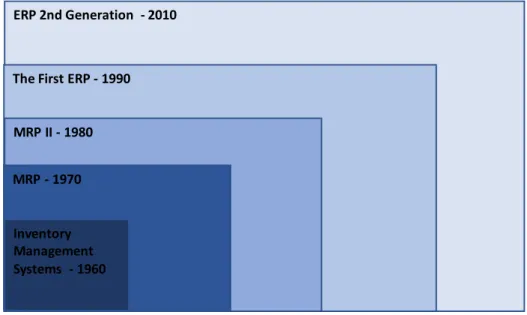
Enterprise Resource Planning (ERP) seeks to combine all departments and their functions in a single computer software that is able to serve the needs of all those departments. In other words, the software should be able to serve people in finance, people in human resources and people in the warehouse at the same time. With ERP, these different units can more easily share information and communicate with each other. (Parthasarthy 2007.) The evolution of existing ERP systems has begun for several decades ago. Already in the 1960s several organizations developed and introduced an automated inventory management system. Next, in the 1970s, a Material Requirements Planning (MRP) system was developed which mainly dealt with the requirements of a product or parts in accordance with the master production schedule. Development continued and in the 1980s the first Manufacturing Resources Planning (MRP II) systems were introduced. In addition to materials planning it included areas such as shop floor, project management, distribution management, human resources, finance and engineering. (Abdullah 2017.)
The first comprehensive ERP systems took first steps in the early 1990s. They were developed based on MRP and MRP II systems. As a result, ERP systems integrate business processes including all aspects as manufacturing, distribution, accounting, finance, human resource management, project management, warehousing, maintenance and service and transportation. They provide visibility, accessibility and consistency throughout the company. (Abdullah 2017.)
After the first occurrence of a comprehensive ERP system, they will be further developed. These systems are called Extended ERP Systems. (Abdullah 2017) According to Samara (2015), new modules such as Supply Chain Management (SCM), Product Lifecycle Management (PLM) and Customer Relationship Management (CRM) are among the newest ERP systems. Figure 2 shows the main steps of the evolution of ERP
Figure 3. Evolution of Enterprise Resource Planning (ERP). (Adapting Abdullah 2017 & Samara 2015).
2.2 Forecasting and managing demand
Demand management is a process of supply chain management designed to balance customer needs with the supply chain capabilities. It includes demand forecasting and synchronization with procurement, distribution and production. (Croxton, Lambert, Garcia-Dastugue & Rogers 2002). Arnold & Chapman (2001: 196) defined demand management as the function of managing and identifying all product-related demand. According to their book, demand management is a link between marketing and material management. Demand management takes place in the short, medium and long term. Forecasting is one of the main tasks of demand management.
ERP 2nd Generation - 2010
The First ERP - 1990
MRP II - 1980
MRP - 1970
Inventory Management Systems - 1960
According to the science dictionary, the forecast is an estimate of what will happen in the future. (Vocabulary 2018). Forecasting is important in many ways in different phases of life. As individuals, we try to predict success in, for example, occupation, investment, and marriage. Organizations use large amounts of money based on forecasts, for example, on acquiring a new factory or product. Forecasting and planning are often perceived as the same thing. However, the plans refer to what the future should be, while the forecasts are intended to tell what it will be like. (Armstrong 2001a.)
Forecasts are needed to support decision-making in many different situations. The decision to build a new plant within five years requires forecasts for future demand. Stocking inventories are based on forecast of storage requirements. (Hyndman & Athanasopoulos 2013). According to Acar, Everette & Gardner (2002) forecasting is one important factor affecting the operational performance of the supply chain. Therefore, poor forecasts may lead to destructive decisions. (Armstrong 2001a).
Forecasts can be divided into three different time horizons: short-term, medium-term and long-term. In other words, forecasts can be made from a few minutes to several years in advance. Time horizon depends on the nature of the predictable phenomenon. For example, short-term forecasts are needed for scheduling personnel and production, medium-term forecasts are needed for raw material volume planning and long-term forecasts are needed for strategic planning. (Hyndman & Athanasopoulos 2013). However, according to Armstrong (2001a) decision-makers need forecasts only when there is uncertainty in the future. However, uncertainty often occurs in companies decisions. In these cases, forecasts can be significant benefit in support of decision-making.
Forecasting demand is an important activity that affects companies world-wide regardless of their branch of industry. Prediction of demand is a critical function in increasing supply chain efficiency and it affects all aspects of the company. For example, the demand forecasts will determine the amount of raw materials, the volume of end-product stocks, the number of products to be transported, the number of people to be hired and the number of factories to be built. In the current world economy, the passage of the entire supply chain from raw material to the finished product and consumers may take a lot of time.
Therefore, demand forecasts are essential. Companies must be able to predict the need for the future to be able to respond immediately to their customers.. (Chase 2013.).Forecasts are essential for a successful business of organizations. (Kumar & Suresh 2009).
While studying demand forecasting, there are often two types of demand in literature, Independent demand and Dependent demand. These two have a significant difference. Independent demand is affected by market conditions outside the scope of operations. In other words, demand is independent of operations. While dependent demand is related to the demand of another item. When a product consists of parts and components, their demand depends on the demand for the finished product. For example the MRP is based on dependent demand. (Chunawalla 2008.) This study focuses on forecasting dependent demand.
2.2.1 Forecasting process
The forecasting process consists of several stages. At the beginning of the forecasting process, it should be determined that what is going to be predicted. For example, does an organization predict a single product or a whole product group? When a prediction object is known, it is necessary to define the time horizon. Do we need forecasts a month in advance or five years in advance? It is also necessary to determine how often forecasts should be made. (Hyndman & Athanasopoulos 2013.)
Knowing what kind of forecasts are needed, it is necessary to determine what kind of information the forecast is based on. This information should be collected, although it may already exist. It is therefore important to identify where and how information is stored. a Large part of the predictor's time can be used to locate and compare available data before developing suitable forecasts. (Hyndman & Athanasopoulos 2013.)
Hyndman & Athanasopoulos (2013) presented the five basic steps of the forecasting process. In turn Shridharabhat, K. & Aswathappa, K. (2009) shared the prediction process into seven steps. According to these two opus, the steps of the forecasting process can be broken down as follows:
1. Definition of forecasting targets.
This includes the definition of problem. It requires understanding of the predictable phenomenon. This also includes determining prediction needs such as the time horizon, forecasting frequency and forecasting target(s). In addition, this includes the definition of the details required by the forecast, such as the amount of resources and the goal of the forecast accuracy.
2. Data collection.
At this stage, it is necessary to determine the method of collecting the data. Whether to use statistical data or an expert’s view. Both are often needed to produce a good forecast. The information needed for the forecast must be collected before the forecast is prepared.
3. Preliminary data analysis.
It is also important to analyze the collected data before selecting the forecast method. Information analysis can help to find out significant variables for the forecast. For example, whether there is any seasonal variation that can be observed, whether the data is related to a trend or whether expert help is needed to make a forecast.
4. Selecting a forecasting method.
Choosing a forecasting method depends on the availability of historical information, the interdependence between potential variables and the purpose of the forecasts. Each model has its own structure and is suitable for different types of forecasts. Usually two or three potential models are compared to choose a suitable method.
5. Using and monitoring forecasting method.
When the forecasting method is selected and the parameters affecting it are defined it can be used to make a forecast. It is also important to monitor and evaluate the selected
method to see if it performs in the desired way. It also enables for a continuous development of the method. Figure 4 shows demonstrates the forecasting process.
Figure 4. The process of forecasting. (Adapting Armstrong 2001a).
2.2.2 Forecasting methods
There is a very large number of forecasting methods for different decision-making situations. In general, demand forecasting approaches can be divided into two main categories. (Kumar & Suresh 2009).
1. Qualitative forecasting methods. The qualitative methods are mainly based on subjective inputs (Aswathappa & Bhat 2010). The qualitative forecasts are based on intuitions, judgment and informed decisions. (Arnold & Chapman 2001: 202). Qualitative forecasting methods can include experiences and personal views. For this reason, the results may differ between the different individuals. (Kumar & Suresh 2009). According to Hyndman & Athanasopoulos (2013) the cognition of the individual and its limitations is the most critical element in qualitative forecasting. Qualitative forecasts are usually made by an expert in their field (Rushton, Croucher & Baker 2014: 211).Table 2 shows the most common qualitative forecasting methods.
Define the Problem Obtain Information Select Methods Implement Methods Evaluate Methods Use Forecasts
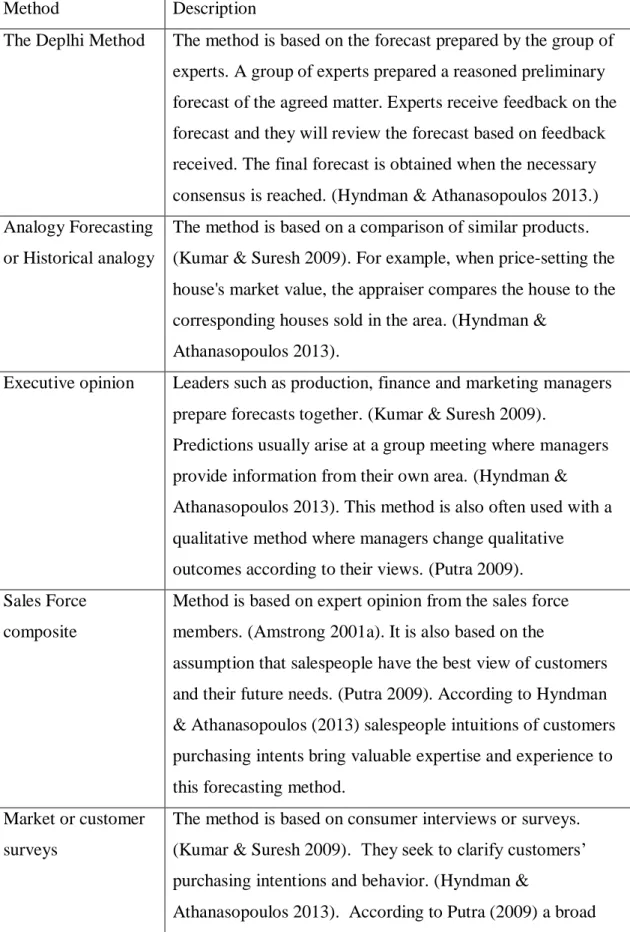
Table 2. Qualitative forecasting methods.
Method Description
The Deplhi Method The method is based on the forecast prepared by the group of experts. A group of experts prepared a reasoned preliminary forecast of the agreed matter. Experts receive feedback on the forecast and they will review the forecast based on feedback received. The final forecast is obtained when the necessary consensus is reached. (Hyndman & Athanasopoulos 2013.) Analogy Forecasting
or Historical analogy
The method is based on a comparison of similar products. (Kumar & Suresh 2009). For example, when price-setting the house's market value, the appraiser compares the house to the corresponding houses sold in the area. (Hyndman &
Athanasopoulos 2013).
Executive opinion Leaders such as production, finance and marketing managers prepare forecasts together. (Kumar & Suresh 2009).
Predictions usually arise at a group meeting where managers provide information from their own area. (Hyndman & Athanasopoulos 2013). This method is also often used with a qualitative method where managers change qualitative outcomes according to their views. (Putra 2009). Sales Force
composite
Method is based on expert opinion from the sales force members. (Amstrong 2001a). It is also based on the
assumption that salespeople have the best view of customers and their future needs. (Putra 2009). According to Hyndman & Athanasopoulos (2013) salespeople intuitions of customers purchasing intents bring valuable expertise and experience to this forecasting method.
Market or customer surveys
The method is based on consumer interviews or surveys. (Kumar & Suresh 2009). They seek to clarify customers’ purchasing intentions and behavior. (Hyndman &
statistical analysis is usually used to analyze the results of the survey to test the assumptions of consumer behavior.
2. According to Chase (2013), forecasts that are based on past sales history or relationships between earlier sales and another variables are quantitative methods. Quantitative methods can also be considered mathematical and objective. Quantitative forecasting methods combine two issues: sufficient numerical data about the past and the assumption that history repeats itself to some extent. (Hyndman & Athanasopoulos 2013). The quantitative methods are divided into two main groups: time series methods and causal or associative methods. Time series are based on the assumption that the past will be reflected in the future while associative methods take into account the factors and variables that can affect the predicted amount. (Shridharabhat, K. & Aswathappa, K. 2009).
There are a lot of different quantitative predictive methods. They are often developed for a specific purpose. Each method has its own features, purposes and precisions. (Hyndman & Athanasopoulos 2013). Table 3 shows the most common quantitative forecasting methods.
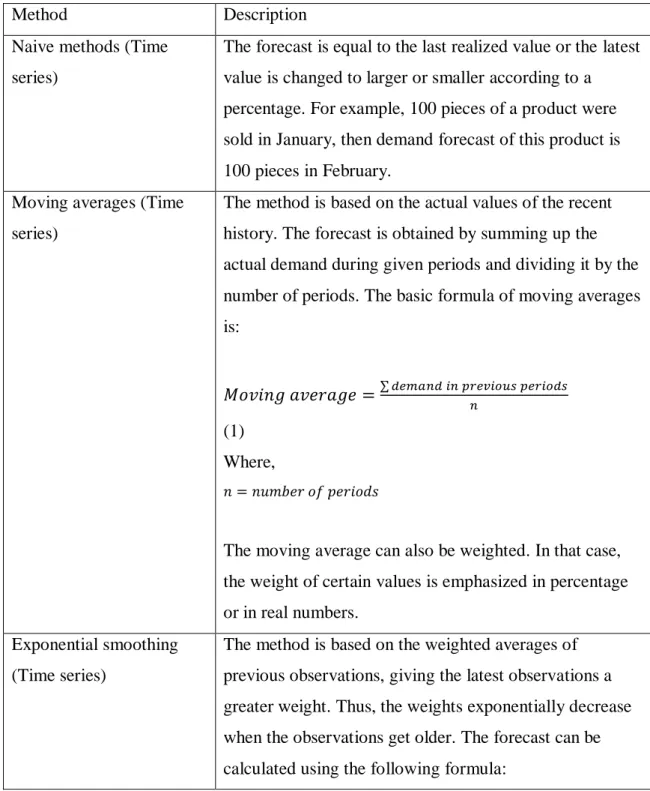
Table 3. Quantitative forecasting methods. The table is compiled from sources: (Amstrong 2001; Kumar & Suresh 2009; Shridharabhat, K. & Aswathappa, K. 2009; Hyndman & Athanasopoulos 2013; Montgomery, Jennings & Kulahci 2015).
Method Description
Naive methods (Time series)
The forecast is equal to the last realized value or the latest value is changed to larger or smaller according to a percentage. For example, 100 pieces of a product were sold in January, then demand forecast of this product is 100 pieces in February.
Moving averages (Time series)
The method is based on the actual values of the recent history. The forecast is obtained by summing up the actual demand during given periods and dividing it by the number of periods. The basic formula of moving averages is: 𝑀𝑜𝑣𝑖𝑛𝑔 𝑎𝑣𝑒𝑟𝑎𝑔𝑒 =∑ 𝑑𝑒𝑚𝑎𝑛𝑑 𝑖𝑛 𝑝𝑟𝑒𝑣𝑖𝑜𝑢𝑠 𝑝𝑒𝑟𝑖𝑜𝑑𝑠 𝑛 (1) Where, 𝑛 = 𝑛𝑢𝑚𝑏𝑒𝑟 𝑜𝑓 𝑝𝑒𝑟𝑖𝑜𝑑𝑠
The moving average can also be weighted. In that case, the weight of certain values is emphasized in percentage or in real numbers.
Exponential smoothing (Time series)
The method is based on the weighted averages of previous observations, giving the latest observations a greater weight. Thus, the weights exponentially decrease when the observations get older. The forecast can be calculated using the following formula:
𝐹𝑡= 𝐹𝑡−1+ 𝛼(𝐴𝑡−1− 𝐹𝑡−1) (2) Where, 𝐹𝑡= 𝐹𝑜𝑟𝑒𝑐𝑎𝑠𝑡 𝑓𝑜𝑟 𝑡ℎ𝑖𝑠 𝑝𝑒𝑟𝑖𝑜𝑑 (𝑡) 𝐹𝑡−1= 𝐹𝑜𝑟𝑒𝑐𝑎𝑠𝑡 𝑓𝑜𝑟 𝑡ℎ𝑒 𝑝𝑟𝑒𝑣𝑖𝑜𝑢𝑠 𝑝𝑒𝑟𝑖𝑜𝑑(𝑡 − 1) 𝐴𝑡−1= 𝐴𝑐𝑡𝑢𝑎𝑙 𝑑𝑒𝑚𝑎𝑛𝑑 𝑓𝑜𝑟 𝑡ℎ𝑒 𝑝𝑟𝑒𝑣𝑖𝑜𝑢𝑠 𝑝𝑒𝑟𝑖𝑜𝑑 (𝑡 − 1)
α = Smoothing constant (Value is between 0 and 1)
Choosing a smoothing constant usually requires expertise or experiments. For example, trend-based methods are based on exponential smoothing. Then smoothing constant changes linearly, exponentially or in other projection according to the past or existing trend. ARIMA models (Time
series)
ARIMA models are advanced methods for analyzing time series. ARIMA is the abbreviation of Autoregressive integrated moving average. The ARIMA models consist of several different models. First, an autoregressive model (AR) and a moving average model (MA) are defined. By combining these two, an autoregressive moving average model (ARMA) is obtained. By integrating ARMA, the ARIMA model is obtained. The ARIMA models attempt to describe autocorrelations in data.
Regression and correlation methods (Associative)
Methods based on regression and correlation are based on a hypothesis where two variables have a linear
relationship. It can use either one or a number of associative variables for forecasting. Two examples of these methods are shown below:
The Simple linear model (Simple Regression)
𝑦 = 𝛽0+ 𝛽1𝑥 + 𝜀
(3) Where,
𝛽0 𝑎𝑛𝑑 𝛽1 𝑑𝑒𝑡𝑒𝑟𝑚𝑖𝑛𝑒 𝑖𝑛𝑐𝑙𝑖𝑛𝑎𝑡𝑖𝑜𝑛 𝑎𝑛𝑑 𝑖𝑛𝑡𝑒𝑟𝑠𝑒𝑐𝑡𝑖𝑜𝑛 of the line 𝛽0= 𝑇ℎ𝑒 𝑓𝑜𝑟𝑒𝑐𝑎𝑠𝑡𝑒𝑑 𝑣𝑎𝑙𝑢𝑒 𝑜𝑓 𝑦 𝑤ℎ𝑒𝑛 𝑥 = 0
𝛽1= 𝑇ℎ𝑒 𝑓𝑜𝑟𝑒𝑐𝑎𝑠𝑡𝑒𝑑 𝑖𝑛𝑐𝑟𝑒𝑎𝑠𝑒 𝑖𝑛 𝑌 𝑤ℎ𝑒𝑛 𝑥 𝑖𝑛𝑐𝑟𝑒𝑎𝑠𝑒𝑠 𝑎 𝑜𝑛𝑒 𝑢𝑛𝑖𝑡 𝜀 = 𝑡ℎ𝑒 𝑟𝑎𝑛𝑑𝑜𝑚 "𝑒𝑟𝑟𝑜𝑟"
4
Multiple linear regression (Multiple Regression)
𝑦𝑖 = 𝛽0 + 𝛽1𝑥1,𝑖+ 𝛽2 𝑥2,𝑖 + ⋯ +𝛽𝑘𝑥𝑘,𝑖+ 𝑒𝑖, (4) Where, 𝑦𝑖= 𝑉𝑎𝑟𝑖𝑎𝑏𝑙𝑒 𝑡𝑜 𝑏𝑒 𝑓𝑜𝑟𝑒𝑐𝑎𝑠𝑡 𝑥1,𝑖, … , 𝑥𝑘,𝑖= 𝑃𝑟𝑒𝑑𝑖𝑐𝑡𝑜𝑟 𝑣𝑎𝑟𝑖𝑎𝑏𝑙𝑒𝑠 (𝑚𝑢𝑠𝑡 𝑏𝑒 𝑛𝑢𝑚𝑒𝑟𝑖𝑐𝑎𝑙) 𝛽1, … , 𝛽𝑘 = 𝑐𝑜𝑒𝑓𝑓𝑖𝑐𝑖𝑒𝑛𝑡𝑠 𝑡ℎ𝑎𝑡 𝑚𝑒𝑎𝑠𝑢𝑟𝑒 𝑡ℎ𝑒 𝑚𝑎𝑟𝑔𝑖𝑛𝑎𝑙 𝑒𝑓𝑓𝑒𝑐𝑡𝑠 𝑜𝑓 𝑒𝑎𝑐ℎ 𝑝𝑟𝑒𝑑𝑖𝑐𝑡𝑖𝑜𝑛 𝑣𝑎𝑟𝑖𝑎𝑏𝑙𝑒𝑠
Econometric (Associative) Econometric forecasting methods use simultaneously a number of regression models associated with broad economic activity. Often in econometric methods, qualitative information is combined with quantitative data.
2.2.3 Selecting a forecasting method
Selection of forecasting method is very important in order to achieve the best forecast results. (Permanasari, A. E. 2010). For example, in a modern supply chain, designing the right amount of inventory without proper forecasting is extremely challenging. (Dweiri Khan & Jain 2015).
When selecting a suitable forecasting method, it is important to understand the nature of the demand. For example, when demand is seasonal, a method must be selected that includes seasonal variation. For example, if the nature of demand changes or the number of errors increases, it is usually necessary to make changes to the current method. (Croxton at al. 2002.)
In addition to the nature of demand, it is important to understand the flow of information related to the forecasts. This means determining the sources of information, how input data is used and transferred to the method, and how and what of the output data is communicated to whom. For example, the company's ERP system can provide the necessary information for forecasting and can be used throughout the enterprise. (Croxton at al. 2002.)
According to Croxton et al. (2002) there are a large number of different forecasting software packages available on the market. They can be considered as one option in the situation of method selection. Then it must be taken into account that the features of the software are adapted to the needs of the company.
Armstrong (2001b) offered general guidelines to select a suitable forecasting method:
If enough information is available, use the quantitative forecasting methods. If the data is enough and the data is good enough the quantitative methods are assumed to be more accurate than the qualitative methods. In order to assess the adequacy and quality of the data, it is important to take into account the amount, source, reliability and validity of the data.
Favor structured forecasting methods. Especially when qualitative forecasting is needed, it is recommended to use it structurally. Structured forecasting methods are usually more accurate, easier to communicate and easier to improve over time.
Favor simple methods. Simple forecasting methods are easier to understand, simpler to implement and they are cheaper. In addition, they are generally as accurate as the complex ones. More complex methods can be considered when it is possible to prove that complexity is beneficial. However, this usually requires a very good knowledge of the situation.
Prefer causal methods instead of naive methods. Causal methods are usually more accurate, especially in long-term forecasting where changes are expected. Naive methods may be sufficient for short-term forecasts that have long history of stable demand.
Identify the predictable phenomenon and consider what kind of forecasting method would be best suited to that situation.
2.2.4 Monitoring and controlling forecasting methods
According to Armstrong (2001c) forecasting methods should be evaluated in the situations in which they are used. The estimation of forecasting methods is often based on determining different criteria or monitoring forecasting errors. This can be done, for example, by setting the upper and lower limits for how much forecasts may deviate from actual demand before changing the method parameters. (Shridharabhat & Aswathappa 2009).
Several different accuracy measures have been developed to measure the performance of the forecasting methods. The purpose of the meters is to provide information to support the development of methodology and the improvement of forecasting accuracy. (Mehdiyev, N. Enke, D. Fettke, D. & Loos, P 2016.)
In the simplest way, the forecasting accuracy can be measured by comparing actual demand with forecasted demand. Then the deviations between them can be identified, which can be called a forecasting errors. The forecast error can be calculated as follows: 𝐹𝑜𝑟𝑒𝑐𝑎𝑠𝑡 𝑒𝑟𝑟𝑜𝑟 = 𝐴𝑐𝑡𝑢𝑎𝑙 𝑑𝑒𝑚𝑎𝑛𝑑 − 𝐹𝑜𝑟𝑒𝑐𝑎𝑠𝑡 𝑑𝑒𝑚𝑎𝑛𝑑 (5)
(Kumar & Suresh 2009.)
One common way to measure errors is the mean absolute deviation (MAD). Its purpose is to calculate the average of the total errors. (Arnold & Chapman 2001.)
𝑀𝐴𝐷 = ∑(𝐴𝑐𝑡𝑢𝑎𝑙 𝑑𝑒𝑚𝑎𝑛𝑑−𝐹𝑜𝑟𝑒𝑐𝑎𝑠𝑡 𝑑𝑒𝑚𝑎𝑛𝑑)
𝑛 (6)
𝑛 = 𝑛𝑢𝑚𝑏𝑒𝑟 𝑜𝑓 𝑠𝑎𝑚𝑝𝑙𝑒𝑠
One way to ensure good performance of forecasts is to use a tracking signal. It measures how well the forecast can predict actual values. (Shridharabhat & Aswathappa 2009). According to Kumar & Suresh (2009) the tracking signal's action limit is usually set
between 3 and 8. For example, if the action limit is 4, the tracking signal must be between -4 and 4, otherwise the forecast must be re-examined.
𝑇𝑟𝑎𝑐𝑘𝑖𝑛𝑔 𝑠𝑖𝑔𝑛𝑎𝑙 = ∑(𝐴𝑐𝑡𝑢𝑎𝑙 𝑑𝑒𝑚𝑎𝑛𝑑−𝐹𝑜𝑟𝑒𝑐𝑎𝑠𝑡 𝑑𝑒𝑚𝑎𝑛𝑑)
𝑀𝐴𝐷 (7)
According to Shcherbakov, Brebels, Shcherbakova, Tyukov, Janovsky & Kamaev (2013) different criteria are used to assess the quality of forecasts such as calculation speed, ease of interpretation and error rates. In general, the methods used to measure forecasting accuracy and errors are used to solve practical problems. For example, mean square error (MSE) and mean Absolute percent error (MAPE) are very commonly used methods.
𝑀𝑆𝐸 = ∑(𝐴𝑐𝑡𝑢𝑎𝑙 𝑑𝑒𝑚𝑎𝑛𝑑−𝐹𝑜𝑟𝑒𝑐𝑎𝑠𝑡 𝑑𝑒𝑚𝑎𝑛𝑑)2 𝑛−1 (8) 𝑀𝐴𝑃𝐸 = (∑ |𝐴𝑐𝑡𝑢𝑎𝑙 𝑑𝑒𝑚𝑎𝑛𝑑−𝐹𝑜𝑟𝑒𝑐𝑎𝑠𝑡 𝑑𝑒𝑚𝑎𝑛𝑑| 𝐴𝑐𝑡𝑢𝑎𝑙 𝑑𝑒𝑚𝑎𝑛𝑑 𝑛 ) ∗ 100 (9) 2.2.5 Combining forecasts
Combining forecasts is a comparison between different forecast methods or different data sources. Combining forecasts aims at better forecast accuracy and minimization of forecasting errors. Comparison of different data sources or different forecasting methods can achieve significant benefits especially in situations where a lot of uncertainty is present. By combining forecasts can reduce errors and improve forecasting accuracy. (Armstrong 2001d.)
One common way to combine forecasts is to modify quantitative forecasts by qualitative methods. Both quantitative and qualitative have their own strengths and weaknesses and can provide different information to the forecasting process. However, modifying the forecasts with qualitative methods can weaken forecasting accuracy. (Sanders & Ritzman 2001.)
Sanders & Ritzman (2001) listed six principles for combining quantitative and qualitative methods. They recommended that the forecaster should consider these principles when
deciding when and how qualitative methods could be used to improve the statistical forecast:
1. Modify the statistical forecast if important knowledge of the subject is known.
2. Modify the statistical forecast if there is a lot of uncertainty.
3. Modify the statistical forecast if it is known that there are changes in the environment. 4. Structure the qualitative modification process.
5. Document all the modifications made by qualitative methods.
6. Consider mechanically the combination of quantitative and qualitative methods over adjusting.
3. Research Methodology
The third main chapter describes the research methods used in the study. This chapter describes the main methodology of the research, the data collection methods and methods for processing data. The purpose of this chapter is to clarify to the reader how the research has been implemented in practice.
3.1 Methodology
Quantitative research methods focuses mainly on the analysis of statistical data while qualitative research methods does not usually use statistical methods but tries to understand the nature of the research problem through the observations. (Baškarada 2014). In this study, both theories are used quantitative and qualitative. Qualitative methods are used to collect information to understand the research problem and its nature. Qualitative methods are also utilized in the development of the forecasting process. In turn quantitative methods are used in the tool evaluation.
This study can also be considered as a case study. According to Yin (1994) case study generally tries to answer "how" and "why" questions. The nature of the case study also involves studying the phenomenon of a real life. The main question of this study is "how" question and the research is trying to solve the problem in real life. One way to do a case study is to use one case. This is called a single case study. (Yin 1994). This study uses one case where the study can be considered a single case study.
In addition to the fact that the study is a single case study it can also be considered a descriptive case study. According to Baškarada (2014) descriptive case studies tend to describe the subject of the study fully in its context, which can also be used to create a new theory. The purpose of this study is to describe the present situation of the case company's forecasting process and its problems completely and then seek to find solutions by creating a new approach.
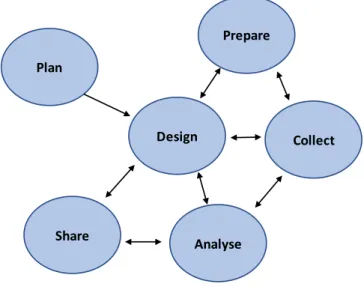
This study mimics a six-part case study process. Figure 5 demonstrates the case study process. It consists of the following stages:
1. Planning stage, which includes the definition of the research question and the research method.
2. Design stage focusing on unit analysis and development of a case study plan.
3. Prepare stage focuses on the development of researcher skills in case-related matters.
4. Collect stage involves collecting data and evidence using multiple data sources. 5. Analyze stage that includes theoretical suggestions.
6. A Share Stage, which involves audience definition, assigning evidence to the reader, reviewing and rewriting.
Figure 5. The case study process (Adapting Baškarada 2014).
3.2 Data Collection
The gathering of research data was largely based on a variety of undocumented interviews, conversations and meetings. The development of forecast process is based on the solutions and observations received at meetings. The forecasts themselves are based on quantitative data obtained from a case company's ERP system.
Plan
Prepare
Share
Design Collect
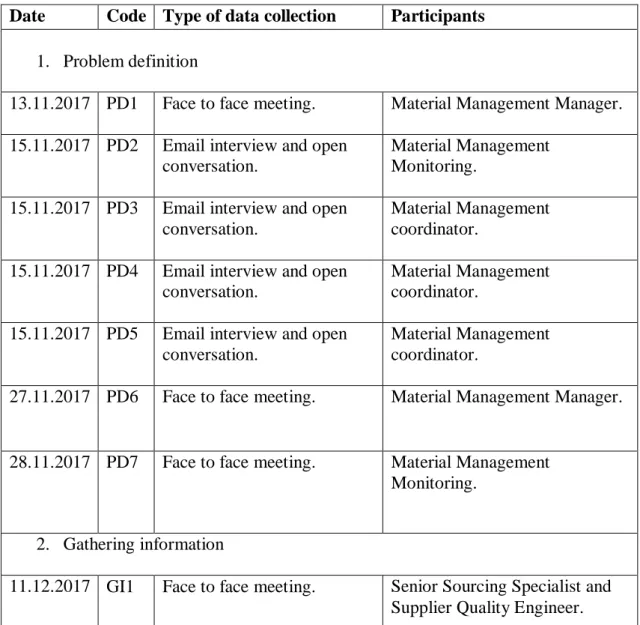
Table 4 summarizes the meetings and discussions organized during the study. Meetings have been organized and encoded using the forecasting process presented by Armstrong (2001a, figure 4). The forecasting process has been applied according to the nature of the study and consists of five different phases: problem definition, gathering information, creating a forecasting tool, tool evaluation and testing and tool development and use. The following table 4 shows the meetings and participants during the study. Meetings have been assigned codes according to the steps of the process, because the meeting will later be used as sources of text. In turn table 5 shows the topic of the meetings. Table 5 is divided according to process steps.
Table 4. Meetings of the research.
Date Code Type of data collection Participants 1. Problem definition
13.11.2017 PD1 Face to face meeting. Material Management Manager. 15.11.2017 PD2 Email interview and open
conversation.
Material Management Monitoring.
15.11.2017 PD3 Email interview and open conversation.
Material Management coordinator.
15.11.2017 PD4 Email interview and open conversation.
Material Management coordinator.
15.11.2017 PD5 Email interview and open conversation.
Material Management coordinator.
27.11.2017 PD6 Face to face meeting. Material Management Manager.
28.11.2017 PD7 Face to face meeting. Material Management Monitoring.
2. Gathering information
11.12.2017 GI1 Face to face meeting. Senior Sourcing Specialist and Supplier Quality Engineer.
14.12.2017 GI2 Face to face meeting. Material Management Manager. 15.12.2017 GI3 Skype meeting. Supply Planner.
28.12.2017 GI4 Skype meeting. Material Management Manager. 17.01.2018 GI5 Face to face meeting. Material Management Manager. 18.01.2018 GI6 Face to face meeting. MM Monitoring and Material
Management worker. 19.01.2018 GI7 Face to face meeting. Inventory Management
Manager.
24.01.2018 GI8 Face to face meeting. Material Management Manager.
29.01.2018 GI9 Face to face meeting. Supply planning manager and Supply planner.
3. Creating a forecasting tool (Method selection)
9.02.2018 MS1 Face to face meeting. SL Delivery Application Specialist.
26.02.2018 MS2 Face to face meeting. Material Management Manager. 27.02.2018 MS3 Face to face meeting. Program Manager.
5.03.2018 MS4 Face to face meeting. Material Management Manager. 6.03.2018 MS5 Face to face meeting. Material Management
coordinator.
12.03.2018 MS6 Face to face meeting. Material Management Manager and Program Manager.
22.03.2018 MS7 Face to face meeting. SL Delivery Application Specialist and MM manager. 4. Tool evaluation and testing (Method Evaluation)
23.03.2018 ME1 Face to face meeting. Material Management coordinator.
26.03.2018 ME2 Face to face meeting. Material Management coordinator.
5. Tool development and use
16.04.2018 TD1 Face to face meeting. Lead Application Specialist. 16.04.2018 TD2 Face to face meeting. Material Management Manager.
Table 5. The purposes of the meetings.
The stage of the process Codes Purpose
Problem definition PD1-PD7 A total of seven meetings that identified the company's forecasting process problems and potential development needs. However, before the
investigation of the current situation, the company's expectations and objectives for this research were reviewed.
Gathering information GI1-GI9 During the second phase of the process, the focus was on gathering information on the development of a potential forecasting tool.
Creating a forecasting tool MS1-MS7 The purpose of these seven meetings concerned the creation of a tool by means of previously collected information.
Tool evaluation and testing
ME1-ME2 In these meetings, the functionality of the tool was tested in practice and potential development needs were sought.
Tool development and use TD1-TD2 At this point, the focus was on
developing and implementing the final tool.
3.3 Dataset
The dataset of the research consists of written and statistical data. Written information consists of notes of the meetings and email discussions that have accumulated during the study. The content of the written data depended on the topics of meeting or e-mail. Mostly their content consisted of contacts, instructions or answers.
In turn the statistical data consisted of case company’s components and materials. The case company's ERP system contained all the information about the materials. The research dataset was designed by filtering only the necessary and relevant information for the study. The statistical dataset includes the case company's PTS materials, their suppliers, historical demand of the materials, sales forecasts of the products, material forecasts of the previous methods and material forecasts of the developed method.
3.4 Data processing
The information obtained from the meetings was mainly qualitative. Its analysis was based on the conclusions reached at joint meetings. In turn, the forecasting tool is based on quantitative data obtained from a case company's ERP system. The tool developed during the study as a sum of qualitative and quantitative data. Figure 7 shows the process flow and how qualitative and quantitative information is used.
Figure 6. The process flow.
The current situation of the case company’s forecasting process is analyzed by using SWOT analysis. Its purpose is to find possible development needs of the process. It is also used to evaluate the new forecasting model. SWOT analyzes of the new and old forecasting model are also used to compare each other. Thus, we see the changes made and possible further development needs.
SWOT analysis has been developed in the 1960's in the United States and has been a highly popular management tool. It consists of the words strengths, weaknesses, opportunities and threats. Its purpose is to measure the company's strategic position by comparing the company's strengths and weaknesses with threats and opportunities. In addition to leadership, it has been applied in other disciplines as well. (Vuorinen 2013)
The objective of the SWOT analysis is to produce analysis first, followed by choices and action plans. However, it requires an in-depth knowledge of the subject being analyzed. SWOT's sub-areas S (Strengths) and W (Weaknesses) are internal issues within the company while O (opportunities) and T (threats) are external issues related to the operating environment. (Vuorinen 2013). Figure 6 shows the structure of the SWOT analysis.
Monitoring the progress of the research Monitoring of the research was
based on the analysis of qualitative and quantitative data. Data analysis was dependent on the step of the process.
Creating a forecasting tool Both qualitative and quantitative data were used to create and develop the tool. Qualitative information ordered what kind of tool would be needed, while quantitative information ordered what it might be technically. The tool's forecasts are based on total quantitative data.
Developing and testing the tool
The development of the tool was also based on both qualitative and quantitative data. The development needs were based on qualitative information. Quantitative information was able to test for example the accuracy of forecasts.
Figure 7. The structure of the SWOT analysis (adapting Vuorinen 2013).
The previous and developed forecasting method was also evaluated using MAD and Tracking signal. (See chapter 2.2.4). The values obtained from the calculations are compared and they provide conclusions.
Threats External environment
Internal environment Strengths Weaknesses
4. The results of the research
4.1 Case company and current situation
4.1.1 Company introduction
The target company of the research is founded in Finland and is a global provider of industrial products and services. It is a major employer in the world today employing tens of thousands of workers around the world. The research is directed at the group's subsidiary, which is based in Finland. More specifically, it is directed at the part of the factory that manufactures electrical equipment. (Intranet of the case company.)
Materials management of the electrical factory is responsible of the material forecasting. The main task of materials management is to ensure that the materials are sufficient to enable production to respond to customers' demand. The forecasting is one of the most critical parts of that process. Forecasting is aimed at ensuring that suppliers are able to meet the material needs of an electrical factory. These forecasts are called supplier forecasts. (PD1.)
Large material quantities increases the importance of supplier forecasts at that electrical plant. There are thousands of components and parts to be purchased. In addition, material needs vary continuously. In other words, it is impossible for suppliers to respond to the material demand of an electrical plant without suitable forecasts. (PD1.)
The materials management team consists of ten people, seven of whom are responsible for the actual purchasing of materials. The remainder are responsible for the maintenance of materials. The actual purchase of materials is divided into PTO and PTS purchases where employees have their own area of responsibilities. Creating of supplier forecasts is the responsibility of PTS buyers, because the forecasts only contain PTS materials. Figure 8 demonstrates materials management of case company. (PD1.)
Figure 8. Materials Management of the case company.
4.1.2 Current situation of the forecasting process
Supplier forecasts have been made in this company since its inception. In connection with the supplier agreement it is also agreed to make material forecasts and the frequency of updating them. Forecasts are sent to suppliers monthly, semiannually or annually depending on the request of the supplier. The forecast includes an estimate of the consumption of that period on all supplier’s PTS materials. (PD 1-7.)
Forecasts are currently being made in many different ways in this company. Forecasts are made on the basis of each individual's own experience and skills. All forecast are done manually and commonly they are made from one material at a time. Forecasted future demand is strongly based on the forecaster’s experience and know-how to use available information. (PD 1-7.)
According to interviews and observations the most important source of information for forecasting is the company’s ERP system SAP. It provides a lot of essential information for forecasting. SAP enables access to historical data of materials. By using its various transactions the actual consumption of the materials, the actual amount of purchases and the actual quantities received can be examined. Form here you can also see the current
Materials Management manager Materials Management maintenance
PTO purchases PTS purchases
balance of materials and order lot sizes. SAP can also see a bit of future demand in the short term. (PD 1-7.)
However, most of the forecasts are largely based on historical data, particularly to past consumptions. Based on the interviews, it can be stated that the earlier consumption of materials is the starting point for the forecasts. All current forecasts are based on some level of previous consumption. Another connecting factor in the different worker’s forecasting style is the examination of the material requirements of the following month. The forecasted amount will be changed if there is a big difference between the material requirements of the following month and the previous consumption of materials. Some forecasts have used other historical data in addition to previous consumption. For example, average purchase volumes have been used to improve forecast accuracy. (PD 1-7.)
The case company did not have a common line of how to make predictions and there were no agreed forecasting methods. Based on the observations made in the research, current forecasting methods can be considered as adaptation of the moving average (table 3). However, the moving average is not usually used solely, but the figures are changed according to the predictor's estimate. (PD1-7.)
Moving average has been used in forecasts that contain hundreds of materials. Averages have been obtained directly from SAP and did not need to be calculated. SAP will give the moving averages of the desired materials for the previous three, six or twelve months. Figure 9 is an example of material consumption averages from SAP. (PD1-7.)
𝑚𝑜𝑣𝑖𝑛𝑔 𝑎𝑣𝑒𝑟𝑎𝑔𝑒 = ∑ 𝑑𝑒𝑚𝑎𝑛𝑑 𝑖𝑛 𝑝𝑟𝑒𝑣𝑖𝑜𝑢𝑠 𝑝𝑒𝑟𝑖𝑜𝑑𝑠
𝑛 (1)