An Efficient movie recommendation
algorithm based on improved
k
‑clique
Phonexay Vilakone
1, Doo‑Soon Park
1*, Khamphaphone Xinchang
1and Fei Hao
2Introduction
Recommended systems are one of the most important techniques used to introduce
information about user needs, including related services, by analyzing user actions [1,
2]. For the recommender system, a collaborative filtering approach is used to introduce
information that will meet the needs of the user. The collaborative filtering is based on similarly tasteless users, the same choice, and the idea that users who buy in the past will
buy in the future [3]. Data production factors for the collaborative filtering process are
user interest or user behavior in the form of the feature vector. This vector is paired with all other user carriers, and the most similar users are selected to be made in the vicinity of the user. From there, the guide contains information about things previously liked by
users in their neighborhood [4]. However, collaborative filtering often suffers from
vul-nerabilities [5] that affect the quality of their neighborhood. Use like Cold-start, Sparsity,
and Rating credibility.
Abstract
The amount of movie has increased to become more congested; therefore, to find a movie what users are looking for through the existing technologies are very hard. For this reason, the users want a system that can suggest the movie requirement to them and the best technology about these is the recommendation system. However, the most recommendation system is using collaborative filtering methods to predict the needs of the user due to this method gives the most accurate prediction. Today, many researchers are paid attention to develop several methods to improve accuracy rather than using collaborative filtering methods. Hence, to further improve accuracy in the recommendation system, we present the k‑clique methodology used to analyze social networks to be the guidance of this system. In this paper, we propose an efficient movie recommendation algorithm based on improved k‑clique methods which are the best accuracy of the recommendation system. However, to evaluate the perfor‑ mance; collaborative filtering methods are monitored using the k nearest neighbors, the maximal clique methods, the k‑clique methods, and the proposed methods are used to evaluate the MovieLens data. The performance results show that the proposed methods improve more accuracy of the movie recommendation system than any other methods used in this experiment.
Keywords: Collaborative filtering, Cosine similarity, k‑cliques, k nearest neighbor, Maximal clique, Recommendation system
Open Access
© The Author(s) 2018. This article is distributed under the terms of the Creative Commons Attribution 4.0 International License (http://creat iveco mmons .org/licen ses/by/4.0/), which permits unrestricted use, distribution, and reproduction in any medium, provided you give appropriate credit to the original author(s) and the source, provide a link to the Creative Commons license, and indicate if changes were made.
RESEARCH
*Correspondence: [email protected]
1 Department of Computer
Software Engineering, Soonchunhyang University, Soonchunhyang‑ro 22, Sinchang‑myeon 336‑745, Asan‑si,
Chungcheongnam‑do, South Korea
Latest technologies, user actions, and user private data can be saved to social networks
or e-commerce websites [6]. This type of technology makes it easier to analyze user
set-tings, which is useful for recommender systems [7]. Many researchers are interested in
how community-based networks are as complex as Hui et al. [8] identify k-clique
com-munities among students and use this information to design an effective way of
transmit-ting for mobile networks. There are also k-cliques used in the analysis of social networks
[9, 10] is introduced in the movie recommender system to improve the accuracy of the
movie recommender system. Ryu et al. [11] predicting the unemployment rate using
social media analysis. Hao et al. [12] similarity evolution between graphs: a formal
con-cept analysis approach. Carlos et al. [13] fuzzy linguistic recommender systems for the
selective diffusion of information in digital libraries.
The main purpose of this document is to achieve a more effective solution than collab-orative filtering. The proposed movie recommendation system is based on the abstract maximal clique method. This was the first time that this method of social network analysis was used to introduce in the movie recommender system, and it is found to
be very efficient. The k-cliques, which are partially graphs that are fully connected to k
vertices [14] and a very effective method to build groups in social networks analysis is
proposed. In the proposed approach, a similarity measure of cosine is used to measure
similarities between users. Then, use k-cliques to create clusters and introduce movie
in similar groups using the collaborative filtering method. The proposed solution offers
improved k-clique methods for more efficient performance than existing collaborative
filtering and maximal clique. The effect of each experiment depends on the value of k.
So to find a more effective solution, the improved k-clique will be offered. The improved
k-cliques method is used to determine that the value of k is the optimal value of the
k-clique method, which provides the maximum accuracy with the recommender system.
The best value of k in k-clique is the value that results in the mean absolute percentage
error to be the minimum value. For performance evaluation, use MovieLens data, which is general information in movie recommendation systems. To assess the effectiveness of a MovieLens dataset, it is divided into experimental and test data that are widely used
in artificial intelligence. Comparison of collaborative filtering methods using k nearest
neighbor, maximal clique method, k-clique method, and improve k-clique to evaluate
performance.
The remainder of the article is organized as follows: “Related work” section,
pre-sents the relevant work in the field. In “An efficient movie recommendation algorithm
based on improved k-clique” section, the proposed methodology is described in detail. In “Experimental analysis” section, the experiment will be conducted. The results of the experiments are discussed and the proposed method by the collaborative filtering
method using the k-nearest neighbor method and the maximal clique method to
com-pare the performance. Finally, in “Conclusion” section, the conclusions are presented
and described in future directions.
Related work
We briefly describe the content needed to describe the proposed improved k-cliques
Recommendation systems
It is often referred to as recommender systems, a simple algorithm that aims to provide relevant and accurate information to users by filtering useful information from large data sets. The recommender system discovers information patterns in the data set by learning
about consumer choices and generating results relevant to their needs and interests [15].
Recommender systems are becoming more popular and are being used today in many areas, such as movies, music, news, books, research articles, search terms, social tags, and products in general. There are also expert systems for collaborators, jokes, restau-rants, clothing, financial services, insurance, and more. Most systems recommend the
use of collaborative filtering or content filtering to create a list of recommendations [16].
Collaborative filtering
The idea of a collaborative filtering approach is to collect and analyze a large amount of information about user actions and settings and then predict which users will favor their
similarity with other users [17]. The advantage of collaborative filtering is that it does
not rely on content that can be analyzed and can accurately represent complex items. Algorithms are used to calculate user similarities or item similarities in recommender
systems, such as k-nearest neighbors and Pearson correlation. Another collaborative
fil-tering concept is based on assumptions. People who buy in the past will buy in the future and like the same product them like in the past.
When modeling from user actions, differences often occur between actual and pre-dicted data collection models. One of the most popular examples of collaborative fil-tering is item-to-item collaborative filfil-tering (Users who bought A also buy B). The Weaknesses of collaborative filtering methods include cold start, scalability, and sparsity. There are two types of collaborative filtering methods: memory-based and model-based collaborative filtering [18].
k‑cliques detection in social network
The k-clique is a complete graph which has k nodes. In complex networks, there are
usually a lot of complete graphs which have different scales. Generally, the value of k
is greater than or equal to at least 3. If k is equal to 2, this means that. There is only an
edge, which has little practical meaning.
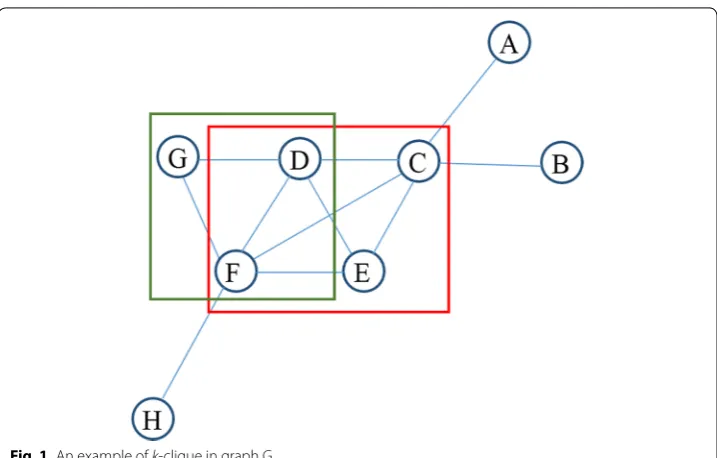
Example Fig. 1 shows the undirected graph G including eight nodes and their relationships.
Evidently, the nodes C, D, E, and F show a 4-clique since these nodes are connected with each other. In a similar manner, the set of nodes D, F, and G show a 3-clique.
To obtain improved accuracy, various researchers have presented potential new
meth-ods. The k-cliques method introduced in social network analysis is introduced in the
movie recommendation system in order to improve the accuracy of the movie recom-mendation system.
There has been some theoretical and empirical work on how the k-cliques can be
detected in social networks. Hao et al. [10] used k-clique mining in dynamic social
net-works. Hao et al. [14] used the k-clique method for detecting the social network. Hao et al.
the social network. Gregori et al. [20] used a parallel k-cliques to community detection on
the large-scale network. Palla et al. [21] used a CFinder to determine the k-clique
commu-nity, and subsequently extracted a set of k-clique communities. Kumpula et al. [22]
pro-posed the use of the sequential clique percolation algorithm in order to improve detection efficiency. CFinder is a tool for finding overlapping clusters in the biological graph based on k-clique [23]. Saito et al. [24] presented k-dense as well as an efficient method for extracting
the communities from complex networks. Adamcsek et al. [23] provided a faster CFinder to
find the k-cliques. Farkas et al. [25] introduce a clustering algorithm for weighted network
modules using k-clique methods, as the earlier k-clique did not consider weighted graphs
until it was initiated. The edge weights of the discovered k-cliques were measured for their
intensity. When the intensity value was found to be below the threshold, it would not be
considered when building a cluster, and vice versa [25]. Duan et al. [26] solved the problem
of k-clique clustering in a dynamic social network.
Cosine similarity measure
Cosine similarity is a similarity function that is often used in information retrieval, and it is also one of the most popular similarity calculations applied to text documents, for
numer-ous information retrieval applications [27], as well as clustering [28]. When documents
are represented as vectors, the similarity in two documents corresponds to the correlation between the vectors. This is quantified as the cosine of the angle between vectors. Given two documents −→ta and −→tb , their cosine similarity can be represented as
(1)
SIMC −→
ta,−→tb
= − →t
a.−→tb − →t
a ×
− →t
where −→ta and −→tb are m-dimensional vectors over the term set T = {t1,…, tm}. Each
dimen-sion represents a weight in the document, which is non-negative and bounded between
[0, 1]. For example, when combining two identical copies of document d to get a new
pseudo document d’, the cosine similarity between d and d’ is 1, which means that these
two documents are regarded to be identical. At the same time, given another document
l, d and d’ will have the same similarity value as that of l, that is
SIM −→
td,−→tl
=SIM −→
td′,−→tl
. Otherwise, documents with the same composition but different totals will be treated identically. When the term vectors are normalized to a unit length such as 1, the representation of d and d’ will be the same.
Maximal cliques
A maximal clique is a special clique which cannot be extended by adding any other
nodes [29]. The phrase “maximal clique” is usually used in terms of a sub graph of a
given graph G. So a sub graph H of a graph G is a maximal clique in G if H is isomor-phic to a complete graph and there is no vertex v∈V(G)∖V(H) so that v is adjacent to each vertex of H.
In other words, a sub graph H of a graph G is a maximal clique in G if H is a clique
(there is an edge between every pair of vertices in H) and there is no vertex in G but
not in H that sends an edge to every vertex of H. So we could not create a bigger
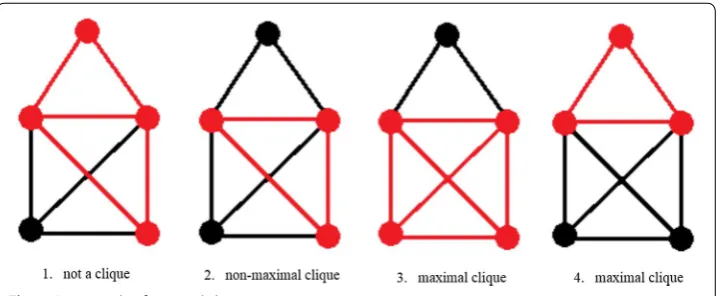
clique in G by adding another vertex to H. as shown in Fig. 2 below.
The red sub graph of the first graph is not a clique because there are two vertices in it not connected by an edge. The red sub graph of the second graph is a clique, but because there is a vertex in the larger graph connected to all 3 vertices in the sub graph, it is not a maximal clique. The red sub graph of the third graph is a maximal clique because it is a clique, and the last vertex not included in the sub graph does not send an edge to every vertex in the sub graph. The red sub graph of the fourth graph is a maximal clique because it is a clique, and neither of the vertices not included in the sub graph send an edge to every vertex in the sub graph. Note that the third and fourth red sub graphs are both maximal cliques even though the third red sub graph is larger.
An efficient movie recommendation algorithm based on improved k‑clique
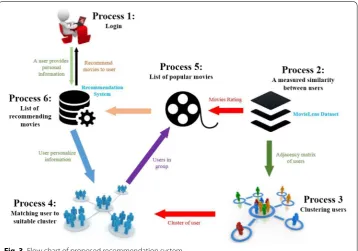
The process of gathering adequate information and workflow for recommendation
systems is shown in Fig. 3. Figure 3 illustrates a movie recommendation system using
the k-clique method.
Process1 in Fig. 3: we need to collect some necessary personalization information about users. The personalization information that we use here includes gender, age, and occupation. The new user needs to sign up to the system and provide some neces-sary personalization information.
Process2 in Fig. 3: we used personalization information from MovieLens data to make up the experimental data and test data. The experimental data is used to cal-culate the similarity between users. The similarities in the users are measured with the help of a cosine similarity measure algorithm. At the end of this process, the
adja-cency matrix of user similarity is created as shown in Table 1.
Process3 in Fig. 3: as previously described, the adjacency matrix shows the relation-ship between users. If the value of two users is 1, that means that they have similar characteristics, otherwise, they are considered not to be similar in characteristics to other. The adjacency matrix is used to cluster users into several groups based on the
k-clique method. After this process is completed, several clusters of the users may be
presented.
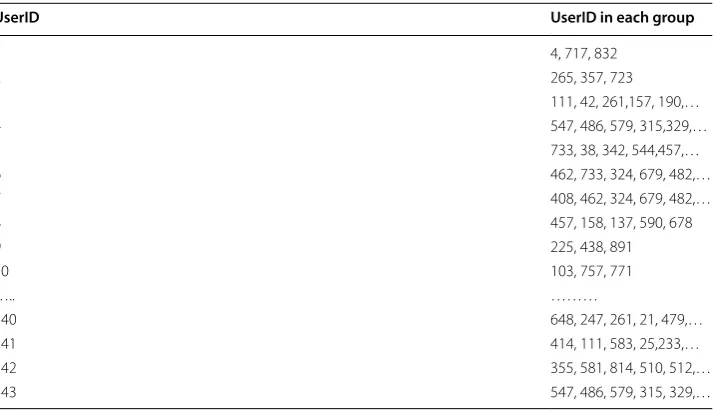
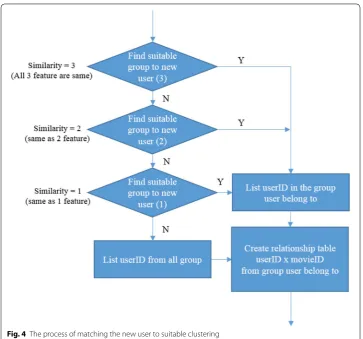
Process4 in Fig. 3: after the clusters of the users are found, we then need to find the most similar cluster with respect to the new user. In this process, the person-alization information of the new user is compared with the personperson-alization informa-tion of users in each group using cosine similarity methods to calculate the similarity between them. After finishing the comparison, the number of users, indicating the number of similar users in each group, will be counted. Then, the group having the
highest number of ones will be chosen as the most similar cluster for the
correspond-ing user, as shown in Table 2 for the result and shown in Fig. 4 for the detail of the
process.
Process5 in Fig. 3: when the group most similar to the new user is found, movies rated by the group members will be arranged in order of popularity, as movies rated near-est the maximum score will be listed at the top, and movies rated nearnear-est the minimum score otherwise listed at the bottom, then the top 15 movies which get the maximum
rated will be recommended to the new user, as shown in Table 3. In Table 3, the data are
shown in the first column is referred to the id of the new user and the data are shown in the second column is referred to the id of the movie.
Process6 in Fig. 3: the top 5 movies on the list will be recommended to the new user. In addition, it is up to the new user to decide which movies to choose from of the recom-mended movies.
Table 1 Adjacency Matrix for Users relationship
User1 User2 User3 User4 User5 User6 User7 User8 User9 User10 ….. User800
User1 1 1 0 0 0 0 1 0 0 1 ….. 1
User2 1 1 0 0 0 1 0 0 0 1 …..
User3 0 0 1 0 1 0 0 0 0 0 ….. 1
User4 0 0 0 1 0 0 0 1 0 0 ….. 0
User5 0 0 1 0 1 0 0 0 0 0 ….. 0
User6 0 1 0 0 0 1 0 0 1 1 ….. 0
User7 1 0 0 0 0 0 1 0 0 0 ….. 0
User8 0 0 0 1 0 0 0 1 0 0 ….. 1
User9 0 0 0 0 0 1 0 0 1 0 ….. 0
User10 1 1 0 0 0 1 0 0 0 1 ….. 0
….. ….. ….. ….. ….. ….. ….. ….. ….. ….. ….. …. 0
User800 1 0 1 0 0 0 0 1 0 0 ….. 1
Table 2 List of the users in the group that the new user belongs to
UserID UserID in each group
1 4, 717, 832
2 265, 357, 723
3 111, 42, 261,157, 190,…
4 547, 486, 579, 315,329,…
5 733, 38, 342, 544,457,…
6 462, 733, 324, 679, 482,…
7 408, 462, 324, 679, 482,…
8 457, 158, 137, 590, 678
9 225, 438, 891
10 103, 757, 771
….. ………
140 648, 247, 261, 21, 479,…
141 414, 111, 583, 25,233,…
142 355, 581, 814, 510, 512,…
The detail of the k-clique algorithm shows in the below.
[Algorithm 1] k-Clique Algorithm: This algorithm used to classify users into several groups.
Input: user_training.csv. Output: group_of_users. Step 1: initialize mymatrix, sim. Step 2: for i = 1 to mymatrix do Step 3: for j = 1 to mymatrix do{ Step 4: initialize a Step 5: for k = 2 to 4 do
Step 6: if mymatrix[i,k] == mymatrix[j,k] a[k] = 1
else a[k] = 0 Step 7: if (a[2]+a[3]+a[4]) == 3
sim[i,j] = 1 else
sim[i,j] = 0 } Step 8: initialize my_network, k4, b, d Step 9: for i = 1 to b do
Step 10: for j = 1 to b do d[i,j] = b[[i]][j]
We describe the improved k-clique method. The process of workflow for improved
k-clique is similarities to the workflow of the k-clique method as shown in Fig. 3. In the
k-cliques, we performed various experimental runs in order to find an improved k-cliques
method. We have created the most appropriate group and recommendation count from these experimental runs. First, we ran an experiment for a dataset in which the users are the
randomly-selected users from the list of users who rated at least 20 movies. In this case, we
performed an experiment to cluster users into several groups by using a value of k= 3 to 14
and recommended the movies to the users with the numbers of movies rated being five, 10, and 15 movies. Afterward, we performed an experiment for the dataset in which the users are the random user from the list of users who rated at least 50, 100, and 200 movies seri-ally. Then, we recommended the movie to the users with the number of movies rated being five, 10, and 15 movies successively. We performed 10 runs in order to calculate the accu-racy and used the mean value as an accuaccu-racy value.
The detail of the Improved k-clique algorithm shows in the below.
Inpout: result1.csv Output: improvedk_clique Step 1: initialized improvedk_clique
Step 2: fori= 1 to14 do{ Step 3: initialized hav
Step 4: forj= 1 to 3 do{ Step 5: fork= 1 to 3 do{
Step 6: ifimprovedk_clique[i,j]==improvedk_clique[k,1] hav = hav+ 1 }} Step 7: improvedk_clique[i,1] = i
Step 8: improvedk_clique[i,2] = hav}
[Algorithm 2] Improved k-Clique Algorithm: This algorithm was used to find the best value of a k-clique method.
Table 3 List of the recommended movies to new users
NewUserID Movie_ID
1 50, 258, 260, 288, 294, ……., 301, 303, 307 2 1, 258, 748, 7, 50, ……., 245, 273, 284 3 118, 258, 300, 748, 1, ……., 405, 597, 25 4 50, 100, 286, 127, 181, ……., 300, 137, 222 5 288, 294, 127, 286, 328, ……., 242, 243, 245
6 288, 294, 286, 50, ……., 275, 313, 100
7 50, 286, 100, 127, 181, ……., 300, 79, 137 8 1, 15, 50, 100, 111, ……., 285, 298, 546, 7 9 237, 286, 15, 50, 100, ……., 282, 471, 476 10 50, 514, 1, 56, 89, ……., 187, 194, 204 11 50, 100, 286, 56, 127, ……., 294, 303, 7 12 294, 300, 748, 118, 222, ……., 69, 79, 83 13 50, 100, 286, 127, 181, ……., 300, 137, 222 14 50, 1, 181, 89, 98, ……., 174, 204, 435 15 50, 69, 98, 144, 181, ……., 79, 82, 91
… ……
Experimental analysis
The experimental set-up is used to validate the performance of existing approaches and the proposed approach. For performance evaluation, MovieLens data is used. In order to evaluate the performance of the MovieLens data, the collaborative filtering method is
examined with the use of a k nearest neighbor, maximal clique method, k-clique method,
and an improved k-clique method in order to evaluate the performance.
Experimental set‑up
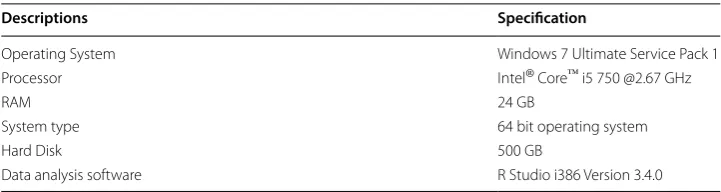
In order to implement the proposed method, the hardware and software below were
used in experimentation, as shown in Table 4.
R is a leading tool for machine learning, statistics, and data analysis that is also a
pro-gramming language. R can be used to create objects, functions, and packages. The R language is platform-independent so it can be used on any operating system. The instal-lation of R is free, so we can use it without having to purchase a license. It is not only a statistical package, and is open source, which means that anyone can examine the source code in order to see what exactly is being done on screen. Anyone can add features and fix bugs without waiting for the vendor to do this. Thus, it allows for integration with
other languages (C, C++). It also enables you to interact with many data sources and
statistical packages (SAS, SPSS). R has a large, growing community of users. The power of R is used in academia, data wrangling, data visualization, specificity, machine learn-ing, and availability.
Datasets
The proposed approach is implemented using the MovieLens dataset [30], which is the
most generalized data in movie recommendation systems. This dataset is divided into experimental data and test data. In the experimental and test data, each of them consists of 10 random datasets from a user who rated at least 20 movies, another at least 50 mov-ies, another at least 100 movmov-ies, and another at least 200 movies. There are 800 users in the experimental data, 143 users in the test data, and 100,000 ratings from 943 users on 1684 movies. Simple demographic information for users includes age, gender, and occu-pation. Details of the dataset are given below.
Testing dataset is made of a list of the users’ personalization information record. The users in the testing dataset are a random list of users from MovieLens dataset. The num-ber of users in the testing dataset is 143, with each user’s data consisting of three cat-egories of personalization information: age, gender, and occupation. The experimental
Table 4 Resources used for experimental set‑up
Descriptions Specification
Operating System Windows 7 Ultimate Service Pack 1 Processor Intel® Core™ i5 750 @2.67 GHz
RAM 24 GB
System type 64 bit operating system
Hard Disk 500 GB
dataset is the made of a list of the users’ personalization information record. The users in the experimental dataset are the remaining users after random selection from the Mov-ieLens dataset. The number of users in the experimental dataset is 800 users, with each user’s data consisting of three categories of personalization information: age, gender, and occupation.
Experimental result
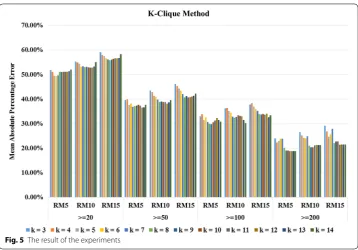
The results of the experiment depend upon the various values of k as shown in Fig. 5.
After developing the proposed movie recommendation system using improved
k-cliques, the number of movies that were to be rated by the new user among the
mov-ies recommended by the system was predicted. This paper adopts the most widely used evaluation metric for performance comparison of the proposed recommendation sys-tem. The mean absolute percentage error (MAPE) is a method of prediction accuracy of
a forecasting method in statistics that is defined by the formula [31–33]:
where At is the actual value and Ft is the forecast value.
We compared the MAPE values with the k-cliques method, the maximal clique
method, and the collaborative filtering using k nearest neighbor method to evaluate the
performance of the proposed method. If the number of outcomes is small it means that
our method is useful. For the calculation of MAPE, Eq. (2) is used. For consistency of
performance, 10 replications were performed for each trial and the mean values were taken.
(2)
MAPE= 100% n
n
t
At−Ft
At
First, we calculated the MAPE for the proposed method. The value of MAPE is 18.85%
(see below) when RM = 5, rated at least 200 movies and value of k= 11.
The value detail of MAPE using the improved k-cliques is shown in Fig. 5 above.
Fig-ure 5 shown that when a number of movies recommended is RM = 5 the minimum value
of MAPE is 18.85% where k= 11 and rated at least 200 movies, when number of movies
recommended RM = 10 the minimum value of MAPE is 20.37% where k= 10 and rated
at least 200 movies, the minimum value of MAPE is 21.41% where k= 11 and rated at
least 200 movies when RM = 15. Therefore, the best number of movies recommend is
RM = 5.
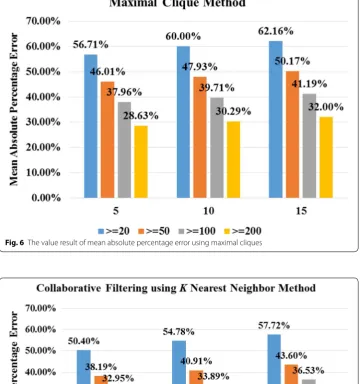
Second, we calculated the MAPE for the Maximal clique method. The value of MAPE
is 28.63% (see below) when RM = 5, rated at least 200 movies.
The value detail of MAPE using the Maximal cliques is shown in Fig. 6 below.
Fig-ure 6 shown that when a number of movies recommended is RM = 5 the minimum
value of MAPE is 28.63% where rated at least 200 movies, when number of movies
rec-ommended RM = 10 the minimum value of MAPE is 30.29% where rated at least 200
movies, the minimum value of MAPE is 32.00% where rated at least 200 movies when
RM = 15. Therefore, the best number of movies recommend is RM = 5.
Third, we calculated the MAPE for Collaborative Filtering using a k Nearest Neighbor.
The value of MAPE is 19.69% (see below) when RM = 5, rated at least 200 movies.
The value detail of MAPE using the Collaborative Filtering using a k nearest neighbor
is shown in Fig. 7 below. Figure 7 shown that when a number of movies recommended
is RM = 5 the minimum value of MAPE is 19.69% where rated at least 200 movies, when
number of movies recommended RM = 10 the minimum value of MAPE is 22.44%
where rated at least 200 movies, the minimum value of MAPE is 24.09% where rated at
least 200 movies when RM = 15. Therefore, the best number of movies recommend is
RM = 5.
Finally, we calculated the mean value result of MAPE of a k-clique method,
collabo-rative filtering using a k nearest neighbor method and a maximal clique method. After
comparing of these methods, the mean value result of MAPE computed by a movie
rec-ommendation system based on using the improved k-clique, a movie recommendation
system based on using k-clique, a movie recommendation system based on collaborative
filtering using a k nearest neighbor and that of the movie recommendation system based
on maximal clique algorithm are more accurate and efficiency, as shown in Fig. 8 below.
We also have to argue that the efficiency of the four methods is the best of our method.
(3)
MAPE= 100%
n n t
At−Ft
At = 18.85% (4)
MAPE= 100%
n n t
At−Ft
At = 28.63% (5)
MAPE= 100%
n n t
At−Ft
Conclusions
In order to achieve more accuracy than collaborative filtering methods; the maximal clique method used in social network analysis introduces in this paper is the first time that used in a movie recommendation system and the output of this method is very
effective. To achieve more accurate; the k-clique method, which is very effective in
social networks, is introduced in this experiment and the output showed this method
Fig. 6 The value result of mean absolute percentage error using maximal cliques
was more effective than maximal clique method. Therefore, this paper also proposed an
improved k-cliques method to find the most efficient method than the k-cliques method.
Finally, after several experiments were performed; in terms of the mean absolute
per-centage error used to calculate, shown in Fig. 5, which is the mean value calculated, the
best method was found when k = 11 and rated at least 200 movies with five movies
rec-ommended to the user.
For performance evaluation, we evaluated the collaborative filtering method using
a k nearest neighbor, maximal clique method, k-clique method and improved k-clique
methods. The results showed that the improved k-clique method improved the precision
of the movie recommendation system more than the other methods used in this.
Until now, it takes a long time to calculate the k-clique methods. In future studies,
we will study ways to shorten this time. And data mining method will be used with the
improved k-clique method in the future to increase the accuracy and effectiveness of the
movie recommendation system.
Authors’ contributions
PV collected, reviewed, and classified main literature for the paper, and also completed the writing of this work. PV and DSP identified the insights of this work and gave Methodology, especially the maximal clique method, k‑clique, and improve k‑clique techniques in movie recommendation system. PV and KX improved the part on Performance evalua‑ tion. The supervision has been done by DSP and FH. The validation and visualization have been done by the PV, DSP, KX, and FH. All authors read and approved the final manuscript.
Author details
1 Department of Computer Software Engineering, Soonchunhyang University, Soonchunhyang‑ro 22, Sinchang‑myeon
336‑745, Asan‑si, Chungcheongnam‑do, South Korea. 2 School of Computer Science, Shaanxi Normal University, No. 620,
West Chang’an Avenue, Xi’an 710119, China. Acknowledgements
This research was supported by the MSIP (Ministry of Science, ICT and Future Planning), Korea, under the ITRC (Information Technology Research Center) support program (IITP‑2018‑2014‑1‑00720) supervised by the IITP (Insti‑ tute for Information & communications Technology Promotion) and the National Research Foundation of Korea (No. NRF‑2017R1A2B1008421).
Competing interests
The authors declare that they have no competing interests. Ethics approval and consent to participate
Not applicable.
Publisher’s Note
Received: 22 October 2018 Accepted: 8 December 2018
References
1. Jeong WH, Kim SJ, Park DS, Kwak J (2013) Performance improvement of a movie recommendation system based on personal propensity and secure collaborative filtering. J Inf Process Syst 9:157–172
2. Viana P, Pinto JP (2017) A collaborative approach for semantic time‑based video annotation using gamification. Hum Cent Comput Inf Sci 7:13
3. Desrosiers C, Karypis G (2011) A comprehensive survey of neighborhood‑based recommendation methods. In: Ricci F, Rokach L, Shapira B, Kantor P (eds) Recommender systems handbook. Springer, Boston, pp 107–144
4. Bagci H, Karagoz P (2016) Context‑aware location recommendation by using a random walk‑based approach. Knowl Inf Syst 47:241–260
5. Wong F, Lee S, Wong Q, Lee S (2015) Points of interest recommendation based on context‑aware. Int J Hybrid Inf Technol 8:55–62
6. Lee D (2015) Personalizing information using users’ online social networks: a case study of CiteULike. J Inf Process Syst 11:1–21
7. Zou HT, He Y, Zheng S, Yu HL, Hu C (2018) Online group recommendation with local optimization. CMES: 217–231 8. Hui P, Crowcroft J (2008) Human mobility models and opportunistic communications system design. Phil Trans R
Soc A. https ://doi.org/10.1098/rsta.2008.0010:2005‑2016
9. Hao F, Park DS, Pei Z (2018) When social computing meets soft computing: opportunities and insights. Hum Cent Comput Inf Sci 1:8
10. Hao F, Park DS, Min G, Jeong YS, Park JH (2016) k‑cliques mining in dynamic social networks based on triadic formal concept analysis. Neurocomputing 209:57–66
11. Ryu PM (2018) Predicting the unemployment rate using social media analysis. J Inf Process Syst 14:904–915 12. Hao F, Sim DS, Park DS, Seo HS (2017) Similarity evolution between graphs: a formal concept analysis approach. J Inf
Process Syst 13:1158–1167
13. Carlos P, Alberto CL, Juan BM, Alvaro TL, Enrique HV (2017) Fuzzy linguistic recommender systems for the selective diffusion of information in digital libraries. J Inf Process Syst 13:653–667
14. Hao F, Park DS, Pei Z (2017) Detecting bases of maximal cliques in social networks. MUE2017 1–1
15. Ricci F, Rokach L, Shapira B (2011) Introduction to recommender systems handbook, recommender systems hand‑ book. Springer, Berlin, pp 1–35
16. Jafarkarimi H, Sim ATH, Saadatdoost R (2012) A naïve recommendation model for large databases. Int J Inf Educ Technol 2:216–219
17. Linden, Gregory D, Smith BR, Zada KN (2015) Automated detection and exposure of behavior‑based relationships between browsable items U.S. Patent 9,070,156
18. Neil R, Mehdi E, Masashi S, Dain K (2016) Active learning in recommender systems handbook, 2nd edn. Springer, US. ISBN 978‑1‑4899‑7637‑6
19. Hao F, Min G, Pei Z, Park DS, Yang LT (2015) K‑clique communities detection in social networks based on formal concept analysis. IEEE Syst J. https ://doi.org/10.1109/jsyst .24332 94
20. Gregori E, Lenzini L, Mainardi S (2013) Parallel (k)‑clique community detection on large‑scale networks. IEEE Trans Parallel Distrib Syst 24:1651–1660
21. Palla G, Derenyi I, Farksa I, Vicsek T (2005) Uncovering the overlapping community structure of complex networks in nature and society. Nature 435:814–818
22. Kumpula J, Kivela M, Kaski K, Saramaki J (2008) Sequential algorithm for fast clique percolation. Phys Rev E 78:026109 23. Adamcsek B, Palla G, Farkas I, Derenyi I, Vicsek T (2006) CFinder: locating cliques and overlapping modules in biologi‑
cal networks. Bioinformatics 22:1021–1023
24. Saito K, Yamada T, Kazama K (2009) The k‑dense method to extract communities from complex networks. In: Zighed DA, Tsumoto S, Ras ZW, Hacid H (eds) Mining complex data Studies in computational intelligence, vol 165. Springer, Berlin, Heidelberg, pp 243–257
25. Farkas I, Abel D, Palla G, Vicsek T (2007) Weighted network modules. New J Phys 9:180
26. Duan D, Li Y, Li R, Lu Z (2011) Incremental k‑clique clustering in dynamic social networks. Artif Intell Rev 38:129–147 27. Dubey VK, Saxena AK (2016) Cosine similarity based filter technique for feature selection. In: IEEE Int. Conf. on Con‑
trol, Computing, Communication and Materials IEEE, Piscataway, pp 1–6
28. Lahitani AR, Permanasari AE, Setiawan NA (2016) Cosine similarity to determine similarity measure: Study case in online essay assessment. In: 4th international conference on cyber and IT service management. IEEE, Piscataway, pp 1–6
29. Wen X, Chen WN, Lin Y, Gu TL, Zhang H, Li Y, Yin Y, Zhang J (2017) A maximal clique based multi objective evolution‑ ary algorithm for overlapping community detection. IEEE Trans Evol Comput 21:363–377
30. Harper FM, Konstan JA (2015) The MovieLens datasets: history and context. ACM Trans Interact Intell Syst (TiiS) 5:19 31. Tofallis C (2015) A better measure of relative prediction accuracy for model selection and model estimation. J Op
Res Soc 66:1352–1362
32. Kim S, Kim HY (2016) A new metric of absolute percentage error for intermittent demand forecasts. Int J Forecast 32:669–679