ARTICLE
Comparison of Current Health, Functional
Limitations, and Health Care Use of Young Adults
Who Were Born With Extremely Low Birth Weight
and Normal Birth Weight
Saroj Saigal, MD, FRCP(C)a, Barbara Stoskopf, RN, MHSca, Michael Boyle, PhDb, Nigel Paneth, MD, MPHc, Janet Pinelli, RNC, MScN, DNSa,d, David Streiner, PhDe, John Goddeeris, PhDf
Departments ofaPediatrics andbPsychiatry and Neurosciences anddSchool of Nursing, McMaster University, Hamilton, Ontario, Canada; Departments ofcEpidemiology,
Pediatrics, and Human Development andfEconomics, Michigan State University, East Lansing, Michigan;eDepartment of Psychiatry, University of Toronto, Toronto,
Ontario, Canada
The authors have indicated they have no financial relationships relevant to this article to disclose.
ABSTRACT
OBJECTIVE.The objective of this study was to compare the current health status, physical ability, functional limitations, and health care use of extremely low birth weight and normal birth weight young adults.
METHODS.A longitudinal study was conducted of a population-based cohort of 166 extremely low birth weight survivors (501–1000 g birth weight; 1977–1982 births) and a group of 145 sociodemographically comparable normal birth weight indi-viduals. Current health status, history of illnesses, hospitalizations, use of health resources, and physical self-efficacy were assessed through questionnaires that were administered to the young adults by masked interviewers.
RESULTS.Individuals completed the assessments at a mean age of 23 years. Neuro-sensory impairments were identified in 27% of extremely low birth weight and 2% of normal birth weight individuals. No differences were reported in the current health status for physical or mental summary scores. Extremely low birth weight young adults reported a higher prevalence of chronic health conditions in the past 6 months. A significantly higher proportion of extremely low birth weight indi-viduals had functional limitations in seeing, hearing, and dexterity and experi-enced clumsiness and learning difficulties. Except for prescription glasses, medi-cations for depression, and home-care services for extremely low birth weight individuals, there were no significant differences between groups in use of health care resources. Extremely low birth weight individuals had significantly weaker hand grip strength and lower scores for physical self-efficacy, perceived physical ability, and physical self-confidence.
CONCLUSIONS.Extremely low birth weight young adults seem to enjoy similar current health status to their normal birth weight peers. However, they continue to have
www.pediatrics.org/cgi/doi/10.1542/ peds.2006-2328
doi:10.1542/peds.2006-2328
Key Words
health, chronic conditions, functional limitations, health care use, physical abilities
Abbreviations
VLBW—very low birth weight ELBW— extremely low birth weight NBW—normal birth weight YA—young adult
NSI—neurosensory impairments OR— odds ratio
CI— confidence interval Accepted for publication Sep 26, 2006
Address correspondence to Saroj Saigal, MD, McMaster University, Department of Pediatrics, 1200 Main St W, Room 4G40, Hamilton, Ontario, Canada L8N 3Z5. E-mail: [email protected]
significantly poorer physical abilities and a higher prev-alence of chronic health conditions and functional lim-itations. Contrary to expectations, they do not pose a significant burden to the health care system at young adulthood.
R
ECENT REPORTS ON the long-term outcomes of very low birth weight (VLBW) and extremely low birth weight (ELBW) infants who were born in the early post–neonatal intensive care era have moved beyond midchildhood and adolescence into young adulthood. At adolescence, most reports indicate that substantial morbidity persists in intellectual status, schoolachieve-ments,1–3 behavioral difficulties,4 and lower growth
at-tainment compared with the normal birth weight (NBW)
group.5–7 Although there is some reduction in acute
health care problems, the VLBW individuals have signif-icantly higher rates of functional limitations, greater compensatory dependence, and increased use of health care resources.8,9
In the few studies that have pursued additional fol-low-up, many of the educational and growth disad-vantages that are associated with being of ELBW and
VLBW have persisted to adulthood.10–16However, little is
known of the functional limitations, health status, and health care needs of these vulnerable young adults (YAs) once they are too old to use pediatric services. Such information is necessary to project and plan for medical services beyond those that routinely are required by the general population at adulthood and middle age.
In this report, we present data at young adulthood on the general health, physical abilities, functional limita-tions, and health care use of a regional cohort of former ELBW infants who have been followed longitudinally
from birth17in comparison with a term-born NBW group.18
We hypothesized that although ELBW YAs would con-tinue to have more chronic health problems, greater functional limitations, and poorer physical abilities than NBW YAs, there would be no differences in their current health status; furthermore, the absolute rates of use of health care services would decline even further than
previously reported at adolescence.6
METHODS
Participants
ELBW survivors (501–1000 g birth weight) who were born between 1977 and 1982 to residents of a geograph-ically defined region in central-west Ontario were
fol-lowed longitudinally from birth.17 We previously
re-ported on their growth and health outcomes at age 8,18
in adolescence,6and at young adulthood.16
At 8 years of age, term-born children (1977–1981 births) who were comparable in gender, age, and social
class19to the ELBW group were randomly recruited from
a list that was provided by the local school boards and
followed longitudinally.18
Interview Protocol
The YAs were the primary respondents for all question-naires and were interviewed by lay professional inter-viewers who were unaware of the group status. The interview process involved a structured format using scripted questions with a skip pattern that was adminis-tered in the same order. The majority (93%) of inter-views were conducted at McMaster Children’s Hospital (Hamilton, Ontario, Canada) between January 1, 2002, and April 30, 2004. Information regarding health status and health care use of YAs with severe impairment was obtained from their parents.
Questionnaires
Ethics approval was obtained from the Research Ethics Board of Hamilton Health Sciences, and written in-formed consent was obtained from all YAs and their parents.
Demographics
Age, marital status, current living arrangements, house-hold membership, educational attainment and employ-ment were obtained from the YAs by direct interview. Parents provided information on their own education and current employment. Both maternal and paternal variables were included to assign parental
socioeco-nomic status.19
General Health Information
The following standardized questionnaires were used:
● SF-3620: A widely used and well-validated 36-item
questionnaire measures physical and mental health in the previous 4 weeks across 8 domains. Physical health summary score is derived from 4 subscales: physical functioning (10 items that describe ability to do phys-ical tasks), role—physphys-ical (4 items about difficulties or limitations in physical ability), bodily pain (2 items), and general health (5 items). Mental health summary score also has 4 subscales: vitality (4 items that mea-sure energy level), social functioning (2 items regard-ing physical and mental health interferregard-ing with nor-mal social life), role— emotional (3 items about effect of mental problems on everyday life), and mental health (5 items that measure mood). Scores were con-verted to norm-based scores (mean: 50; SD: 10). In addition, respondents were asked to rate their health in 1 of the following categories: excellent, very good, good, fair, or poor.
● Ontario Child Health Study Questionnaire21: Provides
months or longer); absenteeism at work or at school as a result of chronic health problems; and limitations in normal activities as a result of health problems.
● Canadian Community Health Survey (Statistics
Can-ada)22–24: Data from cycles 2.1 (2003) and 3.1 (2005)
on the health of YAs (aged 20 –24) are presented as footnotes in the tables where relevant information is available.
Physical Self-Efficacy Scale
The Physical Self-Efficacy Scale25 is a self-administered
questionnaire that provides information on total physi-cal self-efficacy, perceived physiphysi-cal ability, and physiphysi-cal self-presentation confidence.
Hand-Grip Strength
Hand-grip strength was measured independently in both hands using a dynamometer. Data are presented for dom-inant hand for participants without neurosensory impair-ments (NSI).
Use of Health Care Resources
The questionnaire was based on several sources.26,27The
information included visits to all health professionals, outpatient tests, and use of home-care services in the past 6 months and hospitalizations and surgery in the past 12 months. All medications that were taken on a regular basis (and reasons for taking) were noted. Use of mechanical aids or assistive devices and home/car/house adaptations, etc, were also recorded.
Statistical Analyses
2 tests of significance were used to test differences in
categorical variables between groups (ELBW versus NBW) and gender-specific differences. Fisher’s exact test was used when necessary. For variables with significant dif-ferences, analysis of variance to compare mean differ-ences between groups and odds ratios (ORs) and 95%
confidence intervals (CI) were calculated. T tests were
used to compare mean values. Although exactPvalues
are provided where applicable, because of multiple
test-ing, Holm’s correction28was applied to allP⬍.05
sep-arately for each table (for total group and by gender) to establish statistical significance. Values that were found to be significant by Holm’s correction are indicated with
a superscriptHolm’sbeside thePvalues. SPSS11.0 (SPSS,
Chicago, IL) was used for all statistical analyses.
RESULTS
Study Participants
ELBW Participants
Of 397 livebirths, 179 (45%) survived to hospital
dis-charge17; 13 children subsequently died: 6 before 3 years
of age, 4 with severe NSI between 9 and 16 years, and 3
in the late teens (1 NSI). Of 166 individuals available, 9 were lost and 8 refused (6 of these 17 had NSI). The outcome is reported on 149 (90%) of 166 ELBW YAs, including 7 with severe NSI for whom parental proxy responses were obtained.
NBW Participants
Of the 145 term control subjects,185 were lost to
follow-up, 7 refused (none had NSI), and the remaining 133 (92%) participated.
Birth Characteristics and Sociodemographics of Parents and YAs
Mean birth weight for the ELBW cohort was 841 g (SD: 124 g), and mean gestational age was 27.1 (SD: 2.3) weeks (Table 1). More than one quarter of ELBW
indi-viduals were⬍750 g (27%), 22% were⬍26 weeks, and
24% were small for gestational age.29Mean duration of
hospitalization was 101 (SD: 32) days. Both cohorts
predominantly were white (⬎94%) and from 2-parent
families (⬎79%), and approximately half were from the
upper 2 socioeconomic levels.19 Highest educational
achievement did not differ between cohorts. Mean age at assessment was 23.3 years (SD: 1.2 years) for ELBW
and 23.6 years (SD: 1.1 years) for NBW (P⫽.02).
TABLE 1 Birth Characteristics and Parental and Young Adulthood Sociodemographics of ELBW and NBW Participants
Characteristic ELBW
(N⫽149)
NBW (N⫽133)
Birth characteristics
Birth weight, mean (SD), g 841 (124) 3384 (487)
Gestation, mean (SD), wk 27.1 (2.3) Term
⬍750 g birth weight,n(%) 40 (27) —
⬍26 wk gestation,n(%) 33 (22) —
Small for gestational age,29n(%) 36 (24) 4 (3)
Male gender,n(%) 67 (45) 60 (45)
White race,n(%) 140 (94) 129 (97)
Neonatal hospitalization, d
Mean (SD) 101 (32) —
Median (range) 96 (27–193)
Current family characteristics, %
Family status (2 parents) 82 79
Social class19
I, II 47 56
III 30 21
IV, V 23 23
YA participants
Highest educational achievement to date, %
Less than high school 17 12
High school 54 56
College/trades 24 18
University 5 14
Participants assessed, % 90 92
Age at assessment, mean (SD), y 23.3 (1.2) 23.6 (1.1)a
Current General Health
There were no significant differences by group among the 8 scales of SF-36, except that ELBW individuals
scored lower on mental health (P⫽.04) and ELBW male
individuals had lower scores than NBW male individuals
for physical functioning scale (P⫽.04; Table 2). None of
the group ⫻gender interactions was significant. There
were no differences by group or by gender in the SF-36 summary scores for physical or mental health. However, when asked to rate their health in 1 of 5 categories (excellent, very good, good, fair, or poor), statistically
significant differences were found by group (P ⫽ .03)
and among male individuals (P ⫽ .04), with ELBW
individuals reporting their health less favorably than
NBW individuals (and Canadian data22). These
differ-ences became nonsignificant when YAs with NSI were excluded.
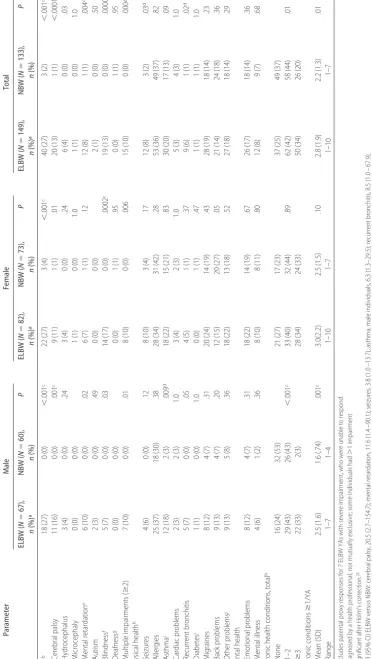
Chronic Health Conditions
ELBW YAs had a higher prevalence of NSI (27% vs 2%; P ⬍.001Holm’s) and were more likely to have multiple
(ⱖ2) impairments (10% vs 0%;P ⫽.0004Holm’s; Table
3). Differences in chronic physical conditions (ELBW versus NBW) were present for the following: seizures
(8% vs 2%; OR: 3.8; 95% CI: 1.0 –13.7;P⫽.03), asthma
(male individuals only; 18% vs 3%; OR: 6.3; 95% CI:
1.3–29.5; P ⫽ .009), and recurrent bronchitis (6% vs
1%; OR: 8.5; 95% CI: 1.0 – 67.9; P⫽.02). The
propor-tion of ELBW individuals with asthma by group and
gender is higher than the Canadian data23(see Table 3,
footnote i). There were no differences in emotional problems and mental illness between groups.
When chronic physical health problems were aggre-gated, ELBW YAs differed significantly from NBW YAs: a lower proportion had no problems, and a higher
propor-tion hadⱖ3 problems (P⫽.01). Similar differences were
seen in male individuals (P ⬍ .001Holm’s) but not in
female individuals (P ⫽ .89). However, when
partici-pants with NSI were excluded, these differences no longer were significant for the overall group or for fe-male individuals, but differences among fe-male
individu-als remained significant (P ⫽.001). Among those who
had at least 1 chronic condition, the mean number per individual was 2.8 (SD: 1.9) for ELBW versus 2.2 (SD:
0.14) for NBW (P⫽.01).
Injuries
Self-report of injuries in the past 12 months, serious enough to limit normal activities, did not differ between
groups (ELBW 24% vs NBW 22%;P⫽.71). However,
both groups reported slightly higher rates than the
gen-eral Canadian population (18%, aged 20 –24).23
Late Retinal Detachment
In eliciting details of types of surgeries, we unexpectedly found that 6 ELBW YAs (4%) experienced sudden late retinal detachment, with 2 YAs remaining blind in the affected eye after laser surgery. Voluntary
ophthalmo-TABLE 2 SF-36 Scores: 8 Scales and Summary Scores for ELBW and NBW YAs According to Gender
Parameter Male Female Total
ELBW (N⫽62), Mean (SD)a
NBW (N⫽60), Mean (SD)
P ELBW
(N⫽80), Mean (SD)a
NBW (N⫽73), Mean (SD)
P ELBW
(N⫽142), Mean (SD)a
NBW (N⫽133), Mean (SD)
P
Scalesb
Physical functioning 54.9 (5.1) 56.3 (1.6) .04 53.3 (6.1) 54.1 (5.4) .39 54.0 (5.7) 55.1 (4.2) .07
Role—physical 53.3 (7.9) 54.1 (6.0) .50 53.2 (7.1) 52.0 (8.3) .32 53.2 (7.4) 53.0 (7.4) .74
Bodily pain 55.1 (8.1) 55.4 (8.1) .84 53.8 (9.6) 54.3 (9.5) .73 54.4 (9.0) 54.8 (8.9) .68
General health 54.0 (10.0) 56.3 (6.7) .12 51.3 (11.4) 52.3 (10.4) .54 52.4 (10.8) 54.1 (9.1) .16
Vitality 54.4 (10.5) 55.6 (7.7) .48 51.4 (10.8) 53.6 (9.7) .18 52.7 (10.7) 54.5 (8.9) .13
Social functioning 51.1 (9.4) 51.4 (7.8) .85 49.6 (11.2) 51.1 (7.8) .32 50.2 (10.5) 51.2 (7.7) .36
Role—emotional 50.0 (10.6) 51.8 (5.8) .24 49.3 (10.8) 50.8 (9.3) .37 49.6 (10.7) 51.2 (7.9) .15
Mental health 50.2 (12.0) 52.6 (8.7) .20 48.5 (12.9) 51.4 (8.9) .10 49.2 (12.5) 51.9 (8.8) .04
Summary measures
Physical healthc 55.9 (6.6) 56.7 (5.2) .50 54.5 (7.0) 54.0 (7.9) .68 55.1 (6.9) 55.2 (6.9) .92
Mental healthd 49.4 (12.0) 51.2 (8.7) .35 47.7 (13.6) 50.7 (9.8) .12 48.4 (12.9) 50.9 (9.3) .07
Self-rated health,n(%) Canadae, % Canadae, % Canadae, %
Excellent 20 (32) 19 (32)f 27 17 (21) 15 (21) 27 37 (26) 34 (26)f 27
Very good 16 (26) 29 (48)f 42 34 (43) 35 (48) 43 50 (35) 64 (48)f 43
Good 18 (29) 9 (15)f 25 20 (25) 19 (26) 24 38 (27) 28 (21)f 25
Fair/poorg 8 (13) 3 (5)f 5 9 (11) 4 (5) 6 17 (12) 7 (5)f 5
aExcludes 7 ELBW YAs with severe disabilities, who were unable to answer for themselves (male,n⫽5; female,n⫽2). bNorm-based: mean⫽50, SD⫽10, based on 1998 US general population data.20
cDerived from physical functioning, role—physical (limitations as a result of physical health), bodily pain, and general health. dDerived from vitality, social functioning, role— emotional (limitations as a result of emotional problems), and mental health. eCanadian data from Statistics Canada22(ages 20 –24 years;n⫽6 404 036).
logic assessments on 45 ELBW YAs yielded 3 additional cases of retinal tears that also required surgery. None of the NBW YAs experienced the same.
Current Functional Limitations
ELBW YAs reported significantly more functional limi-tations than NBW YAs by group and by gender for the
following variables (Table 4): difficulty seeing (group P
⬍.001Holm’s, maleP⫽.002Holm’s, femaleP⬍.001Holm’s),
bilateral blindness (group P ⫽ .001Holm’s, female P ⫽
.01), clumsiness (group P⫽.001Holm’s; maleP ⫽.007,
femaleP⫽.02), dexterity (P⫽.002Holm’s; maleP⫽.02,
female P ⫽ .02), and learning disabilities (group P ⬍
.001Holm’s, male P ⫽ .003, female P ⬍ .001Holm’s). In
addition, there were differences by group (P⫽.04) but
not by gender for hearing difficulties and reduced
self-care abilities (P⫽.03). These results include 7 parental
proxy responses.
When functional limitations were summed and
com-pared by categories of none, 1 to 2 and ⱖ3, ELBW
individuals were less likely to have no limitations and more likely to have multiple limitations. These
differ-ences were significant by group (P⬍.001Holm’s) and by
gender (P⬍.001Holm’s) and remained significant when
NSI were excluded.
More ELBW than NBW YAs reported limitations in carrying out “normal daily activities” as a result of health
problems (21% vs 11%; OR: 2.1; 95% CI: 1.0 – 4.0;P⫽
.03, NS by gender; corresponding Canadian data
19.1%23). These differences became NS when
individu-als with NSI were excluded. Among those with limita-tions, there were significant differences between groups
in the reasons for limitations (P ⫽ .00004, data not
shown): a significant majority (81%) of ELBW individ-uals cited mental illness and NSI as the main reasons, whereas a similar proportion (80%) of NBW individuals identified chronic conditions and acute injuries.
There were no significant differences by group (ELBW versus NBW: 24% vs 19%) or by gender (male: 16% vs 13%; female: 30% vs 23%) in the proportion with any absenteeism from school/work as a result of illness during the previous month. The proportions with absenteeism are similar to the Canadian data (male:
14.7%; female: 22.2%; total: 18.3%).23However,
signif-icant differences were noted for mean number of days absent among female individuals (ELBW: 5.5 days [SD:
6.3 days]; NBW: 2.6 days [SD: 2.2 days];P⫽.04, data
not shown).
Health Care Use
There were no significant differences by group or by gender for the proportion with overnight hospitaliza-tions or surgery in the past 12 months (Table 5). During the past 6 months, there were no differences in the proportion with visits to the emergency department or
visits to any health professionals by group or by gender, with the exception of social worker contacts by ELBW
female individuals (13% vs 4%; P⫽.04). The
propor-tion who had outpatient investigapropor-tions did not differ by group or by gender.
The use of prescription drugs differed significantly by group only for medications for depression (ELBW 14%
vs NBW 6%; OR: 2.6; 95% CI: 1.0 – 6.0; P⫽.025) but
not by gender. In terms of assistive devices/aids, there were no significant differences in the use of braces, crutches, or canes between groups, although the reasons for their use differed: ELBW individuals had chronic conditions related to NSI, whereas NBW individuals had acute injuries. Four ELBW and 1 NBW YA required wheelchairs, whereas none of the NBW individuals did
(P⫽.43); and prescription glasses were required more
often by ELBW YAs (64% vs 37%; OR: 3.1; 95% CI:
1.9 –5.0; P ⬍ .001Holm’s; male P ⫽ .002, female P ⬍
.001Holm’s). In addition, a higher proportion of ELBW
individuals required visual aids such as Braille
equip-ment and canes (group P ⫽ .002Holm’s; female P ⫽
.003Holm’s). Very few participants wore hearing aids (2
female ELBW and 1 female NBW), despite more who reported “hearing problems.”
Although a minority of individuals required home-care services, there were significant differences between
groups (8% vs 2%; OR: 5.7; 95% CI: 1.2–26.1;P⫽.01).
Significantly more ELBW than NBW YAs received ser-vices such as household help, specialized companion-ship, and personal care (7% vs 1%; OR: 9.5; 95% CI:
2.0 –39.5;P⫽.009). One ELBW female individual with
severe impairment required episodic respite care, and another ELBW female individual was in permanent fos-ter care.
Physical Self-Efficacy, Physical Activity, and Hand-Grip Strength
ELBW YAs had significantly lower total scores in the
physical self-efficacy scale (P⬍.001Holm’s) and in the 2
subscales of perceived physical ability (P⬍.001Holm’s) by
group and by gender and in physical self-presentation
confidence by group (P ⫽ .001Holm’s) and by female
gender (P⫽.002Holm’s; Table 6). These differences
per-sisted even when individuals with NSI were excluded. A significantly lower proportion of ELBW versus NBW YAs reported regular participation in sports and
strenuous activities (38% vs 59%; P⫽.001Holm’s), and
the proportion also was lower in comparison with
Ca-nadian data (60.2%; see Table 6, footnote d).23A higher
proportion of ELBW individuals attributed the lower
participation rates to health conditions (22% vs 9%;P⫽
.004Holm’s). However, although differences were
ob-served among male individuals (P ⬍ .001Holm’s), there
differences between groups in participation rate
re-mained significant after NSI were excluded (P⫽.02).
Despite exclusion of those with NSI, ELBW YAs had significantly lower hand-grip strength in their dominant hand compared with NBW YAs (32 [SD: 10] vs 38 [SD: 10];P⬍.001Holm’s) and by gender (maleP⫽.002Holm’s;
female P ⬍ .001Holm’s). The analysis of variance was
significant for group (P⬍.001) and gender (P⬍.001),
but there was no interaction.
DISCUSSION
The findings of this study confirm our hypotheses that by the time ELBW survivors reach adulthood, their cur-rent physical and mental health is similar to that of NBW YAs for overall group and by gender. Except for a higher prevalence of NSI, differences were observed in only a few residual chronic health conditions, such as seizures, recurrent bronchitis, and asthma (male individuals). Al-though still significantly different, both groups had a
TABLE 5 Health Care Use in Past 6 to 12 Months: ELBW and NBW YAs According to Gender
Parameter Male Female Total
ELBW (N⫽67),
n(%)a
NBW (N⫽60),
n(%)
P ELBW
(N⫽82),
n(%)a
NBW (N⫽73),
n(%)
P ELBW
(N⫽149),
n(%)a
NBW (N⫽133),
n(%)
P
Past 12 mo
Hospitalization overnight 4 (6) 0 (0) .12 11 (13) 12 (16)b .59 15 (10) 12 (9) .76
No. of times, mean (SD) 1.5 (1.0) 0 (0) 1.1 (.30) 1.5 (.79) .12 1.2 (.56) 1.5 (.80) .28
No. of nights, mean (SD) 5.8 (9.5) 0 (0) 6.5 (6.5) 4.5 (3.9) .38 6.3 (7.0) 4.5 (3.9) .41
Surgery 6 (9) 3 (5) .49 8 (10) 6 (8) .73 14 (9) 9 (7) .42
Past 6 mo
Emergency department 15 (22) 8 (13) .17 18 (22) 12 (16) .40 33 (22) 20 (15) .12
Family physician 37 (55) 26 (43) .18 62 (76) 56 (77) .87 99 (66) 82 (62) .40
Specialist physician 16 (24) 9 (15) .19 23 (28) 23 (32) .63 39 (26) 32 (24) .65
Psychologist 3 (4) 4 (7) .70 4 (5) 2 (3) .68 7 (5) 6 (5) .93
Social worker 1 (1) 2 (3) .60 11 (13) 3 (4) .04c 12 (8) 5 (4) .12
Physiotherapist/OT 3 (4) 2 (3) 1.0 5 (6) 7 (10) .41 8 (5) 9 (7) .62
Speech therapist 1 (1) 0 (0) 1.0 0 (0) 1 (1) .47 1 (1) 1 (1) 1.0
Other health care providersd 7 (10) 5 (8) .68 10 (12) 14 (19) .23 17 (11) 19 (14) .46
Outpatient tests 18 (27) 14 (23) .64 38 (46) 32 (44) .65 56 (38) 46 (35) .54
Prescription medications (currently required on a regular basis)
Epilepsy 3 (4) 0 (0) .24 5 (6) 3 (4) .72 8 (5) 3 (4) .17
Hyperactivity/behavioral other 2 (3) 0 (0) .52 1 (1) 0 (0) 1.0 3 (2) 0 (0) .28
Depression 5 (7) 1 (2) .21 16 (20) 7 (10) .08 21 (14) 8 (6) .025c
Asthma 5 (7) 3 (5) .72 8 (10) 5 (7) .51 13 (9) 8 (6) .37
Assistive devices/aidse
Required in past 12 mo (not mutually exclusive)
Braces/crutches/cane 3 (4) 4 (7) .88 4 (5) 3 (2) .72 7 (5) 7 (5) .82
Wheelchair 3 (4) 0 (0) .28 1 (1) 1 (1) 1.0 4 (3) 1 (1) .43
Prescription glasses/contacts 36 (54) 16 (27) .002c 60 (73) 33 (45) ⬍.001c,f 96 (64) 49 (37) ⬍.001c,f
Vision aids (Braille equipment, white cane, etc) 1 (1) 0 (0) 1.0 9 (11) 0 (0) .003f 10 (7) 0 (0) .002f
Hearing aids 0 (0) 0 (0) 3 (4) 1 (1) .62 3 (2) 1 (1) .62
Other adaptations (house /furniture/car) 2 (3) 0 (0) .52 4 (5) 1 (1) .43 6 (4) 1 (1) .17
Home care (past 6 mo)
Required any home care service 4 (6) 0 (0) .12 8 (10) 2 (2) .10 12 (8) 2 (2) .01c
Type of services required (not mutually exclusive)
Skilled medical care 1 (1) 0 (0) 1.0 1 (1) 1 (1) 1.0 2 (1) 1 (1) 1.0
Personal care 2 (3) 0 (0) .49 2 (2) 0 (0) .49 4 (3) 0 (0) .12
Other (companionship, household help) 5 (7) 0 (0) .08 5 (6) 1 (1) .26 10 (7) 1 (1) .009c
Other care
Temporary respite care 0 (0) 0 (0) — 1 (1) 0 (0) 1.0 1 (1) 0 (0) .95
Permanent foster care 0 (0) 0 (0) — 1 (1) 0 (0) 1.0 1 (1) 0 (0) .95
OT indicates occupational therapist.
aIncludes parental proxy responses for 7 ELBW individuals with severe disabilities, who were unable to answer for themselves.
bWhen child birth was excluded from those with overnight hospitalization, the proportions decreased to 10% for female individuals in both groups.
cOR (95% CI): Social worker, female 3.6 (0.9 –13.5); any home care service, total group 5.7 (1.2–26.1); other home care services, total group 9.0 (2.0 –39.5); medications for depression, total group 2.6
(1.0 – 6.0); prescription glasses, male 3.2 (1.5– 6.7), females 3.3 (1.6 – 6.4), total group 3.1 (1.9 –5.0).
dFor example, chiropractor, massage therapist, optometrist.
eSome mobility aids were required for temporary problems only (eg, orthopedic surgery). One ELBW female with hearing problems required a telephone device; this is included in the total with
hearing aids. An additional 6 ELBW required minor aids (not shown in table), eg, orthotics, glucose monitor, ostomy supplies, special utensils, etc.
relatively low proportion without any chronic condi-tions. The mean number of chronic conditions per indi-vidual remained significantly higher for ELBW than for NBW individuals. ELBW YAs also had higher rates of functional limitations, mainly in visual deficits and dex-terity, and of clumsiness and learning difficulties, and a minority had reduced self-care abilities and hearing problems. These limitations remained significant when YAs with NSI were excluded. Twice as many ELBW versus NBW YAs reported limitations in daily activities related to health problems, but these differences were attributed mainly to those with NSI. It is important to reiterate that although ELBW participants had a higher prevalence of chronic conditions and functional limita-tions, the NBW group was not without significant diffi-culties. These results underscore the importance of a comparison group to place the findings in perspective.
Cooke et al13 found no significant differences in
health status between mainstream 20-year-old British VLBW and NBW YAs, except for lower physical func-tioning score (SF-36) and lower general health percep-tion by male VLBW YAs. Unfortunately, the response
rate in this study was only 50%. Hack et al11 reported
higher rates of chronic health conditions (33% vs 21%) and multiple conditions among Cleveland VLBW versus NBW YAs. However, with the exception of those with NSI, the health status of VLBW YAs was equivalent to that of NBW control subjects. Similar findings were
re-ported by Ericson and Ka¨llen10in VLBW male
individu-als. A few studies reported higher rates of asthma and
use of inhalers13,30and some residual effects on
respira-tory function.30,31
Remarkably, we found no differences in use of health care resources at young adulthood, in terms of acute illnesses, hospitalizations, surgical procedures, and visits to specialists. There also were no differences in the use of rehabilitative services, such as occupational therapists, physiotherapists, and speech pathologists. Use of pre-scription medications was similar in both groups, except for medications for depression. Assistive devices such as wheelchairs were limited to those with NSI, and a sim-ilar proportion of both cohorts used braces and crutches, usually for acute injuries in the case of NBW YAs. A minority of ELBW YAs required home-care services for personal care and household help, foster care, and tem-porary respite care.
The most frequent compensatory aid that was used by ELBW was prescription glasses. The high prevalence of visual problems at young adulthood also was reported by
Hack et al11 and Ericson.10 However, of particular
con-cern in our study were the high rates of late retinal detachment (4%), which seem to have occurred in our study participants (born before the cryotherapy era), since the last assessment at adolescence. The discovery of 3 additional individuals with asymptomatic retinal tears among 45 YAs who volunteered to be tested lead us to
believe that there may be other undetected cases. Sim-ilarly, the 15-year outcome study of the Cryotherapy for Retinopathy of Prematurity trial for threshold
retinopa-thy32 found retinal detachment in 4.5% of treated eyes
and 7.7% of control eyes. What is worrisome is that these events occurred in eyes that were judged to be normal at the 10-year assessment. The development of these adverse outcomes indicates the need for lifelong
follow-up of people with a history of retinopathy.32
There are no available reports in the literature for comparison with our study regarding use of health care resources by ELBW individuals at young adulthood.
Di-rect comparison with our same cohort at adolescence6
was not possible because the respondents in the last study were parents and the time frame was in the past 2 years. The respondents this time were the YAs, and for reasons of recall bias, the period of inquiry was only for the last 6 to 12 months. We are aware of differences in perceptions regarding health conditions between parents
and children,4,9,33but whether there also are differences
in responses related to health care use is not known. It is possible that the lack of significant differences in this study may be a reflection of the overall low base rates of health care use at this age. It is clear that the costs to the health care system and other services that are associated with extreme prematurity are substantial in the early
years and persist into midchildhood.34,35Thereafter, we
have shown that there is a significant decline in use of
health services around adolescence6and beyond.
Con-trary to the earlier pessimistic projections,36 ELBW YAs
do not pose a considerable lifelong burden to the health care system. Economic evaluation is in progress.
Consistent with this study, several investigators9–11
reported that VLBW adolescents and YAs lead a less active physical lifestyle and have limited participation in sports and strenuous activities. A reduction in muscle strength and physical working capacity among VLBW
boys was reported by Ericson et al.10Rogers et al37found
that 17-year-old unimpaired ELBW survivors had signif-icantly lower motor performance than control subjects in aerobic capacity, strength, endurance, flexibility, and activity level. They speculated whether the lower scores on these measures were a result of extreme prematurity (subclinical pulmonary compromise or subtle
neuromo-tor difficulties) or possible sheltering by parents38 or
reflected a preference by the ELBW individuals for a lower physically active lifestyle. However, we and others have reported that ELBW children are consistently de-scribed by their parents as having problems with
clum-siness and coordination,6,37,39which also were
acknowl-edged by the ELBW YAs themselves in this study. In addition, they rated themselves lower in perceived phys-ical ability and physphys-ical self-presentation confidence and were found to have lower hand-grip strength. Over-all, a lower proportion of ELBW YAs participated in
regular physical activities in comparison with NBW YAs
and the Canadian national norms.22
CONCLUSIONS
This is the first longitudinal study of the health status, chronic conditions, physical abilities, and health care use at young adulthood for ELBW survivors who were born in the early era of neonatal intensive care. These data were derived from a defined geographic region with high participation rates, include a control group, and were collected by experienced interviewers who were masked to the group status. We acknowledge that there may be recall bias inherent in self-reported data among both groups, which were not corroborated by physician or hospital charts. Furthermore, although this is the largest study to date on health outcomes at young adult-hood, the number of subjects in epidemiologic terms is relatively small. It is possible that we may have been underpowered to detect differences in some outcomes. Nevertheless, the findings for ELBW YAs are optimistic in terms of a reasonably good current health status and a significant decline in use of health care resources. However, as anticipated, ELBW YAs continue to suffer from chronic health conditions, and a significantly higher proportion have functional limitations. For vari-ous reasons, ELBW YAs seem to lead a more sedentary lifestyle than their peers. Additional follow-up to late adulthood is essential to determine whether the chronic health conditions and functional limitations among ELBW YAs will get progressively worse with age and whether they will have a higher prevalence of cardio-vascular disease and metabolic problems in the
fu-ture.40–45Finally, although these data may not be entirely
generalizable to the current, even smaller survivors of neonatal intensive care, they provide some guidelines to health care providers and funding agencies for projec-tion, planning, and allocation of the necessary resources for future at-risk infants.
ACKNOWLEDGMENTS
This study was supported by grants MOP42536 from the Canadian Institutes of Health Research and 1 RO1 HD40219 from the National Institute of Child Health and Human Development.
We thank the ELBW and NBW YAs and their parents for cooperation with our many studies. We also thank our research staff Liz Merz (for tracing the participants), Lorraine Hoult and Mary Lou Schmuck (for statistical analysis), and Diane Turcotte (for typing the manu-script). We appreciate the support of the department of Pediatrics and the Children’s Hospital, McMaster Uni-versity (Hamilton, ON, Canada).
REFERENCES
2. Botting N, Powls A, Cooke RW, Marlow N. Cognitive and educational outcome of very-low-birthweight children in early adolescence.Dev Med Child Neurol.1998;40:652– 660
3. Saigal S, Hoult LA, Streiner DL, Stoskopf BL, Rosenbaum PL. School difficulties at adolescence in a regional cohort of chil-dren who were extremely low birth weight. Pediatrics.2000; 105:325–331
4. Saigal S, Pinelli J, Hoult L, Kim MM, Boyle M. Psychopathol-ogy and social competencies of adolescents who were ex-tremely low birth weight.Pediatrics.2003;111:969 –975 5. Hack M, Weissman B, Borawski-Clark E. Catch-up growth
during childhood among very low birthweight children.Arch Pediatr Adolesc Med.1996;150:1122–1129
6. Saigal S, Stoskopf BL, Streiner DL, Burrows E. Physical growth and current health status of infants who were of extremely low birth weight and controls at adolescence.Pediatrics.2001;108: 407– 415
7. Peralta-Carcelen M, Jackson DS, Goran M, Royal ST, May MS, Nelson KG. Growth of adolescents who were born at extremely low birth weight without major disability.J Pediatr.2000;136: 633– 640
8. Hack M, Taylor HG, Klein N, Mercuri-Minich N. Functional limitations and special health care needs of 10- to 14-year-old children weighing less than 750 grams at birth.Pediatrics.2000; 106:554 –560
9. Johnson A, Bowler U, Yudkin P, et al. Health and school performance of teenagers born before 29 weeks gestation.Arch Dis Child Fetal Neonatal Ed.2003;88:F190 –F198
10. Ericson A, Ka¨lle´n B. Very low birthweight boys at the age of 19.
Arch Dis Child Fetal Neonatal Ed.1998;78:F171–F174
11. Hack M, Flannery DJ, Schluchter M, Cartar L, Borawski E, Klein N. Outcomes in young adulthood for very-low-birth-weight infants.N Engl J Med.2002;346:149 –157
12. Hack M, Schluchter M, Cartar L, Rahman M, Cuttler L, Bo-rawski E. Growth of very low birth weight infants at age 20 years.Pediatrics.2003;112(1). Available at: www.pediatrics. org/cgi/content/full/112/1/e30
13. Cooke RW. Health, lifestyle, and quality of life for young adults born very preterm.Arch Dis Child.2004;89:201–206
14. Doyle LW, Faber B, Callanan C, Ford GW, Davis NM. Ex-tremely low birth weight and body size in early adulthood.
Arch Dis Child.2004;89:347–350
15. Saigal S, Stoskopf B, Streiner D, et al. Transition from adoles-cence to young adulthood of a regional cohort of extremely low birthweight infants in comparison with normal birth-weight controls.JAMA.2006;295:667– 675
16. Saigal S, Stoskopf B, Streiner D, Paneth N, Pinelli J, Boyle M. Growth trajectories of extremely low birth weight infants from birth to young adulthood. A longitudinal, population-based study.Pediatr Res.2006;60:751–758
17. Saigal S, Rosenbaum P, Hattersley B, Milner R. Decreased disability rate among 3-year-old survivors weighing 501 to 1000 grams at birth and born to residents of a geographically defined region from 1981 to 1984 compared with 1977 to 1980.J Pediatr.1989;114:839 – 846
18. Saigal S, Szatmari P, Rosenbaum P, Campbell D, King S. Cog-nitive abilities and school performance of extremely low birth weight children and matched term control children at age 8 years: a regional study.J Pediatr.1991;118:751–760
19. Hollingshead AS.Four Factor Index of Social Status. New Haven, CT: Yale University; 1975
20. Ware JE, Kosinski M.SF-36 Physical and Mental Health Summary Scales: A Manual for Users of Version 1. 2nd ed. Lincoln, RI: QualityMetric Inc; 2001
21. Boyle MH, Offord DR, Hoffmann HG, et al. Ontario Child Health Study 1: methodology. Arch Gen Psychiatry.1987;44: 826 – 831
22. Statistics Canada.Canadian Community Health Survey (CCHS 3.1), 2005: Community Belonging and Self-Perceived Health— Early CCHS Findings. Catalogue No. 82-621. Vol 2006. No. 1. Ottawa, On-tario, Canada: Statistics Canada; 2006
23. Statistics Canada.Canadian Community Health Survey (CCHS 3.1), 2005: Health Indices. Catalogue No. 82-221. Vol 2006. No. 1. Ottawa, Ontario, Canada: Statistics Canada; 2006
24. Carriere G. Use of hospital emergency rooms.Health Rep.2004; 16:35–39
25. Ryckman RM, Robbins MA, Thornton B, Cantrell P. Develop-ment and validation of a physical self-efficacy scale.J Pers Soc Psychol.1982;42:891–900
26. Browne G, Gafni A, Roberts J, Goldsmith A, Jamieson E.
Approach to the Measurement of Costs (Expenditures) When Evalu-ating Health and Social Programmes. Health and Social Service Utilization. System-Linked Research Unit[Working Paper 95-11]. Hamilton, Ontario, Canada: McMaster University; 1995 27. Cohen SB.Sample Design of the 1997 Medical Expenditure Panel
Survey, Household Component. Rockville, MD: US Department of Health and Human Services, Public Health Service, Agency for Healthcare Research and Quality; 2000
28. Holm S. A simple sequentially rejective multiple test proce-dure.Scand J Stat.1979;6:65–70
29. Kramer MS, Platt RW, Wen SW, et al. Fetal/Infant Healthy Study Group of the Canadian Perinatal Surveillance System 2001. A new and improved population-based Canadian refer-ence for birth weight for gestational age.Pediatrics2001;108(2). Available at: www.pediatrics.org/cgi/content/full/108/2/e35 30. Halvorsen T, Skadberg BT, Eide GE, Roksund OD, Carlsen KH,
Bakke P. Pulmonary outcome in adolescents of extreme pre-term birth: a regional cohort study. Acta Paediatr. 2004;93: 1294 –1300
31. Doyle LW, Olinsky A, Faber B, Callanan C. Adverse effects of smoking on respiratory function in young adults born weigh-ing less than 1000 grams.Pediatrics.2003;112:565–569 32. Cryotherapy for Retinopathy of Prematurity Cooperative
Group. 15-Year outcomes following threshold retinopathy of prematurity. Final results from the multicenter trial of cryo-therapy for retinopathy of prematurity.Arch Ophthalmol.2005; 123:311–318
33. Brown KJ, Kilbride HW, Turnbull W, Lemanek K. Functional outcome at adolescence for infants less than 801g birth weight: perceptions of children and parents.J Perinatol.2003;23:41– 47 34. Tommiska V, Tuominen R, Fellman V. Economic costs of care in extremely low birthweight infants during the first 2 years of life.Pediatr Crit Care Med.2003;4:157–163
35. Petrou S. The economic consequences of preterm birth during the first 10 years of life.BJOG.2005;112:10 –15
36. Boyle MH, Torrance GW, Sinclair JC, Horwood SP. Economic evaluation of neonatal intensive care of very-low-birth-weight infants.N Engl J Med.1983;308:1330 –1337
37. Rogers M, Fay TB, Whitfield MF, Tomlinson J, Grunau RE. Aerobic capacity, strength, flexibility, and activity level in un-impaired extremely low birth weight (ⱕ800 g) survivors at 17 years of age compared with term-born control subjects. Pedi-atrics. 2005;116(1). Available at: www.pediatrics.org/cgi/ content/full/116/1/e58
38. Miles MS, Holditch-Davis D. Parenting the prematurely born child: pathways of influence.Semin Perinatol.1997;21:254 –266 39. Jongmans M, Mercuri E, de Vries L, Dubowitz L, Henderson SE. Minor neurological signs and perceptual-motor difficulties in prematurely born children.Arch Dis Child Fetal Neonatal Ed.
1997;76:F9 –F14
40. Barker DJ, Bull AR, Osmond C, Simmonds SJ. Fetal and pla-cental size and risk of hypertension in adult life.BMJ.1990; 301:259 –262
cardiovas-cular risk factors in premature babies. Lancet. 2000;355: 2135–2136
42. Finken MJ, Inderson A, Van Montfoort N, et al. Lipid profile and carotid intima-media thickness in a prospective cohort of very preterm subjects at age 19 years: effects of early growth and current body composition. Pediatr Res. 2006;59: 604 – 609
43. Finken MY, Keijzer-Veen MG, Dekker FW, et al, on behalf of the Dutch POPS-19 Collaborative Study Group. Preterm birth and later insulin resistance: effects of birth weight and postna-tal growth in a population based longitudinal study from birth
to adult life Insulin resistance 19 years after preterm birth.
Diabetologia.2006;49:478 – 485
44. Euser AM, Finken MJ, Keijzer-Veen MG, Hille ET, Wit JM, Dekker FW; the Dutch POPS-10 Collaborative Study Group. Associations between prenatal and infancy weight gain and BMI, fat mass, and fat distribution in young adulthood: a prospective cohort study in males and females born very pre-term.Am J Clin Nutr.2005;81:480 – 487
DOI: 10.1542/peds.2006-2328
2007;119;e562
Pediatrics
Streiner and John Goddeeris
Saroj Saigal, Barbara Stoskopf, Michael Boyle, Nigel Paneth, Janet Pinelli, David
Birth Weight
Young Adults Who Were Born With Extremely Low Birth Weight and Normal
Comparison of Current Health, Functional Limitations, and Health Care Use of
Services
Updated Information &
http://pediatrics.aappublications.org/content/119/3/e562 including high resolution figures, can be found at:
References
http://pediatrics.aappublications.org/content/119/3/e562#BIBL This article cites 36 articles, 13 of which you can access for free at:
Subspecialty Collections
sub
http://www.aappublications.org/cgi/collection/fetus:newborn_infant_ Fetus/Newborn Infant
following collection(s):
This article, along with others on similar topics, appears in the
Permissions & Licensing
http://www.aappublications.org/site/misc/Permissions.xhtml in its entirety can be found online at:
Information about reproducing this article in parts (figures, tables) or
Reprints
DOI: 10.1542/peds.2006-2328
2007;119;e562
Pediatrics
Streiner and John Goddeeris
Saroj Saigal, Barbara Stoskopf, Michael Boyle, Nigel Paneth, Janet Pinelli, David
Birth Weight
Young Adults Who Were Born With Extremely Low Birth Weight and Normal
Comparison of Current Health, Functional Limitations, and Health Care Use of
http://pediatrics.aappublications.org/content/119/3/e562
located on the World Wide Web at:
The online version of this article, along with updated information and services, is
by the American Academy of Pediatrics. All rights reserved. Print ISSN: 1073-0397.