DEVELOPMENT AND VALIDATION OF RP-HPLC METHOD FOR ANALYSIS OF RACECADOTRIL IN PURE AND FORMULATIONS
6
0
0
Full text
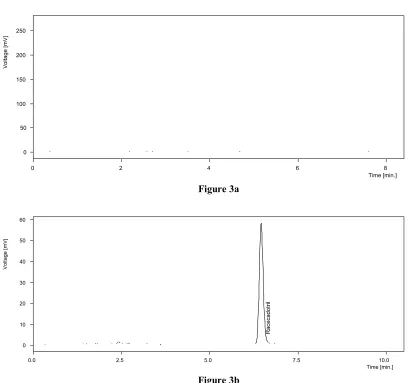
(2) B. Anupama et al. IRJP 2 (1) 2011 163-168 -1. rate was 1.0 mL min and the analyte was monitored at 228 nm. Before analysis the mobile phase was degassed by use of a sonicator and filtered through a 0.45 μm injection filter. The column was equilibrated before each injection. Calibration Calibration plots were constructed by analysis of appropriate working solutions (Concentrations of 10, 20, 30, 40 and 50 μg mL-1) of Racecadotril in the mobile phase and plotting concentration against peak-area response for each injection, Unknown samples were quantified by reference to these calibration plots. Sample Preparation Twenty tablets were accurately weighed. An amount of powder equivalent to 50 mg of Racecadotril was accurately weighed and transferred to a 50 mL volumetric flask. Mobile phase (25 mL) was added and the mixture was sonicated for 10 min for complete extraction of the drug and the solution was diluted to volume with mobile phase. The solution was filtered through a 0.45 μm membrane filter. This solution was suitably diluted and injected for HPLC analysis. RESULTS AND DISCUSSION Method development and optimization Column chemistry, solvent selectivity (solvent type), solvent strength (volume fraction of organic solvent(s) in the mobile phase), additive strength, detection wavelength and flow rate were varied to determine the chromatographic conditions giving the best separation. The mobile phase conditions were optimized, so there was no interference with the Racecadotril peak from solvent or excipients peaks. Other criteria, for example the time required for analysis, assay sensitivity, solvent noise and use of the same solvent system for extraction of the drug from formulation matrices during drug analysis, were also considered. After each change of mobile phase the column was equilibrated by passage of at least twenty column volumes of the new mobile phase. To investigate the appropriate wavelength for determination of Racecadotril, UV–visible spectra in the range 200–400 nm were acquired from a solution of the drug in the mobile phase (Systronics model 2201 spectrophotometer). From the UV spectra obtained the wavelength selected for monitoring the drug was 228 nm. Solutions of the drug in the mobile phase were injected directly for HPLC analysis and the responses (peak area) were recorded at 228 nm. It was observed there was no interference from the mobile phase or baseline disturbance at 228 nm. Therefore, it was, concluded that 228 nm was the most appropriate wavelength for analysis of the substance with suitable sensitivity. Chromatography Symmetrical peaks were obtained for Racecadotril. Typical chromatograms obtained from a blank and from a solution of the drug are illustrated in Figure-3(a & b). The retention time of Milnacipran was 6.48 min and the overall chromatographic run time was 10.0 min. Method Validation Linearity The linearity of the method was tested using the calibration solutions described above. Plot of concentrations against responses were linear in the range of 10-50 μg mL-1 (Figure-2). The mean regression equation was y = 23.84x + 4.85. The correlation coefficient was 0.9998. The system suitability parameters are given in Table-1 Limits of detection and quantification The limit of detection (LOD) is defined as the lowest concentration of an analyte that can be readily detected but not necessarily quantified. It is usually regarded as the amount for which the signal-to-noise ratio (SNR) is 3:1. The limit of quantitation (LOQ) is defined as the lowest concentration of an analyte that can be quantified with acceptable precision and accuracy. It is usually regarded as the amount for which the SNR is 10:1. Two types of solution, blank solution and solutions containing known, progressively decreasing concentrations of the analyte were prepared and analyzed. LOD and LOQ were 0.635 and 1.94 μg mL-1, respectively.. IRJP 2 (1) Jan 2011. Page 163-168.
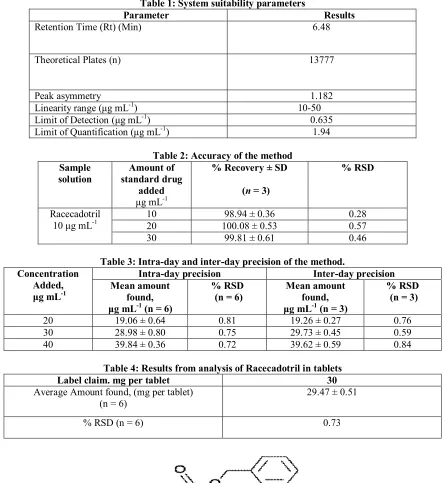
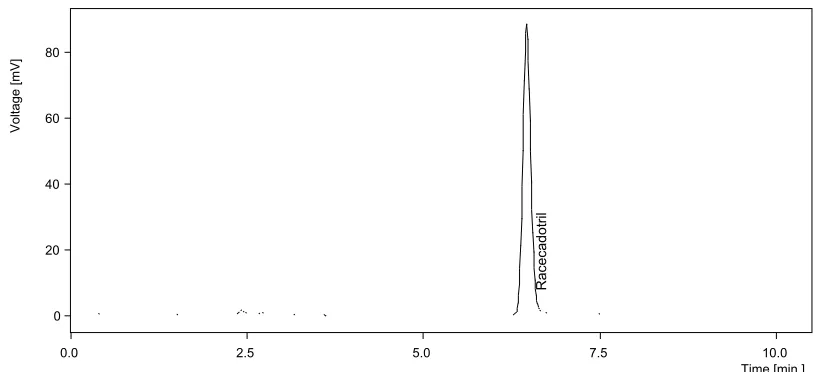
(3) B. Anupama et al. IRJP 2 (1) 2011 163-168 Accuracy Recovery studies were performed in triplicate by adding a known amount of standard solution of pure drug to a preanalyzed sample solution (10 μg mL-1) at three different levels (10, 20 and 30 μg mL-1 of standard solution). The results obtained (Table-2) indicate that recovery were excellent, not less than 98%, not more than 102% and that relative standard deviations also less than 2%. Precision Intra-day precision was calculated from results obtained from six-fold replicate analysis of samples at three different concentrations on the same day. Inter-day precision was calculated from results from the same samples analyzed on three consecutive days. The results obtained are listed in Table-3. Specificity The specificity of the method was tested by chromatographing a mixture of commonly used tablet excipients, for example starch, lactose and magnesium stearate (blank placebo) and comparing the chromatogram with that obtained from a mixture of drug and the same Additives (placebo). The chromatograms obtained showed separation of the analyte from the excipients was complete, i.e. there was no interference from the excipients under the chromatographic conditions used for the analysis. Application of the Method to the Formulations The method was used for determination of Racecadotril in a tablet formulation. The results obtained (Table-4) showed the amount found was that expected and RSD (%) values were low, which confirms the method is suitable for routine analysis of the compound in pharmaceutical preparations. A typical chromatogram obtained from analysis of a tablet formulation is shown in Figure-4. CONCLUSION This RP-HPLC method for analysis of Racecadotril in formulations is very simple, sensitive, and accurate. The run time is 10.0 min only; so many samples can also be processed and analyzed in a short period of time. The procedure described is suitable for the routine estimation of Racecadotril in pharmaceutical formulations.. REFERENCES. 1. Goodman LS and Gilman AG. The Pharmacological Basis of Therapeutics, 9th Edn. By Hardman, J.G., Limbard, L.E., Editors in chief, McGraw – Hill, 1996. 2. Matheoson AJ, Noble S. Drugs 2000; 59(4): 829-835 3. Scand PD. J Gastroenterol 2002; 37(6):656-661. 4. Vetal JM, Barard H, Fretault N, Lecomte JN. Aliment pharmacol ther 1999; 13(6):21-26. 5. Lecomte JM. Int J Antimicrob Agents 2000;14(1):81-87. 6. Alam NH, Ashraf H, Khan WA, Karim MN, Fuchs GJ. Gut 2003; 52(10):1419-1423. 7. CH Narasimha Raju BH, G Devala Rao and Ramanjaneyulu Sikharam. Biosciences, Biotechnology Research Asia 2008; 5(2):747-752. 8. JVN Seshagiri Rao, P Bhanu Prakash, M Murali Krishna and P Ravi Kumar. Asion J chemistry 2007; 19(4): 2623-2626. 9. P Srinivasa Rao and M Nappinnai. Asian J of Chemistry 2007; 19(5):3697-3702. 10. T Srinivasa Rao and M Nappinnai. Asian J of Chemistry 2007; 19(5): 3697-3702. 11. Reddy K, Babu J, Sudhakar P, Sharma M, Reddy G, Vyas K. Structural studies of racecadotril and its process impurities by NMR and mass spectroscopy pharmazie 2006;61(12):994-8. 12. Xu Y, Huang J, Liu F, Gao S, Guo Q. J Chromatogr B Analyt Technol Biomed Life Sci. 2007;852(12):101-7. 13. USP United States pharmacopoeia, 31st edition NF 26. United States Pharmacopeia Convention, Asian edition, Rockville 2008; pp. 683‐687. 14. ICH, Q2R1 Validation of Analytical Procedures: Text and Methodology; International Conference on Harmonization, Geneva; 1996.. IRJP 2 (1) Jan 2011. Page 163-168.
(4) B. Anupama et al. IRJP 2 (1) 2011 163-168 Table 1: System suitability parameters Parameter Results 6.48 Retention Time (Rt) (Min) Theoretical Plates (n). 13777. Peak asymmetry Linearity range (μg mL-1) Limit of Detection (μg mL-1) Limit of Quantification (μg mL-1) Sample solution Racecadotril 10 μg mL-1. Concentration Added, μg mL-1 20 30 40. 1.182 10-50 0.635 1.94. Table 2: Accuracy of the method Amount of % Recovery ± SD standard drug added (n = 3) μg mL-1 98.94 ± 0.36 10 20 100.08 ± 0.53 30 99.81 ± 0.61. % RSD. 0.28 0.57 0.46. Table 3: Intra-day and inter-day precision of the method. Intra-day precision Inter-day precision % RSD % RSD Mean amount Mean amount found, (n = 6) found, (n = 3) μg mL-1 (n = 6) μg mL-1 (n = 3) 19.06 ± 0.64 0.81 19.26 ± 0.27 0.76 28.98 ± 0.80 0.75 29.73 ± 0.45 0.59 39.84 ± 0.36 0.72 39.62 ± 0.59 0.84. Table 4: Results from analysis of Racecadotril in tablets Label claim. mg per tablet 30 Average Amount found, (mg per tablet) 29.47 ± 0.51 (n = 6) % RSD (n = 6). 0.73. Figure 1: Structure of Racecadotril. IRJP 2 (1) Jan 2011. Page 163-168.
(5) =. B. Anupama et al. IRJP 2 (1) 2011 163-168 1400 1200. Absorbance. 1000 800 600 400 200 0 0. 10. 20. 30. 40. 50. 60. Concentration (µg/ml). Figure 2: Calibration plot for Racecadotril. Voltage [mV]. 250. 200. 150. 100. 50. 0 0. 2. 4. 6. 8 Time [min.]. Figure 3a. Voltage [mV]. 60. 50. 40. 30. Racecadotril. 20. 10. 0 0.0. 2.5. 5.0. 7.5. 10.0 Time [min.]. Figure 3b Figure 3(a): Typical chromatograms obtained from blank and (b): Racecadotril solution. IRJP 2 (1) Jan 2011. Page 163-168.
(6) Voltage [mV]. B. Anupama et al. IRJP 2 (1) 2011 163-168. 80. 60. Racecadotril. 40. 20. 0 0.0. 2.5. 5.0. 7.5. 10.0 Time [min.]. Figure 4: Typical chromatogram obtained from Racecadotril sample solution (tablets). Source of support: Nil, Conflict of interest: None Declared. IRJP 2 (1) Jan 2011. Page 163-168.
(7)
Figure
Related documents
The purpose of this study is to characterize the very eld- erly population, who received emergency general surgery, and examine their surgical outcomes including identifica- tion
BN: Boolean Network; CTSG: Controlled State Transition Graph; EV: Electric Vehicle; FVS: Feedback Vertex Set; GA: Genetic Algorithm; GB: Gigabytes; GBML: Genetics-Based
suis cells were detected on PAECs incubated with the negative control preparation (Figure 5d).. To assess whether the presence
AGDL: Agglomerative clustering on a directed graph; AGMFit: Affiliation graph model fitting; CD: Community discovery; CDlib: Community discovery library; CDTB: Community
attenuated virus, as it is clear from the tissue culture studies that this virus replicates well; direct comparisons in which the two isolates are used to infect a compatible cell
Background: A systematic review assessing autologous versus alloplastic bone for secondary alveolar bone grafting in patients with cleft lip and palate was published in 2011
This study was conducted to examine the difference in shape of male and female upper and lower dental arches, as well as the difference in their transversal and longitu- dinal
In this paper we describe how a participatory, multi- method, continuous informed consent process developed by researchers, study participants and community stake- holders during
