HPLC Method Development for Simultaneous Estimation of Sodium Benzoate and
Potassium Sorbate in Food Products
Sadaf K. Shaikh1, Dr. Mallinath S. Kalshetti2 and Ravikant Y. Patil3
1,2,3Department of Quality Assurance, D. S. T. S Mandal’s College of Pharmacy, Solapur, Maharashtra, India. Email: [email protected]
Article Received: 27 January 2018 Article Accepted: 23 February 2018 Article Published: 25 May 2018
1.INTRODUCTION
In recent years, concern about the importance of food and diet quality has been growing, especially due to increase
in the incidences of diseases that are directly or indirectly related to nutrition habits. As a natural outcome, analysis
of food additives came into focus for the assessment of their harmful potentials and quantitative and qualitative
value of risks related to their use.
A food additive is defined as a substance or a mixture of substances, which are generally added to processed foods
for a specific purpose such as prevention of spoilage, conservation or fortification of color, flavor, texture or control
of pH, moisture, crispness etc. Food additives may be divided into preservatives, artificial sweeteners, colorants,
stabilizers etc.1 Food and Agricultural Organization (FAO) and World Health Organization (WHO) have
combined to form a Joint FAO-WHO expert Committee on Food Additives (JECFA) to evaluate and establish the
acceptable daily intake (ADI) which is expressed in milligrams per kilograms of body weight per day. The most
commonly used preservatives in foods are sodium benzoate and potassium sorbate, the use of which is limited by
the regulating bodies. Sodium benzoate is a widely used food preservative, with an E number of E211. It is the
sodium salt of benzoic acid. It is bacteriostatic and fungi static under acidic conditions. Commonly reported side
effects of sodium benzoate include: eye irritations, urticaria, abdominal pain, asthma, hypertension,
attention-deficit/hyperactivity disorder and vomiting. The ADI set by JECFA is 5 mg/kg bw.2
Potassium sorbate [potassium;(2E,4E)-hexa-2,4-dienoate] is the potassium salt of sorbic acid. It is primarily used
as a food preservative and it is codified as E202. Potassium sorbate is used to inhibit growth of molds and yeasts in
many foods, such as cheese, yogurt, soft drinks and fruit drinks, and baked goods. Allergic symptoms such as
itching of the mouth, throat, eyes, skin as well as nasal congestion, runny nose and abdominal pain usually begin
within 2 hours after coming in contact with the allergen. The ADI set by JECFA is 25 mg/kg bw.3
A B S T R A C T
A Reverse Phase-High Performance Liquid Chromatography method has been developed and validated for estimation of Sodium benzoate and Potassium sorbate in food products. The RP-HPLC method for Sodium benzoate and Potassium sorbate was developed using Luna C18 column (150 mm × 4.6 mm, 5 m) as stationary phase and Acetonitrile: Sodium acetate buffer pH 4.3 (20:80) as mobile phase at 1.0ml/min flow rate and detection was carried out at 235nm and the methods were validated in accordance with ICH guidelines. Sodium benzoate and Potassium sorbate have linearity in the concentration range of 1-30µg/ml in with correlation coefficient (r2= 0.999 & r2=0.999) respectively. Sodium benzoate and Potassium sorbate eluted at 4.9 and 6.9 min respectively. The values of LOD were 0.59 and 0.39 and LOQ were 1.8 and 1.1 for sodium nezoate and potassium sorbate respectively. Results of assay and validation study are satisfactory. So, the methods can be successfully applied for the routine analysis of Sodium benzoate and Potassium sorbate.
Thus, the analytical determination of these preservatives is not only important for quality assurance purposes but
also for consumer interest and protection.
The present work deals with the development and characterization of a rapid and simple HPLC method for the
simultaneous estimation of sodium benzoate and potassium sorbate in food products without an extensive sample
pre-treatment. The proposed method has excellent performance characteristics, with a real potential to become a
powerful tool for food safety.
2. EXPERIMENTAL
2.1. MATERIALS AND METHODS
Materials: Sodium Benzoate and Potassium Sorbate were obtained as a gift sample from Bimal Pharma Pvt. Ltd.,
Mumbai and GlaxoSmithKline Plc, Hyderabad respectively. Various food products were obtained from local
market. HPLC grade Acetonitrile LiChrosolv®, Methanol LiChrosolv®, Water LiChrosolv®, Sodium acetate
LiChrosolv® and Glacial acetic acid LiChrosolv® were purchased from Merk Specialities Pvt. Ltd. Mumbai.
2.1.1. Instrumentation
The analysis was performed using Younglin Acme 9000 series quaternary gradient pump SP930D. HPLC system
with UV 730D UV-Visible detector and 20µl Rheodyne injector. The data was processed on Autochrom-3000
software. Column C18 (150mm×4.5mm,5µ) Phenomenex with UV method analysis was performed on UV-Visible
Double Beam Spectrophotometer Shimadzu 1800.
All chemicals were weighed using Electronic Balance AY220 (Shimadzu, Japan). Mobile phase filtered through a
Nylon 6,6 membrane 0.45 µm 47 mm filters (Pall India Pvt. Ltd., Mumbai) using vacuum pump. Ultra Sonicator
(Microlean-103) was used for degassing the mobile phase. The solutions were filtered through 0.45µ syringe filter
(Phenomenex).
2.1.2. Chromatographic Conditions
The chromatographic separation was performed using Analytical Column: Phenomenex C18 column (150 × 4.6
mm, 5 µm) using mobile phase Acetonitrile: Sodium acetate buffer Ph 4.3(20:80) at a flow rate of 1.0 ml/min with
iscocratic elution. The injection volume was 20 μl and the run time was 10 min. Detection was carried out at 235
nm.
2.1.3. Preparation of Standard Stock Solution
1. Standard Stock Solution of SB: 10mg of standard SB was weighed and transfered to a 10ml volumetric
flask then dissolved in HPLC Water LiChrosolv® and the volume was made up to the mark with water to
2. Standard Stock Solution of PS: 10mg of standard PS was weighed and transferred to a 10ml volumetric
flask then dissolved in HPLC Water LiChrosolv® and the volume was made up to the mark with water to
obtain conc. of 1000µg/ml of PS and labeled as ‘Std Stock PS’.
3. Combined Standard Stock Solution of SB and PS: 1ml of ‘Std Stock SB’ and 1ml of ‘Std Stock PS’ was
transferred to 10 ml volumetric flask and diluted to 10 ml with HPLC Water to get ‘Std Stock MIX SB PS’
(100µg/ml SB and 100µg/ml PS).
Fig. 1 Calibration curve of SB of RP-HPLC method
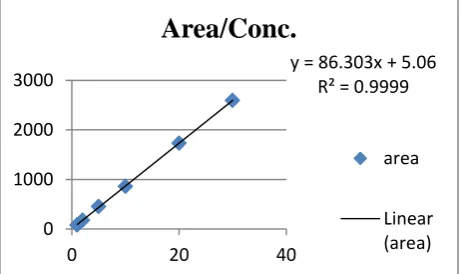
Fig.2 Calibration curve of PS of RP-HPLC method
2.2. Preparation of Samples
2.2.1. Sample A (Lauki-Amla Juice)
1ml of sample A was pipetted out and transferred to a 10ml volumetric flask. The volume was made up to the mark
by HPLC water. Further dilution was done by pipetting out 1ml from the same volumetric flask and transfer to
another 10ml volumetric flask. The volume was made upto the mark by HPLC water.
2.2.2. Sample B (Jam)
10gm of sample B was transferred to a 20ml beaker. The volume was made upto the mark by HPLC water. Further
dilution was done by pipetting out 2ml from the same beaker and was transferred to a 10ml volumetric flask. The
volume was made up to the mark by HPLC water.
y = 52.72x - 0.16 R² = 0.9997
0 500 1000 1500 2000
0 20 40
Area/Conc.
abs
Linear (abs)
y = 86.303x + 5.06 R² = 0.9999
0 1000 2000 3000
0 20 40
Area/Conc.
area
2.2.3. Sample C (Cake)
10gm of sample C was transferred to a 50ml beaker. The volume was made up to the mark by HPLC water. Further
dilution was done by pipetting out 1ml from the same beaker and was transferred to a 10ml volumetric flask. The
volume was made up to the mark by HPLC water.
2.2.4. Sample D (Fizz Juice)
2ml of sample D was transferred to a 10ml volumetric flask. The volume was made up to the mark by HPLC water.
All the samples were degassed in an ultrasonicator for 30 minutes and filtered through a nylon filter membrane
(0.45µm) prior to use.
2.3. Preparation of Mobile Phase
Mobile phase was prepared by mixing 20ml of Acetonitrile and 80ml of sodium acetate buffer (pH 4.3) and filtered
through 0.45µm nylon filter using vacuum pump and ultrasonicated for 30 min for degassing.
2.4. Method Validation
The developed analytical method as per the ICH Q2 (R1) guideline it is suitable for the intended purpose with
respect to various parameters such as specificity, linearity, range, accuracy, precision, limit of detection, limit of
quantification, robustness, system suitability.
2.4.1. Specificity
The chromatogram of standard solution of mixture of SB and PS was compared with food products.
2.4.2. Linearity
0.1, 0.2, 0.5, 1, 2 and 3ml of ‘Std Stock MIX SBPS’ were transferred in a series of 10ml volumetric flasks. The
volume was made up to the mark with HPLC water to obtain the conc. of 1, 2, 5, 10, 20 and 30µg/ml of SB and 1,
2, 5, 10, 20 and 30µg/ml of PS. The solutions were filtered through 0.45µ syringe filter and 20µl injected into the
HPLC system and their chromatogram were recorded for 10mins under the chromatographic conditions as
described above after getting a stable baseline.
Peak areas were recorded for all the peaks. Calibration curves of SB and PS were constructed by plotting the peak
area of SB v/s conc. of SB and peak area of PS v/s conc. of PS, respectively. The correlation coefficient (r2) of least
square linear regression for SB and PS was calculated.
2.4.3. Range
2.4.4. Precision
10µg/ml of SB and 10µg/ml of PS solution was filtered through 0.45µ syringe filter and 20µl injected into the
HPLC system and its chromatogram was recorded under the same chromatographic conditions after getting a stable
baseline. Peak area was recorded. The procedure was repeated for six times.
2.4.5. Accuracy
1, 0.5, 0.5, and 2ml from sample A, B, C, and D respectively was taken and transferred to 10ml volumetric flasks
each. The volume was made up to the mark with mobile phase. Similarly, another 4 sets were prepared with the
addition of 1ml of ‘Std Stock MIX SBPS’ in each. All the solutions were filtered through syringe filter and injected
into the HPLC system and their chromatograms were recorded under the same chromatographic conditions after
getting a stable baseline. Peak areas were recorded and percent recoveries were calculated.
2.4.6. Limit of Detection
LOD calculated by the following formulae.
LOD = 3.3(SD/S) Where, SD- Standard deviation; S- Slope of Curve
2.4.7. Limit of Quantification
LOQ calculated by the following formulae.
LOQ = 10(SD/S) Where, SD- Standard deviation; S- Slope of Curve.
2.4.8. Robustness
Combined standard solution of SB (10µg/ml) and PS (10µg/ml) was prepared and analyzed at different flow rates
(0.9, 1.0, 1.1 ml/min) and different wavelengths (234, 235, 236nm) separately.
2.4.9. System Suitability
Chromatograms were studied for different parameters such as tailing factor, resolution and theoretical plates to see
that whether they comply with the recommended limit or not.
3. RESULTS AND DISCUSSIONS
In order to develop RP-HPLC method for combination of Sodium Benzoate and Potassium sorbate, the
chromatographic conditions were optimized in order to find the best conditions. Different mobile phase like
acetonitrile, methanol, water and buffer in varying proportions of mobile phases were tried for better resolution.
After several combinations of mobile solvents with stationary phase C18, the above method has been optimized i.e.
acetonitrile: sodium acetate buffer (Ph 4.3) in the ratio of 20:80 respectively using C18 column which has given
good resolution, capacity factor, and acceptable system suitability. Chromatographic peak of both drugs are
identified by overlaying individual drug with chromatograph of mixture. Both drugs eluted within 10mins which
Fig.3 Chromatogram of combination of SB (10µg/ml) & PS (10µg/ml) in optimized chromatographic conditions
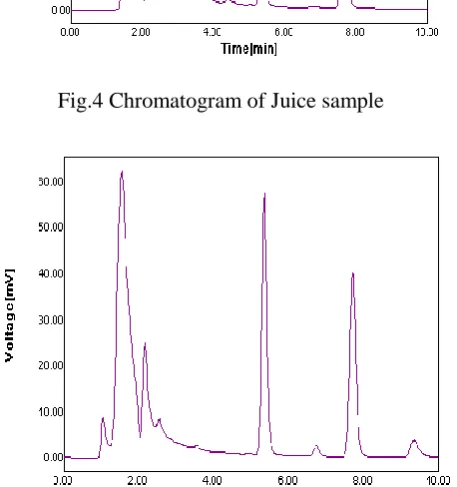
Fig.4 Chromatogram of Juice sample
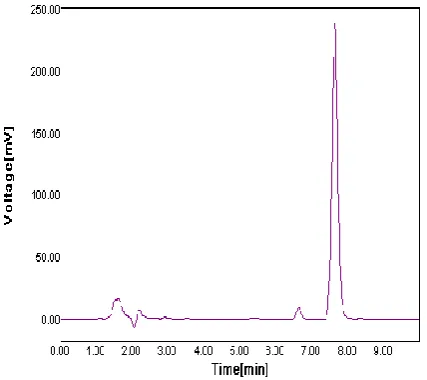
Fig. 6 Chromatogram of Cake sample
Fig. 7 Chromatogram of Fizz juice sample
3.1. ACCURACY
Table 1- Accuracy for RP-HPLC Method
Sr.
No.
Sample
No. Level of
Recovery
Amount
of
Sample
(ml)
Amount of
Standard
Drug Added
(µg/ml)
Total Amount
Found (µg/ml)
Amount
Recovered
(µg/ml)
% Recovery
SB PS SB PS SB PS SB PS
1 A 0% 1 10 10 11.38 8.38 0 0 0 0
100% 11.38 8.38 19.86 17.35 97.7 98.8
2 B 0% 0.5 10 10 2.31 1.15 0 0 0 0
3 C 0% 0.5 10 10 - 14.21 0 0 0 0
100% - 14.21 8.61 24.39 98.6
4 D 0% 2 10 10 23.86 2.68 0 0 0 0
100% 23.86 2.68 32.2 11.91 98 102.2
3.2. PRECISION
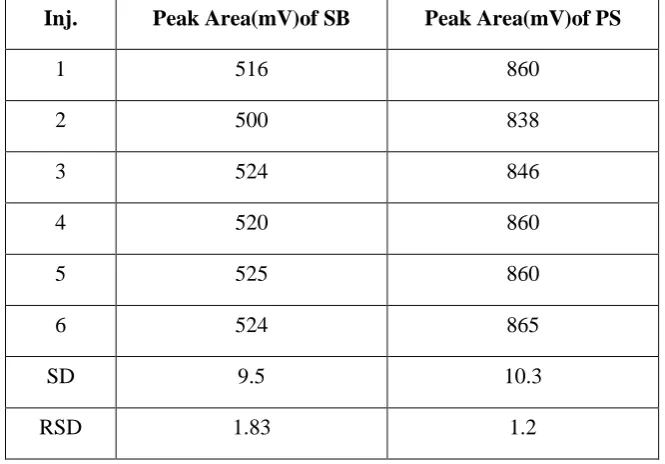
Table 2- Results of Repeatability Study for SB and PS
Inj. Peak Area(mV)of SB Peak Area(mV)of PS
1 516 860
2 500 838
3 524 846
4 520 860
5 525 860
6 524 865
SD 9.5 10.3
RSD 1.83 1.2
3.3. LIMIT OF DETECTION
Table 3 - Limit of Detection data of SB and PS
SB PS
LOD (μg/ml) 0.59 0.39
3.4. LIMIT OF QUANTITATION
Table 4 - Limit of Detection data of SB and PS
SB PS
LOQ (μg/ml) 1.80 1.19
3.5. ROBUSTNESS
Table 5- Result of Robustness Study: Variation in Flow Rate (ml/min)
Flow Rate
(ml/min) Analyte
Retention Time (min) Tailing Factor (T) Theoretical Plates (N) Resolution (R)
0.9 SB 5.2 1.2 8457
2.9
PS 7.5 1.1 10987 8.7
1.0 SB 4.8 0.8 8823 2.6
PS 6.8 1.1 10713 8.6
1.1 SB 4.4 1.2 8400 1.3
PS 6.3 1.1 10912 8.9
Table 6 - Result of Robustness Study: Variation in Wavelength (nm)
Wavelength
(nm) Analyte
Retention Time (min) Tailing Factor (T) Theoretical Plates (N) Resolution (R)
234 SB 4.8 1.3 7428 065
PS 6.9 1.1 10624 8.59
235 SB 4.8 0.8 8823 2.69
PS 6.9 1.1 10713 8.6
236 SB 4.8 1.1 9162 1.3
PS 6.9 1.1 11197 9
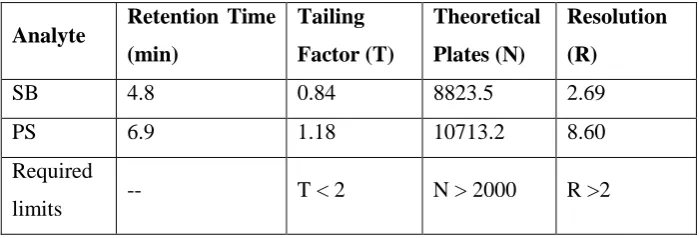
3.6. SYSTEM SUITABILITY TESTING
Table.7 Results of System Suitability Parameters
Analyte Retention Time
(min) Tailing Factor (T) Theoretical Plates (N) Resolution (R)
SB 4.8 0.84 8823.5 2.69
PS 6.9 1.18 10713.2 8.60
Required
4. CONCLUSION
This research was aimed to extract and evaluate the amount of preservatives in various food products. The proposed
method was RP-HPLC which was found to be appropriate due to its simplicity, reliability, sensitivity, rapidness,
and selectivity for detection at very low concentrations. It could recognize the preservatives at one wavelength in
less than 10 mins and involves minimal sample preparation. The recoveries were within 97-102 % which implies
that the method is accurate. It was found that Sample C (cake) exceeded the permissible limit of preservative and
was not in accordance with the limits set by Food Safety and Standards Authority of India and CODEX STAN
192-1995. However the other 3 samples complied with the limits satisfactorily.
In conclusion, the HPLC method is simple, accurate, reliable and reproducible method for simultaneous estimation
of SB and PS in food products. Optimum values of the retention time, pH, flow rate and mobile phase ratio for good
separation of the analytes were determined. The optimized HPLC methods were validated and based on the results
obtained the proposed method is found to be linear, precise and accurate. Validation data demonstrates that this
method can be used in routine analysis of sodium benzoate and potassium sorbate in various food products.
5. ACKNOWLEDGEMENTS
The authors thank to the management D.S.T.S Mandal’s College of Pharmacy, Solapur for providing the necessary
facilities to carry out the research work. The authors also thank Bimal Pharma Pvt Ltd. Mumbai and
GlaxoSmithKline Hyderabad for providing the gift sample of Sodium benzoate and Potassium sorbate.
REFERENCES
[1] Qinghua Y., Li Y., Xiaoqin M. and Huigen F. Simultaneous Determination of Six Food Additives in
Drinks by High Performance Liquid Chromatography Coupled To Diode Array Detector Detection. J.
Chem. Soc. Pak. 2013; 35(4).
[2] Available from: https://pubchem.ncbi.nlm.nih.gov/compound/sodium_benzoate
[3] Available from: https://pubchem.ncbi.nlm.nih.gov/compound/potassium¬_sorbate
[4] Available from: http://old.fssai.gov.in/Portals/0/Pdf/appendix_a_and_b_revised%2830-12-2011%29.pdf
[5] Available from: http://www.who.int/foodsafety/areas_work/chemical-risks/jecfa/en/
[6] Altiokka G, Ergun B, Can N, Aboul‐ Enein H. Validated Reversed Phase HPLC Method for the Analysis
of the Food Additive, Sodium Benzoate, in Soft Drinks and Jams. J Liq Chromatogr Relat Technol.
2007;30(8):1125-1136.
[7] Sohrabvandi S, Vesal H, Mortazavian A, Mohammadi A. Simultaneous Determination of Potassium
Sorbate and Sodium Benzoate in Doogh Using High Performance Liquid Chromatography. Orient J Chem.
[8] Khosrokhavar R, Sadeghzadeh N, Hajiaghaee R, Amini M, Ghazi-Khansari M. Simultaneous
Determination of Preservatives (Sodium Benzoate and Potassium Sorbate) in Soft Drinks and Herbal
Extracts Using HighPerformance Liquid Chromatography (HPLC). J Med Plants. 2010;9(35):80-87.
[9] Bahremand N, Eskandari S. Determination of Potassium Sorbate and Sodium Benzoate in "Doogh" by
HPLC and Comparison with Spectrophotometry. Intl J Bio-Inorg Hybrid Nanomater. 2013;2(3):429-435.
[10] Ahmed M, Waseem R, Kiran S, Ahmad W, Shahzad S. Sodium Benzoate And Potassium Sorbate In
Pakistani Retail Foodstuffs. Intl J Chem Res. 2013;3(6):1-6.
[11] Zamani Mazdeh F, Esmaeili Aftabdari F, Moradi-Khatoonabadi Z, Shaneshin M, Torabi P, Shams
Ardekani M et al. Sodium benzoate and potassium sorbate preservatives in Iranian doogh. Food Addit
Contam: Part B. 2014;7(2):115-119.
[12] Sneha S, R Preetha. Determination of sodium benzoate & potassium sorbate contamination in ready to
serve products in post market surveillance in Chennai 2015. Discovery. 2015;51(240):176-183.
[13] http://old.fssai.gov.in/Portals/0/Pdf/appendix_a_and_b_revised%2830-12-2011%29.pdf
[14] http://www.who.int/foodsafety/areas_work/chemical-risks/jecfa/en/
[15] Faraji M, Rahbarzare F. Simultaneous Determination of Four Preservatives in Foodstuffs by High
Performance Liquid Chromatography. Nutrit Food Sci Res. 2016;3(2):43-50.
[16] Jankulovska M, Markovska L, Ilievska B, Trpkovska S. High-Performance Liquid Chromatography
Method For Determination Of Preservatives In Beverages. J Agric Food Environ Sci. 2016;67.
[17] Pylypiw H, Grether M. Rapid high-performance liquid chromatography method for the analysis of sodium
benzoate and potassium sorbate in foods. J Chromatogr A. 2000;883(1-2):299-304.
[18] Dinç Zor Ş, Aşçı B, Aksu Dönmez Ö, Yıldırım Küçükkaraca D. Simultaneous Determination of
Potassium Sorbate, Sodium Benzoate, Quinoline Yellow and Sunset Yellow in Lemonades and Lemon
Sauces by HPLC Using Experimental Design. J Chromatogr Sci. 2016;54(6):952-957.
[19] Salehi S, Khodadadi I, Akbari-adergani B, Shekarchi M, Karami Z. Surveillance of sodium benzoate and
potassium sorbate preservatives in dairy products produced in Hamedan province, north west of Iran. Intl
Food Res J. 2017;24(3):1056-1060.