O R I G I N A L R E S E A R C H A R T I C L E
Open Access
Methods considerations for nystagmography
Brian W. Blakley and Laura Chan
*Abstract
Objectives:1. To assess the reproducibility of eye movement velocity measurement using two methods: traditional electro-oculography (EOG) and infrared video-oculography (VOG) and,
2. Determine whether the normal values for unilateral weakness and bilateral reduction of caloric responses vary according to method employed.
Background:Vestibular testing frequently involves measurement of eye movements. EOG has been the standard method for decades, but VOG and other methods have recently become popular. The assumption has been that all methods measure eye movements equally and accurately but this assumption has not been validated. In this paper we examine this assumption.
Methods:Eye movements were recorded simultaneously with commercially available EOG and VOG methods to evaluate differences in results for nineteen normal subjects undergoing caloric tests with warm and cold water. Examination of the records permitted identification and simultaneous measurement of 840 nystagmus beats.
Results:EOG and VOG measurements were correlated but the correlation was not strong (Spearman rho = 0.529, p < 0.01). Eye velocities recorded by the VOG system were greater than that for the EOG system. The mean VOG/EOG ratio was 1.71. Normal values used at our centre were adjusted to accommodate the use of video technology to account for the differences in sensitivity between EOG and VOG methods.
Conclusion:The traditional EOG-based normal value for bilateral reduction of caloric response, 30 degree per second (d/s) based on traditional EOG measurements should be revised to 50 d/s for modern VOG testing in our lab. Normal values for vestibular testing may need to be re-evaluated when new technology is introduced. Each lab should verify normal values for their own methods and equipment.
Introduction
New clinical testing techniques should be accompanied by re-evaluation of normal values. Recently developed eye movement measurement techniques include infrared, video technology and scleral search coil technology [1–3]. Of these, the scleral search coil technique is generally agreed to be the most accurate, but its use requires the patient to wear a contact lens and the equipment is expensive and prone to problems [2, 4].
The goal of this report is to assess the concurrence be-tween electro-oculography (EOG) and video-oculography (VOG) measurements. For decades, the electrical differ-ence between the cornea and the retina of the eye has been used to record eye movements. This electrical poten-tial difference is small but with amplification and proper filtering it can be detected using surface electrodes. This is
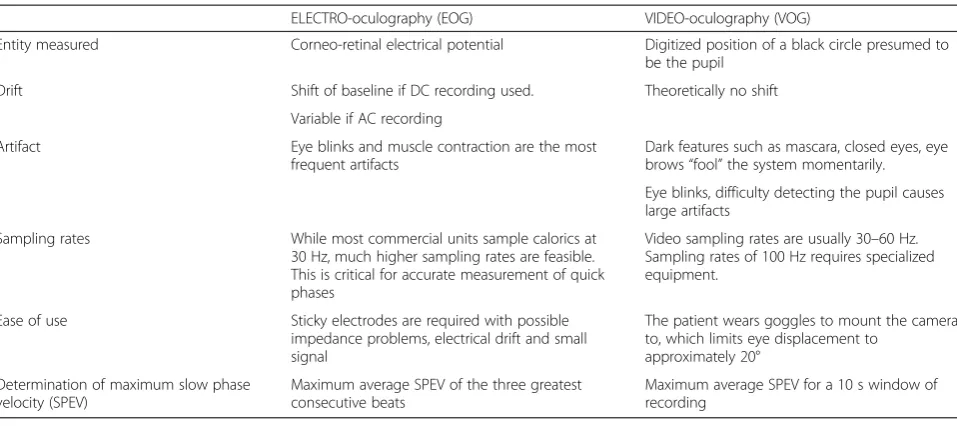
called electro-oculography. When EOG is used to record eye movements for caloric, saccade, pursuit and other tests, it is part of the electronystagmography (ENG) battery of tests. If video techniques are used, the test may be called videonystagmography and the eye movement recordings are video-oculography (VOG). EOG and/or VOG can be used to measure the response to caloric stimulation and is called nystagmography [5]. Some funda-mental differences between EOG and VOG that could be clinically important have become apparent after experi-ence and consideration of the recording technique [5–7]. Some of these are indicated in Table 1.
Normal values for clinical caloric testing have been based on traditional EOG measurements. The most important parameter is the unilateral weakness (UW) [3, 5, 6] which assesses the percent difference of the maximum slow phase velocity (SPEV) for warm and cool water stimuli in each ear. UW may be called reduced vestibular response or caloric weakness but is the same measure. Values are
* Correspondence:[email protected]
Department of Otolaryngology, University of Manitoba, GB420-820 Sherbrook Street, Winnipeg, MB R3A 1RJ, Canada
considered abnormal for clinical purposes if the UW is greater than 25 % or the sum of the four caloric tests (right warm + right cool + left warm + left cool) is less than 30 d/s [5, 6]. We conducted this study to evaluate whether EOG and VOG methods provide equivalent re-sults or whether some change in the values scale is needed according to the technique used.
Several methods of recording eye movements have emerged so it is important to compare established tech-nique with newer ones as they are brought into practice. Fortunately, it is possible to use both the EOG and VOG systems at the same time to study exactly the same eye movements. As far as we are aware, this is the first paper in the literature to directly compare EOG and VOG re-sults simultaneously recorded.
The number of ways that eye movement measurement techniques can be employed is large. Computer algo-rithms and their underlying assumptions, sampling rates, filtering, DC electrical shift, noise, and other factors may produce different results but consideration of the effects of different methods are not prominent in the literature [8, 9]. This project was performed using commercially available equipment that is assumed to represent valid general protocols for electro- and video- techniques. In deference to the possible sensitivity that manufacturers may have, the names of the companies are not included and are not considered important. Differences between the two techniques, EOG and VOG, are the focus of this paper.
Methods
We measured the slow phase velocity for the same nys-tagmus beats using both EOG and VOG techniques sim-ultaneously. Preliminary data suggested that we could
expect to identify at least ten simultaneous slow-phase eye movements in each subject. We wished to have re-sults with statistical power greater than 95 %. Using SYSTAT 3.5’s power calculator and applying the stand-ard deviation of 8 d/s and the mean difference of 3 d/s we calculated that 19 normal subjects would be required to detect a difference of 3 d/s with 95 % power at the
p= 0.05 level. In fact, we were able to determine over 40 simultaneous SPEVs per subject.
The Human Research Ethics Committee of the Univer-sity of Manitoba approved the protocol. Subjects were 19 normal volunteers who had no complaints of dizziness or ear dysfunction and who had normal otoscopic exams. EOG recording was carried out with electrocardiogram-type surface electrodes. These were applied posterior to the lateral canthus bilaterally, above and below the left eye and in the center of the forehead (reference electrode). Caloric irrigations were performed similar to ANSI standards [7] - the sampling rates were 30 Hz for EOG and 60 Hz for VOG caloric tests. Warm and cool water irrigations at 44 °C and 30 °C respectively for 20 s at 200 cm3/min were administered in each ear with eye movement recording for 60 s. VOG recording was carried out with a camera mounted in the right eye of specially designed goggles as part of a commercially available sys-tem. Each eye was recorded with a different technique. Conjugate eye movements were assumed. The EOG elec-trodes were worn under the goggles, which helped stabilize the electrodes. Both systems were calibrated ac-cording to the manufacturer’s directions using arrays of red diode lights. Examining the EOG and VOG records together allowed us to identify the two system’s measure-ment of the same beats of nystagmus. The velocities mea-sured with both methods were entered into a database.
Table 1Some differences between EOG and VOG
ELECTRO-oculography (EOG) VIDEO-oculography (VOG)
Entity measured Corneo-retinal electrical potential Digitized position of a black circle presumed to be the pupil
Drift Shift of baseline if DC recording used. Theoretically no shift
Variable if AC recording
Artifact Eye blinks and muscle contraction are the most frequent artifacts
Dark features such as mascara, closed eyes, eye brows“fool”the system momentarily.
Eye blinks, difficulty detecting the pupil causes large artifacts
Sampling rates While most commercial units sample calorics at 30 Hz, much higher sampling rates are feasible. This is critical for accurate measurement of quick phases
Video sampling rates are usually 30–60 Hz. Sampling rates of 100 Hz requires specialized equipment.
Ease of use Sticky electrodes are required with possible impedance problems, electrical drift and small signal
The patient wears goggles to mount the camera to, which limits eye displacement to
approximately 20°
Determination of maximum slow phase velocity (SPEV)
Maximum average SPEV of the three greatest consecutive beats
Statistical analysis: Eye velocity data departed from a normal distribution so non-parametric tests were applied. The correlation between EOG and VOG recordings was calculated using Spearman’s rho and the significance of differences assessed with the Wilcoxon signed ranks test. For UW scores, the Pearson correlation coefficient and paired t-tests were used because the UW data were nor-mally distributed. Statistical calculations were performed using IBM SPSS v22.0.
The Jongkees formula [6] was used to calculate UW for the electro- and video recording systems for these normal subjects
UW¼ðRWRWþþRCRCÞ−þðLWLWþþLCLCÞ
where RW, RC, LW and LC refer to the responses for right ear warm, right ear cool, left ear warm, and left ear cool, respectively. If abnormal values were obtained for these normal subjects, doubt would be cast on the valid-ity of the technique used.
The two parameters that are most significant clinically are UW and the sum of the four caloric tests. Abnormal UW suggests that responses from the two ears are not symmetric so one ear is hypo-responsive. If the sum of the four caloric tests is less than a normal threshold value, bilateral reduction of caloric response is present which suggests significant dysfunction. Even if the two systems provide different values for eye movements, and the error is linear, the UW should still be meaningful because UW is a ratio or relative measure. This is not true for the sum of the four caloric tests. The sum of the caloric tests is an absolute measure so it will vary according to the magnitude of the measures.
Results
Eight hundred forty slow phases from the resulting nystagmus were identified on both records according to the time that they occurred. Spearman’s rho for the mea-sured velocity for EOG and VOG methods was only 0.529, departing significantly from perfect correlation of 1.0. EOG and VOG velocities were statistically signifi-cantly different (p< 0.001) and the correlation fell far short of our expectations, given that we were objectively measuring exactly the same quantity. Fig. 1 displays the bivariate relationship. Velocities for VOG recording were higher than for the same beats of nystagmus recorded with EOG. Fig. 2 illustrates the differences between EOG and VOG measures with box and whisker plots. The median velocities for VOG and EOG were 16 and 9.6 d/s respectively. The mean VOG/EOG ratio was 1.71.
Although the eye velocities were not normally distrib-uted, the UW data were normally distributed so para-metric tests were applied. The mean (+/−s.d.) unilateral
weakness for EOG and VOG was 0.1 % (+/−22.3) and 9.3 % (+/−12.9) respectively. The Pearson correlation co-efficient between unilateral weakness for EOG and VOG was 0.59, which is minimally better than the correlation for eye movement velocities.
UWs for EOG and VOG (mean +/−s.d.) were
14.69 +/−8.7 and 14.46 +/−8.48. Although these means and standard deviations were close they were statistically significantly different using the paired t-test (p= 0.02). Note that at the accepted threshold for normal UW (<25 %), two normal subjects would have been incorrectly labeled as abnormal whereas none of the VOG measures suggested abnormal results as shown in Fig. 3.
Discussion
For years, EOG measures have been based on the assumption that electrical potential difference between two surface electrodes is linearly dependent on degrees of rotation of the eye. This assumption must be violated because the change of corneoretinal potential occurs over a curved space but is detected between two points. As the eye displacement increases, the error under this assumption also increases. Even if the velocity measure-ments are inaccurate for EOG, they may still be clinically useful as long as the errors are made consistently. For these reasons, in the interest of quality, it seems import-ant that each lab verify their own normal values using their own techniques and equipment.
New techniques of recording eye movements include scleral search coil techniques, infrared and video tech-niques. It is logical that the results from different
Fig. 2Box and whisker plot of SPEV showing the median (horizontal line), interquartile range (limits of the box), outliers (o), and extreme cases (*) of the four types of caloric tests. Over all caloric tests, the median SPEV was 9.6 and 16 for EOG and VOG, respectively. The EOG measure for the same SPEV was greater suggesting greater sensitivity of the EOG technique
techniques will vary to some extent but we were disappointed at how poorly EOG and VOG results correlated. EOG usually yielded lower velocities than VOG for the same slow phase eye movement. Based on these data, it appears that our normal values for the sum of four caloric tests should be reconsidered in our lab. The traditional upper limit of normal for the sum is 30 d/s using EOG methods. If VOG methods are used, this traditional normal limit should be multiplied by the ratio of the median magnitude of the velocities or 30 d/s × (16/9.6) = 50 d/s. For this reason 50 d/s is the normal value for our lab. Again, individual labs should verify these values.
For each technique, there is an infinite number of ways that the tests could be performed. Software devel-opment requires that certain assumptions be made about the data. These assumptions potentially affect results. Some of these include assumptions about opti-mal filtering, optiopti-mal digitization, and definition of slow phase, fast phase and artifact. The EOG system func-tioned properly but is old technology. While these assumptions may have accounted for some variability it seems likely that the nature of the technique (electro or video) was also a major source of error as suggested by the R [2] value of 0.35 in Fig. 3. The UW correlated a little better (R = 0.59) than absolute eye velocity mea-surements for the two methods. UW is a relative meas-ure, so differences in eye velocity should give similar results assuming that measurements are accurate.
The finding that two normal subjects had an abnormal UW on EOG recording but not with VOG suggests that the lower velocities measured by EOG maybe more likely to give false results than VOG. This makes sense because variability in small velocities is more likely to result in apparent abnormal calculations for UW than lar-ger velocities with smaller relative variability. For example, the sensitivity of EOG is approximately 2 d/s [6] or 21 % of the median EOG measure [6]. An error of the same magnitude would be only 12 % for VOG. All subjects in this study were asymptomatic normal subjects so we were reassured that UW measures were normal for VOG tech-niques. Since adopting the 50 d/s criteria for lower limit of normal for the sum of the four caloric tests, we have found that it seems reliable in explaining chronic, idiopathic imbalance in many patients. This will be the subject of another report on rotary chair testing.
This study has limitations. We could not assess all equipment by all manufacturers. It would also be inter-esting to see how the techniques differ across a range of abnormal subjects or those with eye problems.
Conclusion
EOG and VOG techniques do not provide equivalent results. Normal values should be adjusted depending on
technique used. When using video techniques, our upper limit for normal for the sum of the four caloric tests should be 50 d/s. VOG may provide more accurate caloric results but EOG can still be useful if normal values have been verified using consistent methods for the lab.
Competing interests
The authors declare that they have no competing interests.
Authors’contributions
Research performed by LC, research designed and paper written by BB. Both authors approved final manuscript prior to submission.
Received: 21 January 2015 Accepted: 13 June 2015
References
1. Gananca MM, Caovilla HH, Gananca FF. Electronystagmographyversus videonystagmography. Braz J Otorhinolaryngol. 2010;76:399–403. 2. West PD, Sheppard ZA, King EV. Comparison of techniques for identification
of peripheral vestibular nystagmus. J Laryngol Otol. 2012;126:1209–15. 3. Szirmai A, Keller B. Electronystagmographic analysis of caloric test parameters
in vestibular disorders. Eur Arch Otorhinolaryngol. 2013;270:87–91. 4. MacDougall HG, Weber KP, McGarvie LA, Halmagyi GM, Curthoys IS. The
video head impulse test: diagnostic accuracy in peripheral vestibulopathy. Neurology. 2009;73:1134–41.
5. Baloh RW, Honrubia V. Nystgmography Clinical Neurophysiology of the Vestibular System 4th edition. New York: Oxford University
Press; 2011. p. 171–217.
6. Barber H, Stockwell C. Caloric Test. Manual of Electronystagmography. St. Louis: CV Mosby Co; 1980. p. 159–87.
7. ANSI. Procedures for testing basic vestibular function Acoustical Society of America. New York: American National Standard Institute; 1999.
8. Jalocha-Kaczka A, Pietkiewicz P, Zielinska-Blizniewska H, Milonski J, Olszewski J. Sensitivity evaluation in air and water caloric stimulation of the vestibular organs using videonystagmography. Otolaryngol Pol. 2014;68:227–32. 9. Bell SL, Barker F, Heselton H, MacKenzie E, Dewhurst D, Sanderson A.
A study of the relationship between the video head impulse test and air calorics. Eur Arch Otorhinolaryngo. 2014;272(5):1287–94.
Submit your next manuscript to BioMed Central and take full advantage of:
• Convenient online submission
• Thorough peer review
• No space constraints or color figure charges
• Immediate publication on acceptance
• Inclusion in PubMed, CAS, Scopus and Google Scholar
• Research which is freely available for redistribution