Complex Interfaces Under Change: Sea – River – Groundwater – Lake
Proceedings of HP2/HP3, IAHS-IAPSO-IASPEI Assembly, Gothenburg, Sweden, July 2013 (IAHS Publ. 365, 2014).
22
Consequences of sea level variability and sea level rise for
Cuban territory
MARCELINO HERNÁNDEZ
1, CARLOS A. MARTÍNEZ
1& ORLANDO MARZO
21 Institute of Oceanology, 18406 1st Avenue, Flores, Playa, Havana, Cuba
2 National Tide Gauge Network, Geocuba Geodesia, Loma and 39, Plaza, Havana, Cuba
Abstract The objective of the present paper was to determine a first approximation of coastal zone flooding by 2100, taking into account the more persistent processes of sea level variability and non-accelerated linear sea level rise estimation to assess the main impacts. The annual linear rate of mean sea level rise in the Cuban archipelago, obtained from the longest tide gauge records, has fluctuated between 0.005 cm/year at Casilda and 0.214 cm/year at Siboney. The main sea level rise effects for the Cuban coastal zone due to climate change and global warming are shown. Monthly and annual mean sea level anomalies, some of which are similar to or higher than the mean sea level rise estimated for halfway through the present century, reinforce the inland seawater penetration due to the semi-daily high tide. The combination of these different events will result in the loss of goods and services, and require expensive investments for adaption.
Key words sea level rise; flooding; climate change; global warming; tides; climate change; tide gauge; global warming; coast; Cuba
INTRODUCTION
The Cuban archipelago extends from east to west between the Gulf of Mexico, Florida Straits and the canals of St. Nicholas and Old Bahamas to the north; the western Caribbean Sea and Columbus Strait to the south, and the Yucatan Channel and Windward Passage to the west and east, respectively. It is located between latitudes 19°49′36″ and 23°17′09″ north, and longitudes 74°07′52″ and 84°54′57″ west. The Island of Cuba is long and narrow, with 1250 km from Cabo de San Antonio at the western end, to the easternmost point, Punta Maisí. The maximum width is 191 km and the minimum only 31 km. The archipelago consists of the Island of Cuba, the Isle of Youth, and more than 1600 islands, islets and keys, amounting to a total surface area of about 110 922 km2. An area of approx. 105 007 km2 corresponds to the Island of Cuba, and 2200 km2 to
the Isle of Youth. The remaining keys and islets cover 3715 km2, while the insular shelf spans
67 832 km2 (Furrazola and Nuñez, 1997). There are four types of coast: iron-shore low terrace,
mangrove swamps, beaches and coastal cliffs (Toledo et al., 2005), with four corresponding shelf areas, separated by coastal sectors where the shelf edge is close to the coast.
Sea level rise has been identified as the main threat to the Cuban archipelago (Centella et al., 2001; Hernández-González et al., 2012). The objective of the present paper was to determine the first approximation of possible coastal zone flooding by 2100, taking into account the more persistent processes of sea level variability and non-accelerated linear sea level rise estimation to assess the main impacts, from direct measurements at 39 temporary and permanent tide gauges of the National Tide Gauge Network and from a geographic information system.
DATA AND METHODS
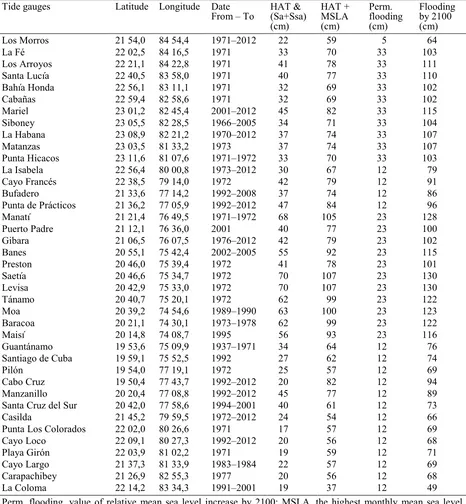
Sea level hourly height time series from 38 permanent and temporary tide gauges of the National Tide Gauge Network plus Guantanamo tide gauge were used as primary information (Fig. 1 and Table 1). The National Tide Gauge Network was created in 1966, and its measurements and analysis are governed by a unique documented methodology (Geocuba Geodesia, 2004) that takes into account international standards (IOC, 2006). Equipment used for measurements have the characteristics recommended by the Intergovernmental Oceanographic Commission (Hernández-González et al., 2010). Monthly and annual mean values from six Cuban tide gauges are sent to GLOSS.
From – To (Sa+Ssa)
(cm) MSLA (cm) flooding (cm) by 2100 (cm) Los Morros 21 54,0 84 54,4 1971–2012 22 59 5 64 La Fé 22 02,5 84 16,5 1971 33 70 33 103 Los Arroyos 22 21,1 84 22,8 1971 41 78 33 111 Santa Lucía 22 40,5 83 58,0 1971 40 77 33 110 Bahía Honda 22 56,1 83 11,1 1971 32 69 33 102 Cabañas 22 59,4 82 58,6 1971 32 69 33 102 Mariel 23 01,2 82 45,4 2001–2012 45 82 33 115 Siboney 23 05,5 82 28,5 1966–2005 34 71 33 104 La Habana 23 08,9 82 21,2 1970–2012 37 74 33 107 Matanzas 23 03,5 81 33,2 1973 37 74 33 107 Punta Hicacos 23 11,6 81 07,6 1971–1972 33 70 33 103 La Isabela 22 56,4 80 00,8 1973–2012 30 67 12 79 Cayo Francés 22 38,5 79 14,0 1972 42 79 12 91 Bufadero 21 33,6 77 14,2 1992–2008 37 74 12 86 Punta de Prácticos 21 36,2 77 05,9 1992–2012 47 84 12 96 Manatí 21 21,4 76 49,5 1971–1972 68 105 23 128 Puerto Padre 21 12,1 76 36,0 2001 40 77 23 100 Gibara 21 06,5 76 07,5 1976–2012 42 79 23 102 Banes 20 55,1 75 42,4 2002–2005 55 92 23 115 Preston 20 46,0 75 39,4 1972 41 78 23 101 Saetía 20 46,6 75 34,7 1972 70 107 23 130 Levisa 20 42,9 75 33,0 1972 70 107 23 130 Tánamo 20 40,7 75 20,1 1972 62 99 23 122 Moa 20 39,2 74 54,6 1989–1990 63 100 23 123 Baracoa 20 21,1 74 30,1 1973–1978 62 99 23 122 Maisí 20 14,8 74 08,7 1995 56 93 23 116 Guantánamo 19 53,6 75 09,9 1937–1971 34 64 12 76 Santiago de Cuba 19 59,1 75 52,5 1992 27 62 12 74 Pilón 19 54,0 77 19,1 1972 25 57 12 69 Cabo Cruz 19 50,4 77 43,7 1992–2012 20 82 12 94 Manzanillo 20 20,4 77 08,8 1992–2012 45 77 12 89 Santa Cruz del Sur 20 42,0 77 58,6 1994–2001 40 61 12 73 Casilda 21 45,2 79 59,5 1972–2012 24 54 12 66 Punta Los Colorados 22 02,0 80 26,6 1971 17 57 12 69 Cayo Loco 22 09,1 80 27,3 1992–2012 20 56 12 68 Playa Girón 22 03,9 81 02,2 1971 19 59 12 71 Cayo Largo 21 37,3 81 33,9 1983–1984 22 57 12 69 Carapachibey 21 26,9 82 55,3 1977 20 56 12 68 La Coloma 22 14,2 83 34,3 1991–2001 19 37 12 49 Perm. flooding, value of relative mean sea level increase by 2100; MSLA, the highest monthly mean sea level anomaly; HAT & (Sa + Ssa), the value of the highest astronomical tide that includes sea level seasonal variations; Flooding by 2100, sea level flooding by 2100.
Marcelino Hernándezet al.
24
Fig. 1 Geographical distribution of tide gauges and estimated sea level flooding by 2100.
Sea level rise calculation
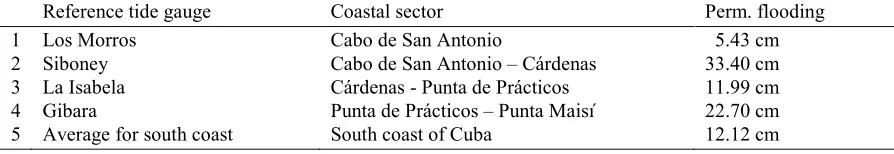
Restitution of absent data in the series of observed sea level hourly heights, the calculation of annual mean values and of trend, estimated as a linear adjustment of the annual mean values from a first grade linear equation, were performed according to Hernández-González et al. (2010). The calculation of the annual linear rate of relative mean sea level was done from the tide gauges with longer measurements: Los Morros, Siboney, La Isabela, Gibara and Casilda (Table 1). The annual mean value series of tide gauges from Guantanamo to La Coloma were averaged, because trends are very mild or almost null on the southern coast of Cuba, especially in the longest data series (Hernández-González et al., 2010), and taking into account the existence of a high linear correlation between monthly mean value series and the determination coefficient values, R
between 0.76 and 0.90 (Hernández-González and Marzo, 2009). From the new series obtained, a single annual linear rate for the entire south coast was calculated. Then, five values of the annual linear rate of relative mean sea level were calculated, and with these, the values of relative mean sea level increase by 2100 (Table 2).
Sea level flooding by 2100 (Flooding area by 2100) was calculated as the sum of permanent flooding, represented by the value of relative mean sea level increase by 2100 (Perm. flooding), the highest monthly mean sea level anomaly (MSLA), and the value of the highest astronomical tide that includes sea level seasonal variations (HAT & Sa + Ssa) (see Table 1).
RESULTS
Astronomical tides
Mixed semi-diurnal tide prevails in Cuban waters, except for some small coastal sectors where diurnal and mixed-diurnal tides occur. Tide mean amplitude varies between less than 25 cm and 65 cm, and is bigger on the north coast than on the south (Rodríguez and Rodríguez, 1983). For the present work, the highest astronomical tide (HAT) values were used, according to the updated information reported annually for each tide gauge (SHG, 2012).
Annual mean cycle and monthly anomalies
The maximum values of the sea level annual mean cycle (AMC) are located between September and October, and the minimum values between January and March (Hernández-González and Marzo, 2009). Long-term solar annual (Sa) and solar semi-annual (Ssa) components determine the seasonal variability, with values comparable to those of the main semi-diurnal lunar wave, M2. For
this reason, the resultant of the Sa + Ssa component at each tide gauge was added to HAT values, according to the updated information reported annually by the Hydrographic and Geodetic Service (SHG, 2012).
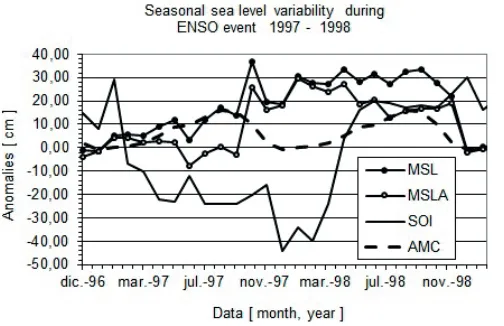
Fig. 2 Sea level monthly anomalies. MSL – monthly sea level; MSLA - monthly sea level anomalies; SOI - Southern Oscillation Index; AMC – annual mean cycle.
It has been proven that remarkable positive anomalies of monthly and annual mean sea level are recorded during ENSO events in all Cuban tide gauges (Fig. 2), with important alterations of annual mean sea level cycle during one year and more (Blázquez, 1989; Hernández-González & Díaz-Llanes, 2001; Hernández-González and Marzo, 2009; Hernández-González et al., 2012). Some of the monthly mean sea levels recorded are comparable in magnitude with some of the estimates of the relative mean sea level increment for halfway through the present century because of climate change. Therefore, these extreme monthly levels were taken into account when mapping floods by long-term mean sea level rise. In the present work, the monthly mean sea level of 36.8 cm recorded at La Isabela tide gauge in November 1997 (Fig. 2) was used.
The annual linear rate of relative mean sea level in the Cuban archipelago
Marcelino Hernándezet al.
26
Sea level flooding by 2100 and consequences
According to these results, the total flooded area would be 8.24% of Cuban territory (Fig. 1; Table 1), assuming that all or most of the keys and islands will be flooded or seriously affected. Most of the flooded areas coincide mainly with mangrove swamps on the south and northeastern coasts of Cuba. Mangrove swamps, of great economic and ecological importance, occupy 4.8% of the Cuban land area. Since they are open ecosystems, with a constant flow of matter and energy, they will exercise a strong influence on the adjacent land and sea ecosystems (Leda and Guzmán, 2002).
Ecological and human settlement studies foresee that keys and islands of the archipelago will be lost. Marshes occupied by mangrove forest formations and grasslands will be affected, as well as low coastal areas, river deltas, tidelands and sandy dunes on the beaches. A permanent flood of approximately 30 cm would affect more than 70 coastal settlements and cause the disappearance of 15 of them. Seawater intrusion in rivers and aquifers will increase. This process will cause
subsequent salinization of agricultural land, mainly in the dry season. Therefore, it is considered
more viable to relocate towns and economic activities (Rodríguez et al., 2010; Planos et al., 2012). The more evident consequences of relative mean sea level increase for the Cuban archipelago are: − Gradual increase in submerged areas at the expense of emerged areas.
− Gradual increase in the median plane of monthly and annual mean sea level anomalies. − Seawater intrusion in rivers and aquifers will increase.
− Gradual increase in coastal flooding.
− Need for costly investments in coastal protection structures and relocation of human settlements.
CONCLUSIONS
− The annual linear sea level rise rate in the Cuban archipelago, obtained from the longest tide gauge records, fluctuated between 0.214 cm/year at Siboney and 0.005 cm/year at Casilda. − Monthly and annual anomalies of mean sea level, some of which are similar to or higher than
the mean sea level rise estimated for halfway through the present century, reinforce the inland penetration of seawater due to the semi-daily tide run-up.
− The total flooded area would be 8.24 % of Cuban territory.
− The combination of these different events will result in the loss of goods and services, causing expensive investments for adaption.
Acknowledgements This work was sponsored by the research project “Estimation of the anomalies, trend, projection and return periods of relative mean sea level and extreme values during the present century, from measurements of the National Tide Gauge Network”, being developed at the Cuban Institute of Oceanology. The authors wish to express special thanks for their support to Dr Erlend Moksness, Research Director at the Norwegian Institute of Marine Research; Dr Thorkild Aarup, Senior Programme Specialist of the Intergovernmental Oceanographic Commission, and Mrs Martha M. Rivero Fernández, head of the Marine Information Service at the Institute of Oceanology.
REFERENCES
Blázquez, E. L. (1989) Anomalías del Nivel del Mar en La Habana, Cuba, durante el evento Oscilación del Sur – El Niño
(OSEN), de 1982-83. Reporte de Investigación 6, 11.
Centella A., et al. (2001) Primera Comunicación Nacional a la Convención Marco de las Naciones Unidas sobre Cambio
Climático. Grupo Nacional de Cambio Climático. Instituto de Meteorología. Cubaenergia, 169.
Furrazola, G. and Núñez, K. (1997) Estudios sobre Geología de Cuba. La Habana, CNDIG, 527. Geocuba Geodesia (2004) MET 30-34. Geocuba Geodesia Archive, 42.
Hernández-González, M., Marzo, O. and Acanda, A. (2010) Tendencia lineal del nivel medio del mar en algunas localidades
Hernández-González, M. and Marzo, O. (2009) Variabilidad estacional del nivel del mar en el archipiélago cubano. Serie Oceanológica 6, 1–15. ISSN: 2072-800X. Available from: http://oceanologia.redciencia.cu.
Hernández-González, M. and Díaz-Llanes, G. (2001a) Influences of ENSO on seasonal and inter-annual sea level variability in
the Cuban Archipelago. Serie Oceanológica, ISSN: 2072-800X. Available from: http://oceanologia.redciencia.cu.
IOC (2006) Manual on Sea Level Measurement and Interpretation. Vol. 4 – An Update to 2006. Ed. by T. Aaurup, et al.,
Intergovernmental Oceanographic. Commission Manuals and Guides 14 (IV), París, 80.
Leda, M. and Guzmán, J.M. (2002) Ecosistemas de manglar del archipiélago cubano. Editorial Academia. 465.
Planos, E., Rivero, R. and Guevara, V. (2012) Impacto del cambio climático y medidas de adaptación en Cuba. La Habana.
AMA, 520.
Rodríguez, J.P. and Rodríguez, J.F. (1983) Las mareas en las costas cubanas. Reporte de Investigación, 6, 34.
Rodríguez, C., Favier L. and Boquet A. (2010) Evaluación del impacto y vulnerabilidad de los asentamientos costeros por efecto del cambio climático y eventos meteorológicos extremos para los años 2050 y 2100. Versión III mapa de Alerta Temprana. Informe técnico. Instituto de Planificación Física, 84.
SHG (2012) Tablas de marea de las costas de Cuba. Servicio Hidrográfico y Geodésico de la República de Cuba, La Habana, Edimar, 248.
Toledo, M., et al. (2005) Características geólogo – geomorfológicas de las costas cubanas. Incidencia en la vulnerabilidad de