QUANTIFICATION OF VEHICULAR INTERACTION DURING
SATURATION FLOW AT SIGNALISED INTERSECTIONS
Preethi Prathapan1, Ashalatha Rajamma21
1 Department of Civil Engineering, College of Engineering, Trivandrum, India 2 Department of Civil Engineering, Government College of Engineering, Kannur, India
Received 8 July 2015; accepted 23 September 2016
Abstract: Estimation of saturation flow under heterogeneous traffic condition is a challenging task in the capacity analysis of signalised intersections due to complexity of vehicular interaction. Studies have established that quantification of vehicular interaction can be achieved by estimating Passenger Car Unit (PCU) values for different categories of vehicles in the traffic stream. Most of the studies have used ratio between speed differential and horizontal projected area of vehicles to model dynamic PCU. At signalised intersections speed ratio would not vary much and hence these models do not capture the exact dynamic nature of PCU in its full extent. In this study dynamic PCU for heterogeneous traffic at signalised intersections is estimated based on area occupancy, an indirect measure of extent of road usage. Traffic flow details at the intersection area during saturated green time are collected from different signalised intersections to determine the area occupancy of the heterogeneous traffic. The field determined area occupancy and mean occupancy time are utilized to determine the equivalent homogeneous traffic stream area and the number of standard car spaces (NCS) existing in the traffic stream. The individual PCU values are estimated based on NCS and number of various categories of vehicles existing in the traffic stream during saturated green time. The PCU values estimated indicate that traffic characteristics, control conditions and approach width have significant effect on PCU values and the effect is predominant in the PCU values for heavy vehicles. The PCU values of vehicles passing through signalised intersections with the control condition through and right turn movement permitted in same phase are lower than the PCU values of vehicles passing through intersections having through only movement in one phase. Keywords:signalised intersections, heterogeneous traffic, saturation flow, area occupancy, dynamic PCU, standard car.
2 Corresponding author: [email protected]
1. Introduction
Signalised intersections are provided in traffic networks to improve safety and efficiency of vehicular as well as pedestrian movements. The design of efficient traffic signal has always been a challenging task for traffic engineers. Traffic signal when properly designed, increases the traffic
The road traffic in developing countries like India is highly heterogeneous with vehicles having wide variations in static and dynamic characteristics. Strict adherence to lane discipline is not observed. Vehicles like two wheelers and three wheelers tend to choose available lateral gaps on the road based on space availability. Under these conditions, the interaction among various categories of vehicles become complex and is influenced by traffic and geometric factors. Hence the representation of saturation flow in number of vehicles passing stop line per unit time will be inappropriate for heterogeneous traffic conditions. The accurate quantification of vehicular interaction is a prerequisite for the realistic estimation of saturation flow under heterogeneous traffic conditions.
The variability in vehicle mix can be accounted for in the estimation of saturation flow by using the widely accepted measure, Passenger Car Unit (PCU). PCU for a vehicle category indicates the amount of interaction caused by that vehicle type to the entire traffic stream. Studies have established that PCU is not static but varies with traffic and geometric conditions (Arasan and Jagdeesh, 1995; Chandra et al., 1996; Basu et al., 2006; Al-Kaisy et al., 2005). The change in traffic mix is expected to change the level of vehicular interaction and therefore the equivalency factors may also change. Realistic estimation of PCU incorporating the effect of all factors of geometry, traffic and control condition is a complex task.
Many researchers suggested various methods for the estimation of dynamic PCU values based on changes in various performance measures such as headway, density, delay, queue discharge, speed, vehicle-hours, travel time etc. (Bhattacharya and Mandal, 1980; Webster and Elefteriadou, 1999; Benekohal
and Shao, 2000; Al-kaisy et al., 2005; Basu et al., 2006; Sumner et al.,1984; Keller and Saklas, 1984). These performance measures are suitable for traffic streams with less degree of heterogeneity and traffic following strict lane discipline. The wide variations in physical and dynamic characteristics of vehicles present in the heterogeneous traffic conditions similar to the one existing in India demand an alternative measure which explains the extent of usage of road space by vehicles in a better way. This paper is concerned with the development of a new methodology based on area occupancy concept for the realistic estimation of dynamic PCU values of various categories of vehicles at signalised intersections under heterogeneous traffic conditions.
2. Literature Review
Highway Capacity Manual (HCM, 1965) introduced the concept of PCE for the first time to account for the effect of heavy vehicles in a non uniform stream of vehicles. According to HCM, PCE is the number of passenger cars that are displaced by a single heavy vehicle of a particular type under prevailing roadway, traffic and control conditions. The HCM provides different sets of PCE values, to be used for highway facilities like two lane highway, multilane highway, freeways and intersections. To account for the effect of heavy vehicles on saturation flow, HCM (2010) has considered each heavy vehicle as equivalent to two numbers of through cars. In India, IRC (1990) provided a set of static PCU values for 10 categories of vehicles normally found on Indian roads depending on vehicle composition in the traffic stream.
PCU based on vehicle area and speed. According to the proposed method PCU values for different vehicles under mixed traffic situation is directly proportional to the speed ratio and inversely proportional to the space occupancy ratio with respect to the standard design vehicle (passenger car). The researchers emphasised that PCU factors of different categories of vehicles do not remain constant, but fluctuate with traffic, roadway, control and environmental conditions. Benekohal and Zhao (2000) introduced delay based passenger car equivalent to (D_PCE) single unit trucks and combination trucks at signalised intersections. The method considered additional delay increased by heavy vehicles on the traffic stream. TRAF-NETSIM simulation model was adopted to cover broad range of traffic conditions. Regression models for prediction of D_PCU were also formulated as a function of traffic volume and percentage of heavy vehicles. Rahman et al. (2003) investigated the effect of heavy vehicle’s position in queue for estimating PCU values based on delay. The results indicated that for the same percentage of heavy vehicles, PCE value decreases as the position of large size vehicles in the queue increases.
Chandra and Kumar (2003) investigated the effect of lane width on PCU for different categories of vehicles and on capacity of two lane road. The results showed that PCU for a vehicle type increases with increasing lane width. Basu et al. (2006) explored the effect of traffic volume and vehicle composition on PCE of different vehicle types in mixed traffic stream at urban mid block sections. Reduction in stream speed was taken as the measure of equivalence for modelling PCE. Neural Network approach was adopted for capturing non linear effect of traffic volume and composition on stream
speed. Non linear variation was observed in PCE values of various categories of vehicles with respect to volume and composition. Al-Kaisy et al. (2005) proposed PCE values for heavy vehicles on freeways and multilane highways during congestion. Empirical data and microscopic traffic simulation were adopted to develop a set of PCE factors on level terrain and specific upgrades during congestion. Arasan and Vedagiri (2006) investigated the applicability of the simulation model HETEROSIM, which has been developed to model heterogeneous traffic flow, in the estimation of saturation flow rate of straight on traffic for various road way and traffic conditions prevailing in India. Tiwari et al., (2007) estimated dynamic PCU values for various categories of veh icles using modi f ied densit y method. Passenger car unit adjustment factor, fPCU, was introduced to convert a passenger car in heterogeneous traffic into its homogeneous traffic counterpart. The study also rendered Passenger Car Units for each Indian traffic type in relation to an Indian passenger car. Arkatkar and Arasan (2010) adopted microscopic simulation approach for the estimation of PCU values of various categories of vehicles. The effect of traffic volume and width of road space was investigated. It was found that the change in the PCU value of the different categories of vehicles, due to change in traffic volume, is directly influenced by the change in the speed difference between the reference vehicle and the subject vehicle.
al. (2010) estimated Passenger Car Unit (PCU) values of motorcycles at signalised intersections in two traffic environments such as at the beginning of green period and in saturation flow. The study employed flow rate method to estimate motorcycle PCU values, with the help of an agent-based simulation model, which is capable of representing the characteristic movement patterns of motorcyclists. The model indicated that the PCU values of motorcycles at the beginning of green periods were lower than those in multiple-lane saturation flows and it decreased with increase in lane width. Radhakrishnan and Mathew (2011) derived PCU values from field data by minimising the observed and ideal flow profile. The study attempted to bring the discharge profile of a non lane based heterogeneous traffic as close as possible to homogeneous traffic by minimising the Theil’s coefficient. Optimum PCU values were determined by an iterative procedure. PCU values corresponding to minimum coefficient was adopted for the current iteration and the procedure was repeated till the flows computed in the successive iterations converge. De Luca and Dell’Aqua (2013) estimated PCE coefficients for heavy vehicles plying through two lane highways of Italy. The results showed PCE values vary significantly with vehicular flow and scarcely affected by changes in speed. It was also found that the PCE values tend towards 1 for flow values approaching 1000pcphpl. Mehar et al. (2014) suggested PCU values for different type of vehicles at different Level of Service (LOS) and for different traffic composition on four-lane and six-lane divided highways. The review of literature presented above reveals that studies conducted for determination of PCU values are not comprehensive enough to represent the field conditions during saturation flow at signalised intersections
under heterogeneous traffic conditions. Some of the widely accepted studies on PCU at signalised intersections under heterogeneous traffic conditions adopted speed variation and space requirement of various categories of vehicles in relation to passenger car for the estimation of PCU values (Chandra et al.,1996; Chandra and Molla, 2010). But at signalised intersections the speed at which vehicles traverse the intersection space (clearing speed) does not vary significantly (Maini and Khan, 2000). The present research work is therefore aimed at developing a new methodology based on area occupancy for the realistic estimation of dynamic PCU values for various categories of vehicles at signalised intersections having different control conditions.
3. Methodology
are set in the present study: Intersections on level grade, No curb parking, No bus Stoppages near intersection, Only through traffic on carriage way, and No pedestrians and bicycles.
3.1. Area Occupancy
Area occupancy is defined as the proportion of time a set of observed vehicles occupy the chosen stretch of a roadway (Mallikarjuna and Rao, 2006; Arasan and Dhivya, 2010). Eq. (1) shows the expression for area occupancy (AO),
(1)
where, ti is the occupancy time of vehicle category i in seconds in the selected area, ai is the area of the road space occupied by the vehicle i in m2, T is the total observation period in seconds and A is the area of study stretch in m2.
In order to estimate area occupancy, vehicles in the traffic stream were divided into five categories such as small car/standard car (SC), big utility vehicle (BUV) which include big cars and light commercial vehicles, heavy vehicle (HV) which include bus and truck, motorized three wheeler (3W) and motorized two wheeler (2W). The horizontal projected areas of these categories of vehicles are 5.36, 7.82, 24.54, 3.64 and 1.20 m2 respectively. In this study cars having average length and width 3.72 and 1.44 m is fixed as standard car (small car) (Dhamaniya and Chandra, 2010) and dynamic PCU is estimated with respect to this standard passenger car. The determination of area occupancy of vehicles crossing the stop line during saturated green
time at a signalized intersection can be made based on horizontal projected area and occupancy time of all categories of vehicles passing/ existing the observation region. Let aSC, aBUV, a3W, a2W and aHV be the horizontal projected areas of small car, big utility vehicle, motorized three wheeler, motorized two wheeler and heavy vehicle respectively and tSC, tBUV, t3W, t2W and tHV are the occupancy time of these vehicles during observation period T (saturated green time). L and W be the distance between stop lines and width of approach respectively. Then area occupancy can be estimated using Eq. (2)
(2)
Area occupancy is a non dimensional parameter and its value ranges from 0 to 1. Total area occupancy can be considered equivalent to the sum of area occupancy of individual categories of vehicles during the observation period. Thus the area occupancy can be expressed as shown in Eqs. (3) and (4).
(3)
where, AOi is the area occupancy of ith category vehicle
(4)
where, ai is the horizontal projected area of i th category vehicle in m2 and t
i is the occupancy time of ith category vehicle in seconds and n is the number of vehicles in ith category.
be considered equivalent to standard car area occupancy provided only standard cars are in the traffic stream and its occupancy time is equivalent to weighted average occupancy time of vehicles present in the intersection area during saturated green time.
Let (Aeq)i be total standard car horizontal projected area (equivalent homogeneous traffic stream area) equivalent to ith category vehicle clearing the intersection during saturated green time and ts be the occupancy time (weighted average occupancy time of the traffic stream in the intersection area) of vehicles passing the intersection area during
observation period. will be the total standard car occupancy corresponding to the observed area occupancy. Total occupancy of a vehicle category i can be converted to standard car area occupancy as shown in Eqs. (5) and (6).
(5)
(6)
where, (Aeq)i is the equivalent standard car area that is occupied corresponding ith category of vehicle during saturated green time.
The equivalent number of standard car spaces corresponding to ith category of vehicle, (Ncs)i, present in the intersection area during saturated green time can be determined using equation (7).
(7)
where, aSC is the horizontal projected area of standard car in m2.
3.2. Dynamic PCU Values for Various
Categories of Vehicles
The number of standard car spaces obtained through equation (7) can be considered as the equivalent number of passenger cars replacing the total number of the vehicles in the category i. Let ni be the number of vehicles in the ith category then the dynamic PCU value of the vehicle can be found out using the equation shown below (Eq. 8).
(8)
4. Data Collection
only through movement. Rest of the eight approaches have right turn traffic along with through traffic. The width of these was also in the range 7 to 11m. The average vehicle composition were : SC- 17 to 35%, BUV- 2 to 9 %, 3W- 12 to 25%, 2W- 36 to 48%, bus- 7 to 11%.The data collected from these approaches were adopted for studying the variation in PCU values of straight moving vehicles in the presence of right turn traffic. The data required for the study are: compositional share and horizontal projected area of each vehicle category crossing stop line during saturated green time, entry and exit time of each vehicle in the observation region, geometric details of the intersection area, width of approach and saturated green time. Traffic flow data were collected during peak hours on typical week days for 1.5 to 2 hours for each approach leg.
No non motorized vehicles and trucks were observed during the data collection period. Pedestrian traffic was also negligible in the selected study locations. Only buses were observed during data collection period in the heavy vehicle category. The geometric details such as width of approach, distance between stop lines were physically measured from field.
5. Extraction and Analysis of Field Data
For the extraction of data from the video, video editing software was used. The video film recorded was played on a large screen monitor. A longitudinal trap of 20 m was marked in the intersection area ahead of stop line and this area was selected as the observation region. The observation was started after five seconds from the initiation of green time to the approach under
consideration to account for the start up loss time. Saturation flow in veh/hr was determined by making classified count of all vehicles crossing the stop line while the vehicles moved continuously without break and the counting was stopped soon after a break was observed in the bunch of vehicles on the approach.
The video film was replayed to extract the occupancy time of each category of vehicle. The entry time and exit time of each vehicle in the observation region were noted and the occupancy time is taken as the difference between the entry time and exit time. The video film was replayed many times to extract the required details accurately. The total area occupancy of vehicles during saturated green time was estimated based on Eq. (2).Observed saturation flow in the data set ranged between 2000 to 10,000 veh/hr for intersection approaches that have only through movement while the saturation flow for approaches that have through and right turn movement in single phase ranged between 2000 and 7500 veh/hr.
6. Determination of Dynamic PCU Value
dynamic PCU values for various categories of vehicles present in through traffic changes with variations in approach width, traffic composition and movement allowed in a phase.
In this work dynamic PCU values for different categories of vehicles are estimated based on a passenger car that has average length and width 3.72 m and 1.44 m and occupancy time as the average occupancy time of the traffic stream in the observation region. Due to this approach all the cars in the traffic stream may not have the PCU value same as one. Variation in PCU values were observed depending on traffic composition, approach width and control condition.
7. Effect of Various Influencing Factors
on Dynamic PCU Values
In a heterogeneous traffic condition number of vehicles that can cross the stop line during saturated green time may vary with composition of traffic. Hence considerable changes can be observed in saturation flow in veh/hr at signalised intersections between cycles. The relative impact of various categories of vehicles in saturation flow can be expressed in terms of dynamic PCU. It can be seen from Table 1 that dynamic PCU values for different categories of vehicles vary with respect to saturation flow, vehicle composition, approach width and control condition. In order to investigate the effect of various influencing factors on PCU, saturation flow was analysed based on occupancy time of various categories of vehicles.
7.1. Variation in PCU Value with Traffic
Composition
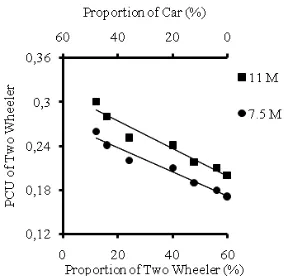
In order to understand the variation in dynamic PCU of a vehicle category with traffic composition, PCU values were estimated. A saturation flow of 4500 veh/ hr which was most frequently observed in field was selected. These observed saturation flow data of 4500 veh/hr were having varying proportion of various categories of vehicles. Fig.1 shows the variation in dynamic PCU for bus, with increase in its own proportion on 7.5m and 11m wide approaches. The graph was drawn by selecting dynamic PCU values estimated for a saturation flow of 4500 veh/ hr with total observed proportions of BUV, 3W and 2W as 65 percent, while SC and bus contribute the remaining 35 percentage in a complementary manner. As may be seen from the graph, dynamic PCU value of bus increases with increase in approach width and decreases with increase in its own proportion. The variation in dynamic PCU values for 3W and 2W with increase in its own proportion are shown in Figs.2 and 3. Fig.2 is drawn by selecting dynamic PCU values estimated for a saturation flow of 4500 veh/hr with total observed proportion of BUV, 2W and bus as 60% while 3W and SC contribute the remaining 40%.
of standard car/small car in a complementary
manner with an intention to understand the influence of degree of heterogeneity on magnitude of vehicular interaction.
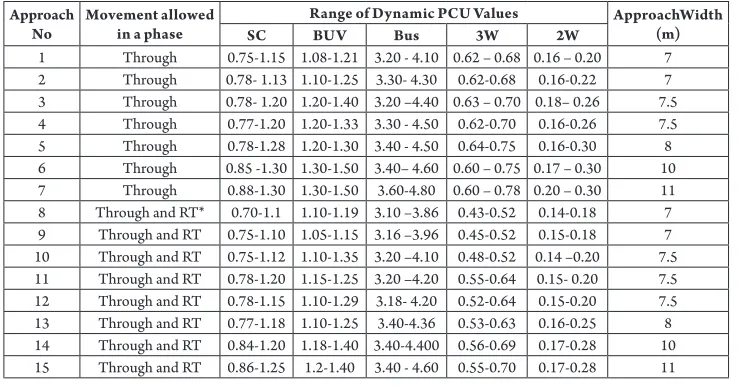
Table 1
Range of Dynamic PCU Values at the Selected Intersection Approaches Approach
No Movement allowed in a phase
Range of Dynamic PCU Values ApproachWidth (m)
SC BUV Bus 3W 2W
1 Through 0.75-1.15 1.08-1.21 3.20 - 4.10 0.62 – 0.68 0.16 – 0.20 7
2 Through 0.78- 1.13 1.10-1.25 3.30- 4.30 0.62-0.68 0.16-0.22 7
3 Through 0.78- 1.20 1.20-1.40 3.20 –4.40 0.63 – 0.70 0.18– 0.26 7.5
4 Through 0.77-1.20 1.20-1.33 3.30 - 4.50 0.62-0.70 0.16-0.26 7.5
5 Through 0.78-1.28 1.20-1.30 3.40 - 4.50 0.64-0.75 0.16-0.30 8
6 Through 0.85 -1.30 1.30-1.50 3.40– 4.60 0.60 – 0.75 0.17 – 0.30 10
7 Through 0.88-1.30 1.30-1.50 3.60-4.80 0.60 – 0.78 0.20 – 0.30 11
8 Through and RT* 0.70-1.1 1.10-1.19 3.10 –3.86 0.43-0.52 0.14-0.18 7
9 Through and RT 0.75-1.10 1.05-1.15 3.16 –3.96 0.45-0.52 0.15-0.18 7
10 Through and RT 0.75-1.12 1.10-1.35 3.20 –4.10 0.48-0.52 0.14 –0.20 7.5
11 Through and RT 0.78-1.20 1.15-1.25 3.20 –4.20 0.55-0.64 0.15- 0.20 7.5
12 Through and RT 0.78-1.15 1.10-1.29 3.18- 4.20 0.52-0.64 0.15-0.20 7.5
13 Through and RT 0.77-1.18 1.10-1.25 3.40-4.36 0.53-0.63 0.16-0.25 8
14 Through and RT 0.84-1.20 1.18-1.40 3.40-4.400 0.56-0.69 0.17-0.28 10
15 Through and RT 0.86-1.25 1.2-1.40 3.40 - 4.60 0.55-0.70 0.17-0.28 11
*rt- Right Turn
From these figures it is observed that the general trend of variation of dynamic PCU is same, ie; decrease in PCU with increase in proportion of the subject vehicle. The rate of decrease in PCU values of bus, 3W and 2W with respect to increase in its own proportion along 7.5m wide approach is more when compared to 11m. The average proportional composition of the BUV were in the range of 5 to 7% in all approaches that have only through movement. Hence variation in dynamic PCU of BUV was not studied. It was also observed that the PCU values of various categories of vehicles increases with increase in approach width for the same saturation flow and vehicle composition. The curves also indicate that the rate of decrease in PCU value of bus with increase in its own proportion is more on 7.5m wide approach (1.8% decrease for
2% increase in proportion of bus) than on 11m. On 11m wide approach the decrease is marginal. For 3W and 2W the decrease in PCU value with increase in its own proportion is 1.5% and 1% respectively for the same rate of increase in its own proportion on 7.5 m wide approach.
Fig. 1.
Variation in PCU of Bus with Proportion
Fig. 2.
Variation in PCU of 3W with Proportion
Fig. 3.
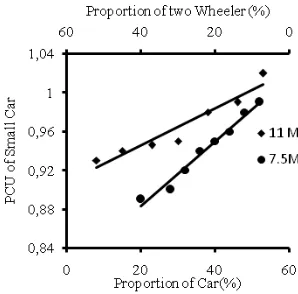
Fig. 4.
Variation in PCU of Car with Proportion
7.2. Effect of Saturation Flow on PCU
An attempt was also made to investigate the effect of saturation flow rate on dynamic PCU values of various categories of vehicles. For this purpose PCU values of various categories of vehicles were estimated for different saturation f low rates observed in field. Proportional composition of vehicles were different at different observed saturation flow levels. Therefore to study the effect of saturation flow on PCU values, graphs have been drawn relating estimated dynamic PCU values and corresponding saturation flow rates keeping traffic composition at a chosen level. The graphs drawn for different categories of vehicles on 7.5m wide approach for a proportional composition of small car-30%, big car- 5%, Three Wheeler-18%, Two Wheeler- 40%, and Bus-7% are shown in Figs.5 and 6. It can be observed that in all the cases the PCU value of the subject vehicle decreases with increase in saturation flow rate. The rate of decrease in PCU values for bus, BUV, 3W, 2W and SC are 2%, 0.8%, 1.1%,0.5% and 0.6% respectively for 10% increase in saturation flow rate.
7.3. Variation in PCU of Straight Moving
Vehicles in the Presence of Right Turn
Traffic
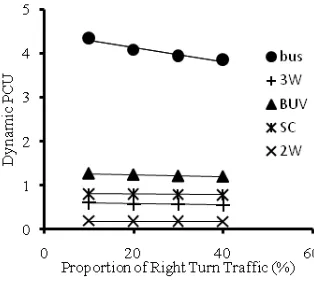
In order to understand the effect of right turn traffic in PCU values of vehicles in through traffic where both direction movements were present in the same phase with no separate lane markings. Fig.7 presents the variation in PCU values of different categories of vehicles in through movement with percentage of right turn traffic. As may be seen from the curve the dynamic PCU values of all categories of vehicles decreases with increase in proportion of right turn traffic.
Fig. 5.
Variation in Dynamic PCU value of Bus with Saturation Flow in veh/hr
Fig. 6.
Variation in Dynamic PCU of vehicles with Saturation Flow in veh/hr
Fig. 7.
Fig. 8.
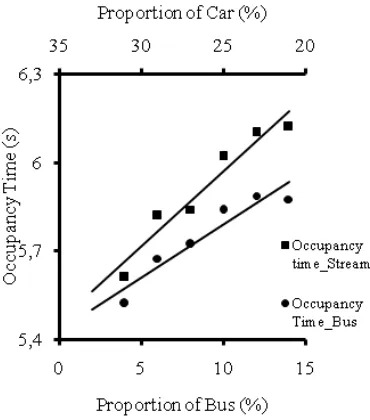
Variation in Occupancy Time with Proportion of Bus on 7.5m wide Approach
8. Discussion
The variations in PCU values of various categories of vehicles with respect to composition and approach width may be attributed to the change in heterogeneity of traffic stream between cycles. The decrease in PCU values of bus with increase in its own proportion and decrease in proportion of small car is due to the variation in the occupancy time of bus and equivalent homogeneous traffic stream passing/ existing the observation region during saturated green time. Increase in proportion of a vehicle category larger than standard car increases the occupancy time of the equivalent homogeneous traffic stream due to the increase in the impedence for the movement under consideration due to surrounding vehicles in the traffic stream. Fig. 8 show the graph relating the occupancy time of bus and equivalent homogeneous traffic stream with traffic composition as specified in section 7.1 along 7.5m wide approach. From the graph it can be observed that as percentage of bus increases by 2%, the occupancy time of bus increases by 1.2
% while that of the equivalent homogeneous traffic stream increases by 5.6%. As dynamic PCU of the subject vehicle is estimated based on the ratio between the area occupancy of the subject vehicle and occupancy time of the stream, the PCU value of bus exihibit a decrease with increase in its own proportion.
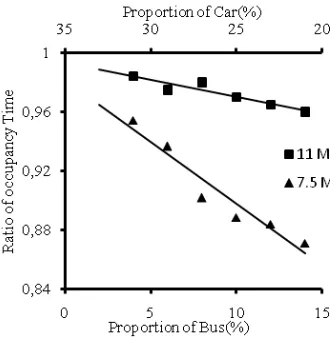
relating ratio of occupancy time of bus and stream on 7.5m and 11m wide approaches. Fig.10 shows the graph relating the ratio of occupancy time of subject vehicle and equivalent homogeneous traffic stream with proportion of bus along 7.5 m and 11m wide approaches. From the graph it is clear that the ratio decreases with increase in proportion of bus. But the slope of graph is flattened for 11m wide approach. This implies that increase in proportion of bus in wider approaches would not impede the movement of surrounding vehicles in the same extent as on 7.5 m. Hence the PCU value of bus exhibits an increase on wider approaches.
The dynamic PCU values of 3W and 2W also decrease with increase in its own proportion
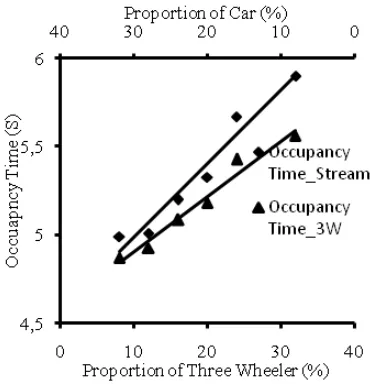
and increase with increase in approach width. The occupancy time of 3W and traffic stream on 7.5 m and 11m wide approaches are shown in Figs.11 and 12. Fig.13 presents the graph relating the ratio of occupancy time of 3W and equivalent homogeneous traffic stream with proportion of 3W for 7.5 m and 11m wide approaches. From the graph it is clear that the ratio decreases with increase in proportion of 3W. Here also the slope of graph is flattened for 11m wide approach. This implies that increase in proportion of vehicles that have smaller size than standard car on wider approaches would not impede the movement of surrounding vehicles in the same degree as on narrow approaches. On narrow approaches they create poor operating conditions for large sized vehicles.
Fig. 9.
Fig. 10.
Ratio of Occupancy Time of Bus and Stream with Proportion of Bus
The rate of increase in occupancy time of equivalent traffic stream is 0.8% for 2% increase in proportion of 3W on 7.5 m wide approach while the rate of increase is 0.6% on 11m wide approach. The rate of increase in occupancy time of stream is less when compared rate of increase in occupancy time of stream due to the increase in proportion of bus. Hence the rate of decrease in PCU of 3W with increase in its own proportion is less compared to bus. The variation in PCU values of 2W show the same trend as that of 3W hence the explanation provided for the trend in the case of 3W is applicable to 2W also.
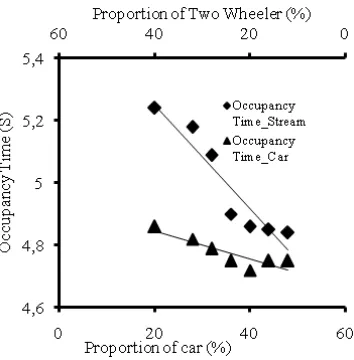
The variation in PCU values of SC is shown in Fig.4. Increase in proportion of small car accompanied by the decrease in proportion of two wheeler leads to homogeneous traffic condition. As proportion of small car increases the area occupancy increases and the occupancy time of the equivalent homogeneous traffic stream clearing the
intersection will be close to that of small cars. Since cars have better operating characteristics than other categories of vehicles the occupancy time will be less. Hence the equivalent homogeneous traffic stream area corresponding to small cars will be more as per Eq.7. Therefore the dynamic PCU value increases with increase in its own proportion.
that the occupancy time of standard car decreases by 1.8% for 5% increase in proportion while the occupancy time of the sream decreases by 3 %. Fig.15 shows
that on 11m wide approach the decrease is 1.1% for stream and 0.8% for small car. Hence dynamic PCU value increases on wider approach.
Fig. 11.
Variation in Occupancy Time with Proportion of 3W on 7.5m Approach
Fig. 12.
Fig. 13.
Ratio of Occupancy time of 3W and Streamwith Proportion of 3W
Fig. 14.
Variation in Occupancy Time with of Small Car on 7.5m Wide Approach
Figs. 5 and 6 show the variation in dynamic PCU of various categories of vehicles with saturation flow rate. As may be seen from these graphs the PCU values exihibit a
causes relatively lower manoeuvrability for all categories of vehicles.Hence occupancy time of the traffic stream as well as various categories of vehicles increases in the observation region. Increase in average occupancy time invariably reduces the equivalent homogeneous traffic stream area as per Eq. 7 and the PCU values of all
categories of vehicles get reduced. The extent of reduction can be well understood from the variation in occupancy time ratio between subject vehicle and traffic stream. Fig. 16 illustrates the same and it can be observed that the rate of reduction in PCU values follows the same trend as that of occupancy time ratio.
Fig. 15.
Variation in Occupancy Time with Proportion of Small Car on 11m Wide Approach
Fig. 16.
It may be seen from Fig.7 that the PCU values of vehicles in the through traffic decrease in the presence of right turn traffic. The reason for the decreasing trend in PCU values of through traffic can also be explained based on the ratio between occupancy time of the stream and subject vehicle in the presence of right turn traffic, when compared to the traffic control condition, only through movement in single phase. The average occupancy time of the through traffic stream in the observation region increases when through and right turn movements are permitted in the same phase. As per Eq.6, the equivalent homogeneous traffic stream area decreases with increase in occupancy time. Hence dynamic PCU values of various categories of vehicles decreases.
9. Conclusion
In this study area occupancy, an alternative measure of density, is adopted as the basis for the estimation of dynamic PCU values for various categories of vehicles at signalised intersections having different control conditions. Field data collected from 15 signalised intersections were analysed to determine dynamic PCU values of various categories of vehicles. It was observed that all the cars in the traffic stream may not have dynamic PCU value same as 1. It was found that traffic composition, geometric characteristics and control conditions have significant effect on dynamic PCU values. PCU for all vehicle categories except small cars increase with increase in approach width and decrease with increase its own proportion. The effect is predominant for heavy vehicles. The PCU value for bus decreases by 1.8% for 2% increase in proportion on 7.5m wide approach while the decrease in PCU value for two wheeler and three wheeler are 1 %
and 1.5 % respectively for the same rate of increase in its own proportion. Along 11m wide approach the rate of decrease is marginal for all categories of vehicles. It was also found that dynamic PCU values decrease with increase in saturation f low rate. The rate of decrease in PCU values for bus, BUV,3W, 2W and SC are 2%,0.8%,1.1%,0.5% and 0.6% respectively for 10% increase in saturation flow rate along 7.5m wide approach. The results of the study also indicate that PCU values decrease if through and right turn movements are allowed in the same phase when compared to through movement only situation in one phase. The decrease is in the range 6 %, 2 %, 4 %, 1.6 % and 1.2% for bus, BUV, 3W, 2W and SC respectively for 10 % increase in right turning vehicles. It has been proposed to further develop mathematical models to predict PCU values incorporating the effects of traffic composition, approach width and to estimate adjustment factors to account for the effect of control conditions at intersections, to make it convenient for the estimation of saturation flow.
Acknowledgement
The authors would like to acknowledge the Kerala State Council for Science, Technology and Environment (KSCSTE),Government of Kerala, India for financing this study.
References
Aggarwal, P. 2011. Passenger Car Unit Value for Trucks using Fuzzy Model. In Proceedings of the World Congress on Engineering, II, 1017-1020.
Arasan, V.T.; Dhivya, G. 2010. Methodology for determination of concentration of heterogeneous traffic,
Journal of Transportation Systems Engineering and Information Technology, 10(4): 50-61.
Arasan,V.T.; Jagadeesh, K. 1995. Effect of heterogeneity of traffic on delay at signalized intersections, Journal of
Transportation Engineering, 121(5): 397-404.
Arasan,V.T.; Vedagiri, P. 2006. Estimation of saturation flow of heterogeneous traffic using computer simulation. In Proceedings of the 20th European Conference on Modelling
and Simulation, 393-398.
Arkatkar, S.S.; Arasan, V.T. 2010. Effect of gradient and its length on performance of vehicles under heterogeneous traffic conditions, Journal of Transportation
Engineering, 136(12): 1120-1136.
Basu, D.; Maitra, R.S.; Maitra, B. 2006. Modelling passenger car equivalency at an urban mid-block using stream speed as a measure of equivalence, European
Transport, 34(2006): 75–87.
Benekohal, R.F.; Zhao,W. 2000. Delay-based Passenger Car Equivalents for Trucks at Signalised Intersections,
Journal of Transportation Research Part A, 34(6): 437-457.
Bhattacharya, P.G.; Mandal, A.G. 1980. Investigation of passenger car equivalents at controlled intersection in Calcutta, Highway Research Bulletin, 14: 41-64.
Chandra, S.; Kumar, U. 2003. Effect of lane width on capacity under mixed traffic conditions in India, Journal of Transportation Engineering,129(2): 155-160.
Chandra, S.; Molla, D. 2010. Change in Vehicular Interaction and Saturation Flow at Signalized Intersections over Time, Highway Research Journal, 3(1): 69-76.
Chandra, S.; Sikdar, P.K.; Kumar, V. 1996. Capacity analysis of signalised intersections, Highway Research Bulletin, 54: 129-152.
De Luca, M.; Dell’Acqua, G. 2014. Calibrating the passenger car equivalent on Italian two line highways: a case study, Transport, 29(4): 449-456.
Dhamaniya, A.; Chandra, S. 2010. Concept of stream equivalency factor for heterogeneous traffic on urban arterial roads, Journal of Transportation Engineering, 139(11): 1117-1123.
HCM. 1965. Highway Capacity Manual- HCM Special Report, 87, Transportation Research Board, National Research Council, Washington, DC.
HCM. 2010. Highway Capacity Manual- HCM - Special Report, 209, Transportation Research Board, National Research Council, Washington, DC.
IRC. 1990. Guidelines for capacity of urban roads in plain areas. Indian code of practice. IRC: 106-1990.
Keller, E.L.; Saklas, J.G. 1984. Passenger car equivalents from network simulation, Journal of Transportation
Engineering, 110(4), pp.397-411.
Lee, T.C.; Polak, J.W.; Bell, M.G.H; Wigan, M.R. 2010. The Passenger Car Unit Values of Motorcycles at the Beginning of a Green Period and in a Saturation Flow. In Proceedings of the 12th World Conference on Transport
Research, 1-17.
Maini, P.; Khan, S.K. 2000. Discharge characteristics of heterogeneous traffic at signalised intersections. In
Proceedings of the 4th International Symposium on Highway
Capacity, Transportation Research Circular E-C 108, 258-270.
Ma l l i k a r ju na, C.H .; R ao, R .K . 2 0 0 6. A rea Occupancy Characterestics of Heterogeneous traffic,
Transportmetrica, 2(3) (2006): 223-236.
Radhakrishnan, P.; Mathew, T.V. 2011. Passenger car units and saturation f low models for highly heterogeneous traffic at urban signalized intersections,
Transportmetrica, 7(2): 141-162.
Rahman, M.; Nakamura, F.; Okura, I. 2003. Measuring passenger car equivalents (PCE) for large vehicles at signalised intersections, Journal of Eastern Asia Society for Transportation Studies, 5: 1223-1233.
Sumner, R.; Hill, D.; Shapiro, S. 1984. Segment passenger car equivalent values for cost allocation on urban arterial roads, Transportation Research Part A:
General, 18(5/6): 399-406.
Tiwari, G.; Fazio, J.; Gaurav, S. 2007. Traffic planning for non-homogeneous traffic, Sadhana, 32(4): 309-328.