367
Process to procession: visualising construction processes with procession’s 3d information visualisation
S. North
University College London, UK
Published as:
North, S. (2000): ‘Process to procession: visualising construction processes with procession’s 3d information visualisation’ in Product and Process Modelling in Building and Construction (the proceedings of ECPPM 2000, the third European conference on product and process modelling in the building and related industries, Lisbon, Portugal, 25th-27th September 2000), Gonçalves, Steiger-Garção and Sherer (eds.), The Netherlands: Balkema,
ISBN 90-5809-179-1, pp. 367-374.
ABSTRACT: The construction industry traditionally uses two dimensional visualisation techniques to analyse project progress. This usually takes the form of an ‘s-curve’, commonly generated by one of three performance measurement systems: earned value analysis, completion analysis or performance trend indices. Analysing project progress in this manner only provides ‘single view’ analysis of data trends. Deeper interpretation of a project might require studying many individual s-curves. Indicative patterns can go unrecognised in a mass of unfiltered data. This research delivers a conceptual, three-dimensional framework for the interpretation of non-physical construction industry processes. Procession is an information visualisation software tool based on this conceptual framework. It delivers a more comprehensive representation of project progress, as a three-dimensional data surface. Data is either exported from Microsoft Project or from a single project database environment, utilising STEP (Standard for The Exchange of Product model data). Procession is targeted at social housing project clients, providing an ‘at-a-glance’ indication of project ‘health’.
1 INTRODUCTION
The rationale for Procession’s three-dimensional framework for construction planning is suggested by previous work on multi-dimensional morphological frameworks, in the field of systems engineering
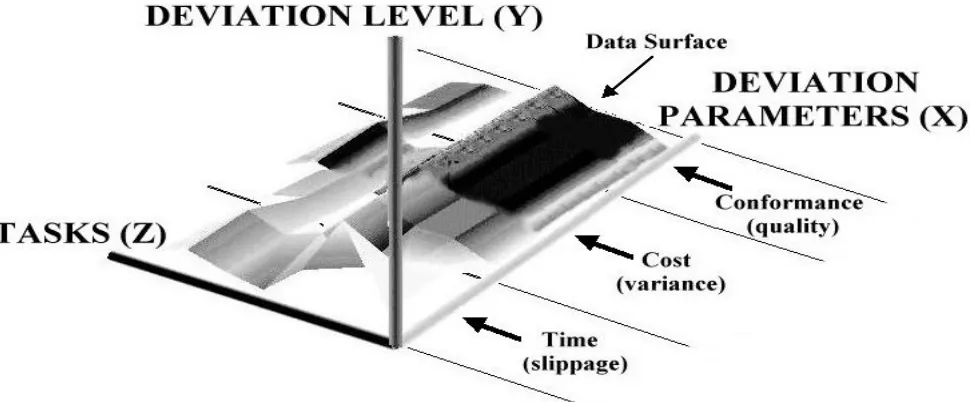
(Hall 1969 and Pohl 1994). Figure 1 shows the conceptual framework, with ‘deviation parameters’, ’deviation level’ and ‘tasks’ as its three dimensions (North 2000). Deviation level represents units of time or money, which deviate from the flat terrain of the project baseline.
368
The three framework dimensions map to Procession’s data surface, as follows:
• The X axis maps to the deviation parameters dimension
• The Y (height) axis maps to the deviation level dimension
• The Z axis maps to the tasks dimension.
The values for X and Z define a two-dimensional plane, with Y providing the height scalar values. Therefore, a project with no deviations from the project baseline will produce a flat data surface. Procession’s data surface is actually a ‘carpet plot’, generated by a scalar algorithm. The three dimensions are achieved from a two-dimensional set of points, which are warped in the direction of the surface normal. The amount of warping is controlled by the scalar value. The point set is determined by the three-dimensional framework’s ‘tasks’ and ‘deviation parameters’ dimensions. The scalar (or height values) are provided by the framework’s ‘deviation level’ dimension (see Fig. 1 A 3d framework for construction planning).
Procession is a stand-alone information visualisation application (Card et al. 1999 and Chen 1999) developed for the Microsoft Windows 95/98/2000/NT platform. It is capable of opening data files both from a local computer and from an Internet web server. Procession is an MDI (Multiple Document Interface) application, which is to say that it can have several visualisation windows open simultaneously. Procession was developed in the C++ language, utilising MFCs (Microsoft Foundation Classes).
Procession’s three-dimensional graphics functionality is provided by VTK (the Visualization ToolKit), an ‘open source’ system providing a C++ class library (Shroeder et al. 1998).
2 METHODOLOGY
Current research is focusing on the evaluation of Procession. The main aim of this is to determine
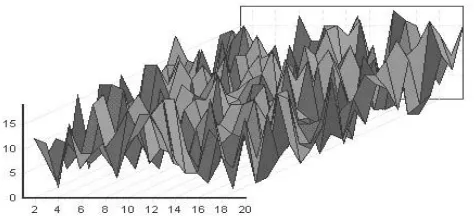
Figure 2. An example of a navigable 3d data surface, source: author.
whether clients perceive Procession’s progress reporting information to be more useful than currently utilised approaches. As a secondary aim, it is hoped that the evaluation will prove informative about the suitability of the conceptual three-dimensional framework. In order to evaluate Procession, comparative research will be conducted, making use of interview protocols and rapid prototyping. This evaluation is intended to determine a selected construction client’s level of satisfaction with the quality and format of the project progress information provided.
In order that Procession’s informational provision improves on the current model, a requirements capture stage is being undertaken. A planning data set has been obtained of a ‘live’ construction project. The researcher used this data as a skeleton to create simulated projects, with different sequences and outcomes. The purpose of this is to provide a testing ground for Procession, which must be unfamiliar to the construction client (there would be no motivation for information requests). The fictional project scenarios are based on a real nineteen-month project to refurbish flats and houses on an ex-local authority estate, in an inner-city area. The ‘live’ project objectives were: to provide new and clearly defined street patterns, to enlarge the individual gardens and to remove crime-ridden pedestrian routes. The total estate consists of five hundred and seventeen housing units (individual houses and flats). The ‘live’ project focuses on two hundred and fifty-two of these units (one hundred and twenty three houses and one hundred and twenty-nine flats).
Work on the houses will be conducted with most of the tenants in situ. A unique aspect of the project is the 'porch turnarounds' on the houses (Smit 1999). This entails making the back of the house into a new entrance porch. The houses are given enlarged back gardens by gains made from old pedestrian ways. The new front gardens have parking spaces. Flats receive basic internal refurbishment. For example: kitchen fittings, vinyl kitchen flooring and decorations. Extensive landscaping is being conducted on the estate’s communal areas. This includes turf laying, tree-planting, re-routing of gas mains and drains, new street patterns and improved estate lighting. Costs for the ‘live’ project were estimated from a construction industry standard pricing book (Davis et al. 2000). The total budgeted cost before the project started was estimated as £6,247,849 (see Fig. 3, ‘Live’ project summary task budgets before commencement).
369
Figure 3. ‘Live’ project summary task budgets before commencement, source: author.
‘unacceptable’ risks within the original budget and schedule. The two most serious risks were then used as a basis for ‘problematic’ issues, which were then fictionalised into the two scenarios. The identification of unacceptable risks was achieved using the risk analysis software tool Riskman Professional (see Sect. 3, Transforming raw project data into visual structures). When running through the research scenarios, construction clients taking the role of development workers will receive project progress reports at seven quarterly milestone intervals.
Each of the simulated projects has had quarterly milestone files produced, to represent each of the progress reports throughout the project. These files will be stored on the researcher’s laptop computer, in the CSV (Comma Separated Value) format. The milestone files compress a project of nineteen months into as many minutes. For this research, it has been decided that ‘real time’ simulation of a project is not practical. For example, a construction client’s need for information concerning the progress of ‘on-site’ projects is likely to make up a vital, but proportionally small part of their workload. As the requirement for this information may happen at unpredictable times, it does not seem a sensible use of resources to attempt direct observations of the construction client’s behaviour on a ‘live’ project.
The prototypes will be evaluated by several different construction client volunteers.
The interview questions will consider the quality of information provided by the construction clients’ current methods of progress reporting, allowing for later comparison with the prototypes. Construction clients will also be asked about their general familiarity with computers. After working with each prototype, construction clients will describe their perception of information quality. One protocol section will relate to functional aspects of the software prototype. Its purpose is to assess not the quality of the information that Procession presents, but the usability of the software. As such, reference will be made to standard guidelines for user-interface design.
370
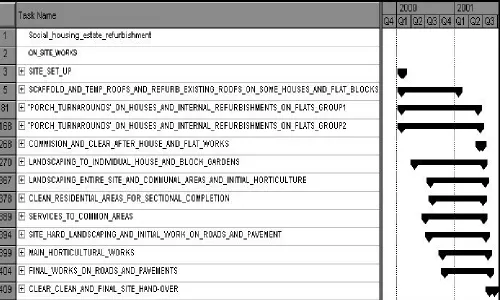
Figure 4. ‘Live’ project summary tasks and their scheduled durations before commencement, source: author.
3 TRANSFORMING RAW PROJECT DATA INTO VISUAL STRUCTURES
In Section 2, the overall evaluation methodology was introduced. This section will now discuss in more detail the transformation of the original ‘live’ project data into a visualisation format suitable for Procession. Early on in the research sequence, a decision had been made to make Procession compatible with the market-leader project management package, Microsoft Project. Therefore, the ‘live’ project data was obtained in this format. The original project durations, dependencies and schedule were left unchanged.
In project management terminology, ‘resources’ are the materials and labour costs assigned to a specific task. Resources had not been assigned to the tasks in the original file and so assumptions were made about example resources that could be applied (i.e. the sub-tasks, materials and labour required to achieve the stated tasks). As the durations were pre-determined, resources based on hourly paid rates were not applicable. Instead, the labour and material costs were obtained from an industry standard pricing book (Davis et al. 2000) and calculated on a per house, block or site basis. In the initial version of the project budget, sums were applied as ‘fixed cost’ resource elements. Testing revealed that Earned Value (see Sect. 4, Traditional performance
measurement) fields required for Procession seemed not to be functioning as expected when this approach was adopted (i.e. BCWS and BCWP values not present). Instead, a new baseline file was created with the ‘cost’ values cut and paste as ‘fixed costs’ directly attached to tasks (i.e. there were now no resources). Allocation of resources to tasks was done as units, rather than as a percentage. Number of available resource units was set to an arbitrary high figure (ten thousand), to make sure that sufficient were available. Each ‘fixed cost’ was set to ‘accrue at prorated’. ‘Actual Costs’ were calculated automatically by Microsoft Project. A ‘Baseline’ was saved. The baseline provides a record of all budget values before project commencement. These are then used for later analysis during the project lifecycle.
In order to generate possible scenarios from the data set, risk analysis (in the form of Monte-Carlo simulations) was applied to the Microsoft Project file. The Microsoft Project compatible software tool
Riskman Professional (see www.riskdriver.com/riskmantool/) was used to
identify potential project outcomes.
371
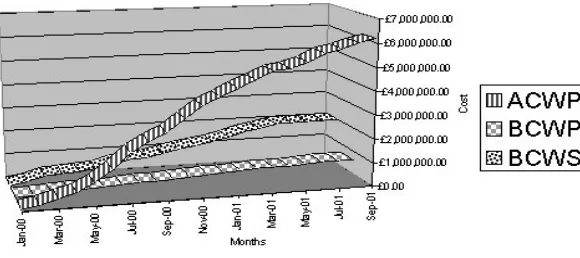
Figure 5. Scenario 1–entire project earned value s-curve, source: author.
Figure 6. Scenario 2–entire project earned value s-curve, source: author.
described during World War II’s Manhattan Project, Monte-Carlo simulations are now widely used, both in hard science and for predicting games of chance (CSEP 1995). Riskman uses Monte-Carlo simulations to analyse the likelihood and impact of specified risks. A project consists of tasks, related by precedence constraints (in project management terminology, a PERT network). In a simplified model, each task has a duration and a set of allocated resources. After completing a large number of simulation cycles, Riskman calculates each task’s criticality to successful project outcome. Riskman outputs its results as Microsoft Excel charts and in its customised Microsoft Project ‘Simulation View’. In the next section, this paper will go on to describe the results achieved when Riskman (and traditional project management visualisation techniques) were applied to the ‘live’ project data used for this research.
4 TRADITIONAL PERFORMANCE MEASUREMENT
The traditional method for reporting on project
progress is the s-curve. This is generally utilised to analyse performance against budget in one of three ways. Most common of the three is ‘earned value analysis’ (see Figs. 5-6). This provides the budgeted cost of completing the tasks actually finished at an observation point. This sum is the ‘earned value’. Comparing this with the amount actually spent, is a good indicator of project performance. There is an acronym for each of the three curves plotted against each other for earned value analysis (Forsberg et al. 1996):
• ACWP (Actual Cost of Work Performed. Actual cost of performing the completed tasks)
• BCWS (Budgeted Cost of Work Scheduled. The planned budget for the scheduled tasks)
• BCWP (Budgeted Cost of Work Performed. The planned budget for the tasks that were actually completed- the earned value).
372
Figure 7. Scenario 1–entire project completion cost s-curve, source: author.
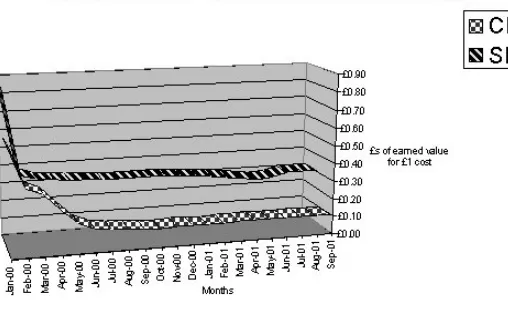
Figure 8. Scenario 1–entire project performance s-curve, source: author.
In Completion Cost analysis (see Figs. 7 and 9), an s-curve plots three lines against each other to compare the original budgeted cost of the project and the revised cost, from the point of observation. There are three acronyms for these curves (Forsberg et al. 1996):
• BAC (Budget At Completion. The planned budget)
• EAC (Estimate At Completion. The cost at completion revised as project progresses)
=ACWP+((BAC-BCWP) x (ACWP/BCWP))
• ETC (Estimate To Complete. The cost required to complete the project as at time ‘T’)
= (BAC-BCWP) x (ACWP/BCWP).
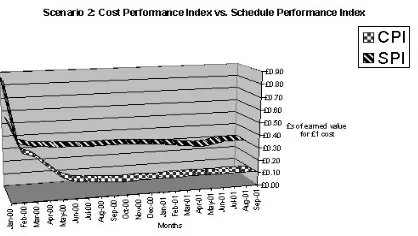
Performance Indices provide a third approach to progress analysis. In this method, two curves are plotted (see Figs. 8 and 11). One represents cost and the other schedule. For both plots, a flat horizontal line at £1 indicates that £1 expended is earning £1 of completed project. Values below £1, suggest that the project is either over-budget or behind schedule. In addition to providing ‘to date’ progress, the performance indices also indicate the underlying
future trends in the project. The two curves represent:
• CPI (Cost Performance Index)
= BCWP/ACWP
• SPI (Schedule Performance Index) = BCWP/BCWS.
5 CONCLUSION
The Monte-Carlo simulations revealed two summary tasks which were categorised as having attached risks of an ‘unacceptable’ level. The first of these was the summary task ‘scaffold and fit temporary roofs, refurbish existing roofs on some houses and flat blocks’ (see Figs. 3-4) which had the following unacceptable risks associated with it:
• Constraints on availability of external scaffolding components, impact the whole product
• Requirements provided to scaffolding subcontractors are ambiguous
373 • Sub-contracted scaffolding task is badly managed
and followed up
• Workloads were under-estimated to gain contract.
• Required security level for the project is higher than usual because some tenants are remaining in occupation. Organisation of key access to occupied properties becomes expensive and time-consuming
• Project is innovating in its field (porch turnarounds- see Sect. 2).
The second identified summary task was ‘site hard landscaping and initial work on roads and pavements’ (see Figs. 3 and 4), which had the following unacceptable risks associated with it:
• Feasibility study on impact of road and service re-routing is missing
• There is a low awareness of possible technical problems
• When estimating costs, some activities are not quantifiable or have no reference in archived projects
• Project risks were not assessed or are difficult to assess
• Economical and political context has an influence on project and can be changed by unilateral decision at a high level. This particular project has to take particular regard of tenant opinion
• Project environment is evolving
• Technical difficulties are a real challenge
• Detailed assessments of cost and time scale are not compatible with project budget and schedule. Planning does not take into account this fact and relies on false hypotheses.
The two unacceptable risks were fictionalised into scenarios (with embedded ‘problematic’ issues). In scenario 1, the scaffolding sub-contractor failed to remove house scaffolding according to schedule, extending the duration of the roofing tasks and delaying the commencement of the porch turnaround work by almost three months. Scenario 2 sees the estate vehicle access restricted and most of the tenants remaining in residence. When the initial work on roads and pavements began in the third quarter, the situation became unmanageable. All works relating to the communal estate areas (roads, pavements, hard landscaping and horticulture) started to slip and their durations extended. As discussed in the last section, traditional visualisation techniques were used to analyse the entire sequence. A series of two-dimensional s-curves were produced. BAC (Budget At Completion), EAC (Estimate At Completion) and ETC (Estimate To Complete) were plotted against each other up to
milestone 7, as a cost/time s-curve. The expected total cost of the project (before it started) was £6,247,849. By the end of scenario 1’s planned project time-scale, £6,169,170.78 had been spent and in order to complete (behind schedule), an additional £14,533,790.31 was required. The total project cost would then have spiralled to £20,781,638.82 (see Fig. 7). In scenario 2, 100% of the £6,247,849 predicted costs had been spent by the end of the planned project time-scale and in order to complete (behind schedule), an additional £56,751,522.90 was required. The total project cost would then have spiralled to £62,920,693.68 (see Fig. 9).
CPI (Cost Performance Index) was plotted against SPI (Schedule Performance Index) as an s-curve to identify trends within the project progress. For scenario 1, the CPI and SPI showed that both the schedule and the budget trends were deteriorating rapidly before the first milestone. In the second quarter, both budget and schedule stabilised. By the third milestone, a slight improvement was seen in both curves, however they quickly dipped back and continued at approximately £0.30 for the rest of the schedule. At completion, the project was equally behind schedule and over budget (see Fig. 8). Scenario 2 saw both the schedule and the budget plans deteriorating rapidly before the first milestone. In the second quarter, the budget stabilised, while the schedule continued to slip. By the third milestone, the schedule was stabilising and it continued to mirror the budget curve, with a differential of approximately £0.20. This continued until the scheduled completion date, with only a slight budget recovery in the last quarter. At completion, the project was still very behind schedule and over budget. The final CPI value reveals that £0.10 of value was being earned for every £1 spent (see Fig. 10).
374
Figure 9. Scenario 2–entire project completion cost s-curve, source: author.
Figure 10. Scenario 2–entire project performance s-curve, source: author.
(BCWS) levelling out to match a longer time-scale. Despite slow improvement through the sequence, the earned value (BCWP) was so low compared with the ACWP, that the situation became irretrievable (see Fig. 6).
The sequence outcome for scenario 1 was:
• Project had run out of time and budget to complete. No cost overruns had been incurred to date but more funds would be required to continue.
The sequence outcome for scenario 2 was:
• Project had run out of time and budget to complete. No cost overruns had been incurred to date but funds totalling many times the original budget would be required to continue. Finally, two sets of seven milestone Microsoft Project files were generated, one for each scenario. To simulate progress at each milestone, changes were made to the tasks, in terms of their durations and percentages complete. For each scenario, it was necessary to work through the milestone files chronologically. This is because Microsoft Project always passes revised estimates onto the next milestone in the sequence. CSV data files for Procession were exported from each of the Microsoft Project milestone files (i.e. fourteen files total). In the next stage of the research, construction
clients will apply the Procession initial prototype to the scenario milestone files.
6 ACKNOWLEDGEMENTS
This work was supported by VIRCON (The VIrtual CONstruction Site) a collaborative project between University College London, Teeside University, The University of Wolverhampton and eleven construction companies, funded by EPSRC award number GR/N000876.
The author wishes to thank Dr Graham M. Winch for his advice and guidance in the course of this research.
7 REFERENCES
Card S.K., Macklinlay, J.D. & Shneiderman, B 1999. Readings in Information Visualization- using vision to think. USA: Morgan Kaufmann. Chen, C. 1999. Information Visualization and
Virtual Environments. USA: Springer-Verleg. CSEP, “Introduction to monte-carlo methods”, The
Computational Science Education Project, http://csep1.phy.ornl.gov/CSEP/MC/MC.html, USA, 1995.
Davis, Langdon and Everest, Spon's Architects' and Builders' Price Book, one hundred and twenty fifth edition, Davis Langdon & Everest (Editors), E. & F.N. Spon, UK, 2000.
Forsberg, K., Mooz, H. & Cotterman, H. 1996,
Visualizing Project Management. USA: John Wiley & Sons.
Hall, A.D. 1969. Three-dimensional morphology of systems engineering. IEEE Transactions on System Science and Cybernetics. SSC-5(2): 156-160.
North, S. 2000. Procession: using intelligent 3d information visualisation to support client understanding during construction projects in R.F. Erbacher, P.C. Chen, J.C. Roberts & C.M. Wittenbrink (eds), Visual Data Exploration and Analysis VII: 356-364.
Pohl, K. 1994. The Three Dimensions of Requirements Engineering: A Framework and Its Applications. Information Systems. 19(3): 243-258.
Shroeder, W., Martin, K. & Lorensen, B. 1998.
The Visualization Toolkit. Prentice Hall: USA. Smit, J. 1999. Reclaiming the backlands. Building