Master on Telematics Engineering
Academic Course 2014-2015
Master Thesis
“Tools for a Multi-Controller SDN Architecture”
Author:
Sergio N. Tamurejo Moreno
Director:
Carmen Guerrero L´opez
Legan´es, 10th of September 2015
Keywords:Software Define Network, controller lock-in, SDN architecture, Logger, Profiler, Model Checker.
Tools for a Multi-Controller SDN Architecture
Sergio N. Tamurejo Moreno
Universidad Carlos III de Madrid IMDEA Networks Institute Email:[email protected]
Abstract—Software Define Network (SDN) is a recent paradigm based on the separation between the data plane and the control plane, allowing to handle the traffic network by means of software. The SDN ecosystem is fragmented due to the multitude of different controller platforms. This creates a danger of a controller lock-in for SDN application developers and for SDN network operator. In order to tackle this problem an innovative architecture is presented whose aim is to execute SDN applications written for different controller in an unique network. This architecture presents an important problem to debug and analyze the SDN network. Therefore, a set of tool is design and developed with the purpose of solving this limitation and guarantee the proper operation of the network. Three of these tools are detailed in depth, a logger which displays the messages that cross the architecture, a profiler that shows information of the applications and parameters of the network and a model checker whose main task is to validate important properties of the network such as assure that there are no black holes.
I. INTRODUCTION
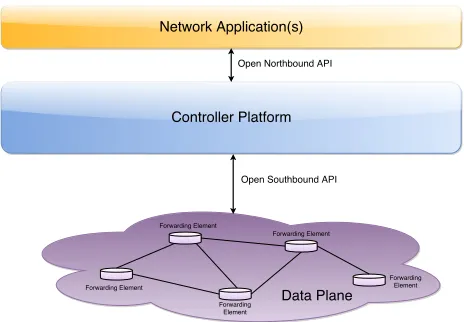
Software Defined Network (SDN) is an emerging paradigm which stands as the key to solve the limitations and difficulties of the current networks which has the data and control planes vertically integrated [1]. Its control plane (responsible of the logic that handles the traffic) and data plane (whose task is forwarding traffic according to the logic established by the prior plane) are bundled in the same forwarding element. Therefore, to introduce a protocol in this type of networks, each device must be configured individually.
SDN allows the separation between the control plane and the data plane, giving rise to a logical entity called controller, which implements into the underlying forwarding elements the necessary logic to handle the traffic of the network. Hence, the switches forwards the incoming packets according to the rules installed by that controller. If a switch do not have a rule for a packet, the packet will be sent to the controller and this logical entity will notify to the device what to do with it (drop the packet or forward the packet).
The separation between both planes can be realized by means of a well-defined programming interface between the forwarding elements and the SDN controller. The most notable example of such an API is OpenFlow [2]. The main advantages the SDN paradigm provides are: flexibility, simpler network management and faster evolution and innovation of the net-work [3]. In Fig.1 is represented the infrastructure of a SDN network.
Fig. 1. Software Defined Network Infrastructure
The impact of this new technology has been of great importance. It began as an academic experiment and has become (in just a few years) in one of the best embraced paradigms by industry. In fact, some of the biggest companies such as Google, Facebook, Yahoo, Microsoft, Verizon and Deutsche Telekom founded the Open Networking Foundation (ONF)[11] with the aim to promote and adopt SDN through open standards development.
Nowadays, SDN paradigm is considered as a researching spotlight and a lot of work is being carried out by industry and academia. This effort of the networking community has re-sulted in a wide variety of open and closed-source controllers, e.g., Opendaylight [4], Ryu [5], Pox [6], Nox [7], etc. (Each one has its own programming model, execution model and capabilities). This has led to a fragmented control plane, that forces to network application developers as well as to network operators, to choose one control platform, which is a hard decision since all have their strengths and weaknesses.
Controllers communicate to an unique controller (known as ’Server Controller’), responsible for the communication with the underlying Network Elements. This platform is denom-inated ’NetIDE architecture’ and has been designed by the consortium of the FP7EU Project NetIDE [8] and described in detailed in [9].
Nevertheless, the NetIDE architecture presents one impor-tant issue that must be solved. How a network deployed using this platform can be debugged, since a bug in a SDN network application could suppose an Achilles heel to the performance of the whole network. Therefore, the main contribution in this paper is a set of tools which is completely integrated in the platform and whose purpose is diagnose, debug and troubleshoot a SDN network ensuring its properly operation.
The following section II introduces the design principles of the architecture. Section III presents a toolset for the proposed architecture. Section IV provides an overview of the state of the art. In section V open issues and relevant future directions are discussed. Section VI summarizes the main conclusions.
II. NETIDE ARCHITECTURE
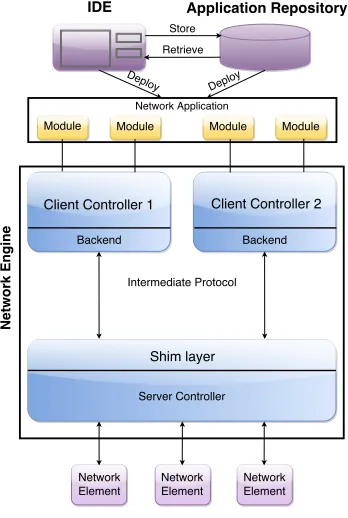
The NetIDE Architecture is depicted in Fig.2, which is breakdown in three layers: (i) the Integrated Development Environment (IDE) (ii) the application repository which stores simple modules and composed applications and (iii) the Net-work Engine, where controllers and applications are executed.
Fig. 2. The NetIDE Architecture
The IDE is basically composed by several code editors that support different network programming languages and
a particular graphical editor to create topologies. It reads modules and applications from the repository and also can do the reverse path (writing applications and modules to it). Finally, the IDE is able to deploy those applications on the Network Engine to be executed. Similar to the architecture, the Network Engine is structured in layers, specifically in two. In the upper layer are the Client Controllers which will run their respective modules or applications. In the bottom layer a unique Server Controller will be the responsible of talking directly to the underlying data plane.
The main challenge lies in the communication between the Client Controller layer and the Server Controller layer. The upper one, must be able to transmit all the messages generated by the network applications to the bottom layer and vice-versa. This task is not trivial, due to the client’s South-bound interfaces (SBI) do not match with the server’s North-bound interfaces (NBI). Hence, there is a need of an intermediate protocol which make feasible the intercommunication between the above layers. To solve this issue, we develop two different modules, the former called ’Backend’ integrated in each of the Client Controllers and the latter denominated ’Shim layer’ incorporated to the Server Controller. These modules speak the same protocol and the interaction becomes possible.
A. Intermediate Protocol
The Intermediate Protocol covers three essential needs for the intercommunication between the Client Controller layer and the Server Controller layer. (i) Transport control messages between Backend and Shim layers, e.g., to start up/take down an application or a particular module fixing a unique identifier for each of them. (ii) Carry event and action messages between Backend and Shim layers and demultiplex properly those messages to the right modules or applications according to the unique identifier fixed previously. And finally, (iii) encapsulate messages specific to a particular SBI protocol version (e.g., OF 1.X, NETCONF, etc.) towards the Client Controllers with proper information to recognize these messages as such.
In the first prototypes of the Network Engine, we leveraged the Pyretic Protocol [10], although it was very useful to accom-plish some preliminary proofs of concepts, its current version limits the functionality of the network applications running on top of the Engine Network, due to this protocol only supports a restricted subset of OpenFlow v.1.0 messages. Therefore, a new intermediate protocol was implemented from scratch. This new protocol uses TCP as transport and encapsulates the payload with the following header:
0 1 2 3
0 1 2 3 4 5 6 7 8 9 0 1 2 3 4 5 6 7 8 9 0 1 2 3 4 5 6 7 8 9 0 1 +-+-+-+-+-+-+-+-+-+-+-+-+-+-+-+-+-+-+-+-+-+-+-+-+-+-+-+-+-+-+-+-+
| netide_ver | type | length |
+-+-+-+-+-+-+-+-+-+-+-+-+-+-+-+-+-+-+-+-+-+-+-+-+-+-+-+-+-+-+-+-+
| xid |
+-+-+-+-+-+-+-+-+-+-+-+-+-+-+-+-+-+-+-+-+-+-+-+-+-+-+-+-+-+-+-+-+
| module_id |
+-+-+-+-+-+-+-+-+-+-+-+-+-+-+-+-+-+-+-+-+-+-+-+-+-+-+-+-+-+-+-+-+
| |
+ datapath_id |
| |
Where netide_veris the version of the NetIDE protocol,
length is the total length of the payload in bytes and
typeindicates the type of the message (e.gNETIDE_HELLO,
NETIDE_OPENFLOW, etc.).datapath_idis a 64-bits field that uniquely identifies the Network Elements.module_idis a 32-bits field that uniquely identifies the application modules running on top of each Client Controller. The composition mechanism in the core leverages on this field to implement the correct execution flow of these modules. Finally,xidis the transaction identifier associated to the each message. Replies must use the same value to facilitate the pairing.
III. TOOLS
In the architecture exposed before, exist two well differen-tiated classes of tools. The first one, groups all the set of tools whose purpose is to provide resources and facilities to the user for designing, creating and deploying a SDN network, whilst the second group aims to debug, inspection and diagnose the deployed network. The first class encompasses three essentials tools which are summarized in Table I:
Tool Functionality Topology
Editor
Graphical editor to create and modify network topologies.
Network Program-ming Language Editors
The editors to implement network applications sup-port several programming languages as Python for Pyretic, POX and Ryu controllers; or C/C++ for NOX controller or Java for Floodlight, Beacon and OpenDaylight controllers.
Deployment Configura-tion
User interface in which developers can choose a previously specified topology model and the users can choose a platform and the path of the network application code for each controller in the topology model.
TABLE I
TOOLS FOR DESIGNING AND DEPLOYING ASDNNETWORK
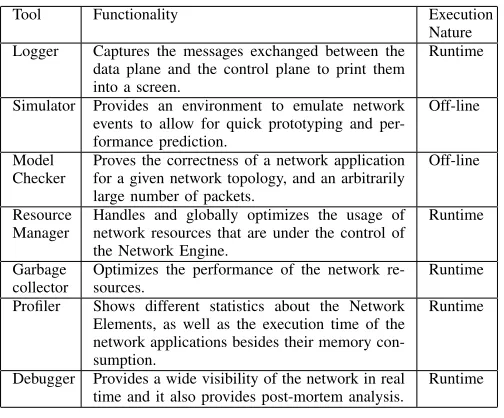
The goal of the diagnosing set of tools is to provide a frame-work that enables the developer to systematically test, profile and troubleshoot the SDN network, besides tuning the network applications. The first efforts to achieve this objective in the project are focused on identifying the different tools needed in Software Defined Networking (SDN) environments. Currently, we have identified the following categories: Logger, Simulator, Model Checker, Resource Manager, Garbage Collector and Proler. A taxonomy of the tools according to its functionality and its execution nature, is presented in Table II.
The Execution Nature field only can take two values,
Runtime or Off-line depending on the moment the tool is executed. If the tool is executed when the SDN network is deployed and the Network Engine is running then we refer to it as Runtimetool. However, if the tool needs to be executed without being the Network Engine working, then the tool will be categorized as Off-line. The Functionalityfield provides a briefly description of the utility of each tool.
In the subsections III-A, III-B and III-C a detailed analysis will be made about the Logger, Profiler and Model Checker tools, respectively.
Tool Functionality Execution Nature Logger Captures the messages exchanged between the
data plane and the control plane to print them into a screen.
Runtime Simulator Provides an environment to emulate network
events to allow for quick prototyping and per-formance prediction.
Off-line Model
Checker
Proves the correctness of a network application for a given network topology, and an arbitrarily large number of packets.
Off-line Resource
Manager
Handles and globally optimizes the usage of network resources that are under the control of the Network Engine.
Runtime Garbage
collector
Optimizes the performance of the network re-sources.
Runtime Profiler Shows different statistics about the Network
Elements, as well as the execution time of the network applications besides their memory con-sumption.
Runtime
Debugger Provides a wide visibility of the network in real time and it also provides post-mortem analysis.
Runtime TABLE II
TOOLS FOR DIAGNOSING AND DEBUGGING ASDNNETWORK
A. Logger
This tool captures the messages exchanged between the data plane (Network Elements) and the control plane (Client Controller, where a network application is executed) and print these messages into a screen, allowing to the user to visualize and filtering them accordingly to the type of message. It is based on RabbitMQ (a description of this technology is detailed in the Appendix). The Shim layer is modified to include a module that queue the messages required by the tool. In this specific case, those messages are all the ones that the Shim layer intercepts. The software architecture of the tool and its integration within the overall architecture are detailed as follows and illustrated in Fig.3.
The LogPubmodule, integrated inside the Shim layer, is responsible of intercepting all the messages that arrive to the Shim layer (i.e. the messages exchanged between the Networks Elements and the Client Controller), replicating them and sending back to the broker element. The second module called
Logger, will retrieve the messages kept in the broker and will print them in a terminal.
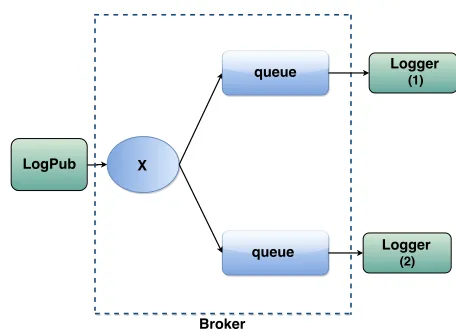
The Fig.4 represents two instances of the second module,
Logger (1) andLogger (2), which are consuming the messages kept in the broker and sent by theLogPub. Firstly, the first module establishes a connection with the RabbitMQ server (Broker) and captures the messages in order to send them to theExchangeelement (calledXin Fig.4). This new element is in charge of knowing what to do with the messages. In our case, it has been configured for sending the messages to the different queues depending on the type of message that the user wants to visualize. If there is no consumer (an instance of Logger module running) there will not be any queue, hence the Exchange element will drop the messages received. Finally, the second module (Logger) retrieves the messages of the queues and print them in a terminal. The user has the possibility to choose what kind of message wants to observe. There are two types of messages,inorout. The former, are messages sent by the Network Elements to the Client Controller and they are represented in green color. The latter, are the messages which do the reverse path (from the controller to the network) and are represented in yellow.
Fig. 4. Communication between LogPub and Logger
To simplify the complexity and limit the development of the tool in time, we started the practical work with a restricted version of the architecture. In particular, we made the follow-ing assumptions: (i) a sfollow-ingle Client Controller scenario. (ii) The development has been performed for Ryu Shim layer.
In Fig.5, is represented the outcomes obtained when the Logger tool is running. The image displays the messages sent from the data plane to the controller (in green) and from the data plane to the controller (coloured in yellow). The structure
of the messages depicted in the image is the following: the first field is a timestamp to know when the packet was sent, next information provided in the message is the direction of the message (to the controller or to data plane). The last one, is the content of the message.
Fig. 5. Logger outcomes
B. Profiler
The Profiler tool is used to analyze programs, providing to the user relevant statistical information, such as the execution time of various parts of that program or the consumed RAM memory.
The Profiler has followed two different approaches. The first one (Application Profiler), is based on the classical behavior of the tool (described above). It is able to provide the execution time of the functions of the analyzed software. Exist two options, analyze only one SDN application or analyze all the applications which are being executed plus the controller framework. Moreover, the Application Profiler provides the memory consumption of the Client Controller and the executed applications. The second approach called Network Profiler
focuses on the network and offers statistics of the forwarding elements (number of rules installed by the controller and number of removed rules).
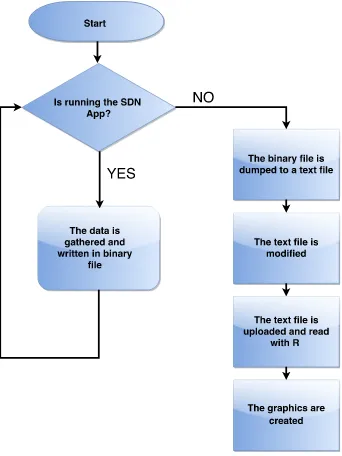
1) Application Profiler: To accomplish the development of the first approach, two assumptions have been established: (i) The Client Controller is a Ryu controller, (ii) Only one applica-tion is executed. Moreover, we have used two different Python modules, one called cProfile for obtaining the execution times of the methods and other denominated memprof for getting the memory usage of the profiled functions. The logic process for obtaining the execution times of different methods is depicted below in Fig.6.
While the SDN application is being executed, we gather relevant data. Once the execution has stopped, the information contained in the binary file is dumped to a text file. This new file is processed and read with a software for statistical computing and graphics. Finally, three graphics are generated to show the outcomes. The procedure to get the memory usage is identical.
Fig. 6. Aplication Profiler flowchart
Fig.7 and Fig.8 are graphics obtained with the Profiler tool after having obtained data from the execution of the controller plus the SDN application.
0 10 20 30 40
0 100 200 300
Execution Time (seconds)
Number of functions 0
10 20 30 40
Number of functions
Fig. 7. Function histogram
Fig.7 is an histogram and represents the amount of functions that share the same execution time. For instance, there are approximately about forty two functions with execution times closed to zero seconds and about ten functions which take longer than 300 seconds.
In Fig.8 it is displayed the execution time of the sixty functions that consume more time when are executed. In abscissa axis are specified the names of those functions.
0 100 200 300 app_manager .p y:24(<module>) cfg.p y:13(<module>) cfg.p y:17(<module>) cfg.p y:316(<module>) collections .p y:288(namedtuple) controller .p y:138(_recv_loop) controller .p y:218(ser v e) controller .p y:23(<module>) controller .p y:302(datapath_connection_f actor y) controller .p y:68(__call__) controller .p y:72(ser v er_loop) epolls .p y:61(do_poll) greenio .p y:187(_tr ampoline) greenio .p y:206(accept) greenio .p y:306(recv) greenthread.p y:212(main) handler .p y:108(register_ser vice) hub .p y:118(ser v e_f ore v er) hub .p y:17(<module>) hub .p y:318(r un) hub .p y:438(fire_timers) hub .p y:84(joinall) {__impor t__} __init__.p y:124(tr ampoline) __init__.p y:17(<module>) __init__.p y:1(<module>) __init__.p y:6(<module>) __init__.p y:99(<module>) inspect.p y:1026(getouterfr ames) inspect.p y:1053(stack) inspect.p y:25(<module>) log.p y:17(<module>) manager .p y:19(<module>) manager .p y:59(main) {map} {method 'enab
le' of '_lsprof
.Profiler' objects}
{method 'poll' of 'select.epoll' objects}
{method 'switch' of 'greenlet.greenlet' objects}
ofp_e v ent.p y:19(<module>) ofproto_protocol.p y:17(<module>) poll.p y:76(w ait) profiler .p y:5(profiled_func) re .p y:188(compile) re .p y:226(_compile) request.p y:1(<module>) simple_switch.p y:58(_pack et_in_handler) sre_compile .p y:178(_compile_charset) sre_compile .p y:32(_compile) sre_compile .p y:478(_code) sre_compile .p y:493(compile) sre_parse .p y:301(_parse_sub) sre_parse .p y:379(_parse) sre_parse .p y:675(parse) thread.p y:36(__thread_body) timer .p y:53(__call__) tok eniz e .p y:23(<module>) types .p y:13(<module>) types .p y:20(<module>) wsgi.p y:17(<module>) wsgi.p y:1(<module>) Function Name Ex
ecution Time (seconds) 0
100 200 300
Seconds
Fig. 8. Execution time of functions
In both figures, there is a legend in the right side. It specifies the units and the range of values that ordinate axis can take. With these outcomes, the user can know whether or not is necessary a code optimization in the SDN applications that are executed in the SDN network.
2) Network Profiler: In this approach it is assumed that the Server Controller is a Ryu controller. Similar to the Logger, a module denominated ProfPub is added to the Shim layer which captures the messages denominated flow mod. Those messages are sent by the controller to remove or install rules in the switches. Once captured, the messages are parsed and it is possible to identify if the content is for installing a rule or for removing it. Therefore, two counters are implemented one for installed rules and the other for removed rules. With this procedure we know the amount of rules installed and removed in the switches.
A second module called Network Profile accesses to the aforementioned counters, read them and print the information into a screen. This method offers outcomes in real time while the SDN network is running.
C. Model Checker
Model Checking is an automatic verification technique for finite state concurrent systems. It automatically provides com-plete proofs of correctness. A model checker systematically explores all possible ways to execute a program (as opposed to testing, which only executes one path depending on your input data).
The process for model-checking a software consists on three main steps:
• Modelling: converts the system into a formalism. For
example, a state diagram. It is necessary to identify all the system states and the transitions from one to another.
• Specification: Determine the correctness properties to be
• Verification: validates the correctness properties in the modelled system and offers the outcomes obtained (whether or not the property is fulfilled in the system). The main advantage of this tool is that all possible cases are contemplated, so the outcomes obtained are absolutes, which means that if the property no loops in the system has been validated, the network will never have a loop. Therefore, we consider it as a tool needed for a SDN network, due to it allows to validate important properties of a network before deploying it.
The most pronounced disadvantage in this technique is the State Space Explosion problem. It consists on having a huge state space, therefore the validation of a property would suppose a high complexity and computationally would be inordinately costly.
This issue always appears in SDN networks, because the behavior of a SDN network application depends on many factors: the end-host applications sending and receiving traffic, the switches handling the incoming packets, installing rules and generating events (which are sent to the controller). All of them affect the program running on top of the controller leading to endless possibilities (states with transitions). Con-sequently, we consider that develop a Model Checker for validating properties in SDN Networks from scratch is not feasible.
The solution adopted was to study in depth a Model Checker already created and integrate the tool to this project. Very few such tools have been developed. Nevertheless, there is a interesting open source project called NICE which provides a model checker for old NOX controller [12].
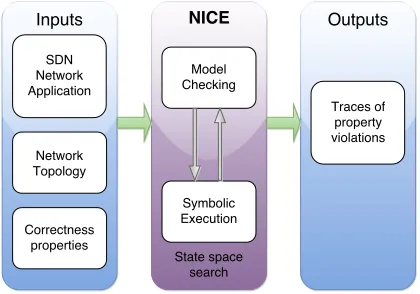
NICE addresses the State Space Explosion issue by mean of the Symbolic Execution Engine. They consider that the event handlers of the SDN application are the key to explore the whole state space. These handlers must be triggered in order to exercise all different code paths. Hence, the first option is explore all possible inputs for triggering them (which it does not scale) and the second option is to identify the packets that trigger these events (Symbolic packets) and feed the network with them. This task is performed by theSymbolic Execution Engine. The Fig.9 represents the structure of NICE tool.
Fig. 9. NICE tool structure
Given a SDN network application, a network topology and the correctness properties to be validated, ‘NICE performs a state space search and outputs traces of property violations’ [12].
A research is being carried out to adapt NICE to other controllers platforms. The accomplished work has been the creation of a simple SDN application for old NOX controller and the execution of NICE tool with this input. The future work is to create an UML diagram of the entire tool in order to understand properly how it works and find out which is the next step to migrate NICE to Ryu controller.
IV. RELATEDWORK
One of the main purposes of this project is to allow the com-position of SDN network applications with software modules implemented for different SDN controllers. In this context, few solutions have been proposed. Two of the most relevant contributions in this field are FlowVisor and OpenVirteX [13], [14] which are network hypervisors that split the traffic into slices. Each slice manages its traffic by mean of a network application. Both of them suppose an important advance, improving the security and flexibility of the network due to the integration of various controller operating at the same time. Moreover, these projects offer to multiple tenants to share the network. However, the network applications of each slice cannot cooperate to process the same traffic, so it is similar to have different networks manage each one by a unique controller.
Flowbricks [15], is another SDN hypervisor that integrates heterogeneous controllers using only the standardized con-troller to switch communication protocol. The most flagrant point of this project, is that it only runs on emulated environ-ments and not over standard network hardware.
Therefore, other of the most important objectives in this project is the provision of a varied toolset for debugging, diagnosing and troubleshooting the SDN network. We briefly describe and analyse similar efforts in this area, such as NetSight [18] which includes different tools such as: an interactive network debugger, a live network monitor, a logger and a hierarchical network profiler. NetSight assembles packet histories using postcards, event records sent out whenever a packet traverses a switch. This approach decouples the fate of the postcard from the original packet, helping to troubleshoot packets lost down the road, unlike approaches that append to the original packet. Each postcard contains the packet header, switch ID, output port, and current version of the switch state. Combining topology information with the postcards generated by a packet, NetSight can reconstruct the complete packet history: the exact path taken by the packet along with the state and header modifications encountered by it at each hop along the path. NetSight is developed in C++, it focuses on the following controller frameworks: NOX [7], POX [6] and RipL-POX [19], but it does not specify the OF versions supported. NICE [12] is a powerful model checker whose objective is uncover bugs in SDN network applications. To reach this goal, they propose a tool that combines model checking and symbolic execution. Given a SDN network application, a SDN network topology and the properties to be checked (e.g., assure no loops in a SDN network) performs a space search and shows traces of property violations.
[20] is a publication that proposes another Model Checker for SDN networks. The correctness properties they want to validate with this tool are: loop freedom (a packet does not loop back to a switch which it has already visited) and no invalid drop (a packet is not dropped due to an invalid controller update to some switch). They use the Abstraction Method to address the scalability problem. This technique keeps only one packet in the system, and provokes network updates, injecting packets (whose header values are arbitrary) directly into the ports of the switches.
V. FUTUREWORK
The preliminary tests performed have produced positive outcomes. It suggests that the proposed architecture in this paper can be a viable solution for tackling the issue of application portability across different SDN control platforms. Nevertheless, there is a great room for enhancement. One of the main problems found in the architecture is to guarantee the applications running on top of the controller do not collide one with other. A mechanism should avoid the installation of incompatible rules in the switches. To address this problem, a new architectural element has been proposed to be introduced within the overall architecture, the Core Layer. This layer is placed between the Backend and the Shim layer. Its main task is to provide the necessary logic for the coexistence of the SDN applications.
A SDN network deployed with our architecture could have a bigger delay in the communication between data plane and control plane than a conventional SDN network, due
to the integration of heterogeneous controllers which must be interconnected. Therefore, performance tests are being performed to verify that this extra delay is insignificant and does not harm to the behavior of the SDN network. Other important drawback is the possible incompatibility between some Client Controllers and some Server Controller. If the client possesses a different version of the OpenFlow protocol that the version supported by the Server Controller exits a conflict and it is impossible to interconnect them. To solve this last problem, we are trying to find the commonalities between different versions of OpenFlow.
The impact of all the future modifications in the NetIDE Architecture will be analyzed and the tools will be adapted and integrated into the new architecture.
The provided toolset has some shortcomings that must be solved. For instance, the ‘Runtime’ tools detailed in depth: the Logger and the Profiler have been developed for Ryu controller platform. So, both tools have to be adapted for the rest of the controllers. With the Core element described previously, this adaptation would be much easier.
All the tools that are fed with messages exchanged between the two planes, should capture those messages from the Core layer instead of the Shim layer module of each Server Controller. So only one development would be needed instead of one development for each controller.
Regarding to the tools presented in subsections III-A, III-B and III-C some improvements have been proposed.
In the first case, a new filter will be implemented. This filter allows to the user, choose the type of openflow message wants to visualize (flow mod, packet out, port mod, etc.). The graphic that the Profiler generates to show the memory consumption is not updated while the tool is gathering the data. So the next step is provide a ‘real-time’ graphic that is updated at the same time the data is collected. The model checker suggests various open issues. This tool can guarantee that one SDN application does not provoke loops or black holes in a given network, but it can not assure that a set of applications fulfil that property. Another issue is the high execution time of model checker when the topology provided to the tool is composed of several elements. Besides, some controllers have mechanisms to avoid loops in the network, so one of the main utilities of model checker tool is satisfied.
VI. CONCLUSIONS
Based on fact that this architecture has been implemented in a real prototype, the work presented in this paper is a feasible solution to address the problem of supporting SDN applications written for different controllers within the same SDN network. Moreover, the set of tools provided allow to debug, diagnose and troubleshoot the network.
REFERENCES
[1] Kreutz, D., Ramos, F. M., Esteves Verissimo, P., Esteve Rothenberg, C., Azodolmolky, S., Uhlig, S. (2015). Software-defined networking: A comprehensive survey. proceedings of the IEEE, 103(1), 14-76. [2] McKeown, N., Anderson, T., Balakrishnan, H., Parulkar, G., Peterson,
L., Rexford, J., ... Turner, J. (2008). OpenFlow: enabling innovation in campus networks. ACM SIGCOMM Computer Communication Review, 38(2), 69-74.
[3] Kim, H., Feamster, N. (2013). Improving network management with software defined networking. Communications Magazine, IEEE, 51(2), 114-119.
[4] Opendaylight controller. https://www.opendaylight.org/ [5] Ryu controller. http://osrg.github.io/ryu/
[6] POX controller. http://www.noxrepo.org/pox/about-pox/. [7] NOX controller. http://www.noxrepo.org/nox/about-nox/. [8] NetIDE Project source code. https://github.com/fp7-netide/Engine [9] Aranda Gutierrez, P. A., Karl, H., Rojas, E., Leckey, A. (2015, June).
On Network Application representation and controller independence in SDN. In Networks and Communications (EuCNC), 2015 European Conference on (pp. 429-433). IEEE.
[10] Pyretic programming language. http://frenetic-lang.org/pyretic/ [11] Open Networking Foundation (ONF), 2014. [Online]. Available:
https://www.opennetworking.org/
[12] Canini, M., Venzano, D., Peresini, P., Kostic, D., Rexford, J. (2012, April). A NICE Way to Test OpenFlow Applications. In NSDI (Vol. 12, pp. 127-140).
[13] Sherwood, R., Chan, M., Covington, A., Gibb, G., Flajslik, M., Hand-igol, N., ... Parulkar, G. (2010). Carving research slices out of your production networks with OpenFlow. ACM SIGCOMM Computer Com-munication Review, 40(1), 129-130.
[14] Al-Shabibi, A., De Leenheer, M., Gerola, M., Koshibe, A., Parulkar, G., Salvadori, E., Snow, B. (2014, August). OpenVirteX: Make your virtual SDNs programmable. In Proceedings of the third workshop on Hot topics in software defined networking (pp. 25-30). ACM. [15] Dixit, A., Kogan, K., Eugster, P. (2014, October). Composing
heteroge-neous SDN controllers with flowbricks. In Network Protocols (ICNP), 2014 IEEE 22nd International Conference on (pp. 287-292). IEEE. [16] Layman, L., Diep, M., Nagappan, M., Singer, J., DeLine, R., Venolia,
G. (2013, October). Debugging revisited: Toward understanding the debugging needs of contemporary software developers. In Empirical Software Engineering and Measurement, 2013 ACM/IEEE International Symposium on (pp. 383-392). IEEE.
[17] J.D. Case, M. Fedor, M.L. Schoffstall, and J. Davin. Simple Network Management Protocol (SNMP). RFC 1098, April 1989. Obsoleted by RFC 1157.
[18] Handigol, N., Heller, B., Jeyakumar, V., Mazires, D., McKeown, N. (2014, April). I know what your packet did last hop: Using packet histories to troubleshoot networks. In Proc. NSDI.
[19] Ripcord-Lite for POX): A simple network controller for OpenFlow-based data centers. https://github.com/brandonheller/riplpox.
[20] Sethi, D., Narayana, S., Malik, S. (2013, October). Abstractions for model checking SDN controllers. In Formal Methods in Computer-Aided Design (FMCAD), 2013 (pp. 145-148). IEEE.
APPENDIX
In this appendix, an overview of RabbitMQ technology is exposed, citing its operating principles and its main advan-tages.
RabbitMQ is one of the technologies that implements AMQP (an open standard application layer protocol for ex-changing messages between applications. This protocol deter-mines the behavior of the server that provides the messages and the behavior of the client). It is based on a broker architecture, which means that all information (all messages generated by an application and sent to another) will be intercepted by a central element that will be the responsible for distributing those messages to the consumer application or
delete these messages (broker). In other words, the communi-cation between two applicommuni-cations will never be direct, without passing first through the middle element (described above).
On one hand, several advantages are found using the broker-architecture approach:
• Complete independence between applications. The client
application does not have to know where the consuming application is, in fact there may be no message consumer. It only needs to know how to send messages to the broker, which will route the messages to the right applications based on business criteria (queue name, routing key, topic, message properties, etc.) rather than on physical topology (IP addresses, host names).
• It is not necessary that the lifetime of applications over-lap, because the messages sent by the first application will be kept in the broker and the receiver application will be able to retrieve these messages any time later.
• Even if the application fails, messages sent to the broker will be buffered there.
On the other hand, there are some drawbacks, which should be taken into account:
• Since all messages must pass through the broker, there
is some overhead in this element, causing a bottleneck, deteriorating the performance between applications (e. g. increasing latency).
• There is a single point of failure in the broker.
Apart from all the advantages offered in a broker architec-ture, this software also provides other features that make it even more exible:
• Libraries are available for almost all programming lan-guages.